 Open Access Article
Creative Commons Attribution 3.0 Unported Licence
Correlating structure and photophysical properties in thiazolo[5,4-d]thiazole crystal derivatives for use in solid-state photonic and fluorescence-based optical devices†
Abhishek
Shibu
 ,
Sean
Jones
,
P. Lane
Tolley
,
David
Diaz
,
Sean
Jones
,
P. Lane
Tolley
,
David
Diaz
 ,
Carly O.
Kwiatkowski
,
Daniel S.
Jones
,
Jessica M.
Shivas
,
Carly O.
Kwiatkowski
,
Daniel S.
Jones
,
Jessica M.
Shivas
 ,
Jonathan J.
Foley
IV
 ,
Thomas A.
Schmedake
 and
Michael G.
Walter
 *
*
Department of Chemistry, University of North Carolina at Charlotte, Charlotte, North Carolina 28223, USA. E-mail: Michael.Walter@charlotte.edu
First published on 20th October 2023
Abstract
There is a growing demand for new fluorescent small molecule dyes for solid state applications in the photonics and optoelectronics industry. Thiazolo[5,4-d]thiazole (TTz) is an organic heterocycle moiety which has previously shown remarkable properties as a conjugated polymer and in solution-based studies. For TTz-based small molecules to be incorporated in solid-state fluorescence-based optical devices, a thorough elucidation of their structure–photophysical properties needs to be established. Herein, we have studied four TTz-based materials functionalized with alkyl appendages of varying carbon chain lengths. We report the single crystal structures of the TTz derivatives, three of which were previously unknown. The packing modes of the crystals reveal that molecular arrangements are largely governed by a chorus of synergistic intermolecular non-covalent interactions. Three crystals packed in herringbone mode and one crystal packed in slipped stacks proving that alkyl appendages modulate structural organization in TTz-based materials. Steady state and time-resolved photophysical properties of these crystals were studied via diffuse-reflectance, micro-Raman, and photoluminescence spectroscopy. The crystals fluoresce from orange-red to blue spanning through the whole gamut of the visible spectrum. We have established that photophysical properties are a function of crystal packing in symmetrically substituted TTz-based materials. This correlation was then utilized to fabricate crystalline blends. We demonstrate, for the first time, that symmetrically substituted donor–acceptor–donor TTz-based materials can be used for phosphor-converted color-tuning and white-light emission. Given the cost effectiveness, ease of synthesis and now a structure–photophysics correlation, we present a compelling case for the adoption of TTz-based materials in solid-state photonic and fluorescence-based optical devices.
1. Introduction
In the last few decades, small organic molecular dyes have proven to be pivotal for a plethora of optical and photonic applications such as organic light emitting diodes, photovoltaics, sensors, dye mediated phototherapeutics, etc.1–10 The economies built around these technologies depend heavily on the discovery and development of new dyes for its sustained growth. For example, there is presently a strong demand for organic phosphor-converted (pc) white-light-emitting-diodes (WLED) in the solid-state lighting industry.11–14 Ideal candidates for this application would exhibit high fluorescence, high thermal and moisture stability, inexpensive processability and should be free of rare-earth-elements. Thiazolo[5,4-d]thiazole (TTz) is a heterocycle moiety which exhibits all these characteristics.15–18 TTz-based materials are inexpensive and facile to synthesize. Their strong electronegativity renders a high level of oxidative stability. They are thermally stable above 200 °C and it is easy to functionalize these materials with a broad array of groups to modulate their photophysical properties. Due to their versatile tunability, they have been previously studied in the context of voltage sensitive dyes, solar cells, sensors, and metal–organic framework mediated photon up-conversion.19–22 However, to our knowledge, no attempts have been made to utilize TTz based materials for organic pc-WLED applications. This is arguably because there remains much to be understood regarding excited-state energy (exciton) management in these dyes particularly as symmetrically substituted donor–acceptor–donor (D–A–D) based materials in the solid state.A variety of TTz-containing polymeric materials have been studied for photocatalysis, electrical conductivity, and solar cell applications showing versatile photophysical properties, strong electron withdrawing capabilities and high charge mobilities.23–28 Exciton management in small molecule symmetrically substituted D–A–D-based TTzs has however been relatively underexplored. If small molecule symmetrically substituted D–A–D-based TTz dyes are to be integrated in photonic and optical devices on a mass scale, a thorough elucidation of their structure and photophysical properties in the solid state is required. This is a challenging task since aggregation-caused-quenching-effects and many-body-effect complicate the study of exciton dynamics and structure–photophysical property relationships in solid-state materials.29 Although few groups have reported on this relationship in the past utilizing D–A–D TTzs, a methodical study with a high degree of control over this correlation is yet to be established.30,31 To address this gap of knowledge of exciton management in solid-state symmetrically substituted D–A–D TTzs, we strategically synthesized four symmetrically substituted TTz-based materials functionalized with alkyl appendages of varying lengths. Since photophysical properties, such as singlet radiative recombination rates in the solid state, is a function of neighboring transition dipole orientation and distance, it was crucial to resolve the packing in crystals.32 We have addressed three questions: (1) will variations in alkyl chain lengths modulate molecular packing in TTz-based crystals? (2) will modulation of molecular packing influence photophysical properties like exciton recombination lifetime and photoluminescence emission? (3) can these crystals be utilized for color-tuning and pc-white-light emission applications in the solid state? herein, we report their crystal structures, molecular packing, steady state, and time-resolved photophysical properties. We have also studied crystalline blends of these materials for color-tunability in phosphor-converted light emission applications. Lastly, we report white-light emissive crystalline mixtures utilizing alkoxyphenyl TTz blends.
2. Results and discussion
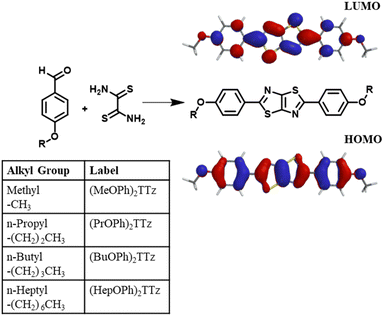
To study exciton management in D–A–D solid-state TTz-based materials, we functionalized the TTz core with symmetric para-substituted dialkoxyphenyl groups with varying alkyl chain lengths (Fig. 1).The π conjugation of the electron acceptor TTz central heterocycle moiety is further extended by the phenyl groups on either side. This extended conjugated backbone broadens the ensemble of excited states into a quasi-continuous ‘band’ leading to increased probability density of excitons diffused over individual chromophores. This extended excited state band will influence excitonic coupling with neighboring molecules in condensed matter states via non-covalent intermolecular interactions.29 Alkoxy appendages would serve as electron donor groups (Fig. 1). Alkyl appendages of varying lengths are remarkable candidates for use as donor groups to explore exciton manipulation.33–37 Variation in their lengths has negligible effect on the electronics of the molecule. However, they have been previously shown to influence intermolecular packing in the solid state.38–41 This unique property of alkyl groups makes them highly suitable electron donors when establishing excitonic characteristics of a central organic moiety in solid-state materials.
2.1. Structural studies
The crystals packed in either monoclinic (P21/c) or triclinic (P![[1 with combining macron]](https://www.rsc.org/images/entities/char_0031_0304.gif) ) unit cell. Interestingly, the crystals that packed in monoclinic type showed a perfect correlation between volume of unit cell and alkyl chain length, (Fig. S2, ESI†). Crystallographic data reveals high degree of planarity in all molecules except in the case of (PrOPh)2TTz where the final carbon atom on the alkyl appendage is turned 113° out of the TTz plane following a trans conformation.
) unit cell. Interestingly, the crystals that packed in monoclinic type showed a perfect correlation between volume of unit cell and alkyl chain length, (Fig. S2, ESI†). Crystallographic data reveals high degree of planarity in all molecules except in the case of (PrOPh)2TTz where the final carbon atom on the alkyl appendage is turned 113° out of the TTz plane following a trans conformation.
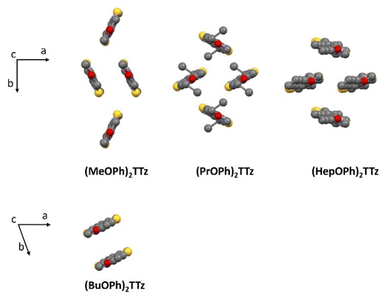 | ||
| Fig. 2 Crystal packing diagram of (CnOPh)2TTz unit cell. Top panel: Herringbone packing mode series; Bottom panel: slipped stack packing mode. H atoms are omitted for clarity. | ||
(MeOPh)2TTz, (PrOPh)2TTz, and (HepOPh)2TTz arranged in herringbone pattern while (BuOPh)2TTz arranged in slipped stacks. SC-XRD packing data was used in conjunction with CrystalExplorer17 software package at B3LYP/6-31G(d,p) level to aid in establishing which intermolecular interactions would influence energy flux in the TTz crystals.45 Fig. S3 (ESI†) depicts color-coded geometry-based pictorial representation of interaction energies in TTz crystals with respect to one central reference molecule. Details of these interaction energies have been enumerated in Table S2 (ESI†). Based on the experimental and modeling data, molecular pairs of distinct geometric arrangements were extrapolated and have been shown in Fig. 3 with emphasis on the intermolecular interactions.
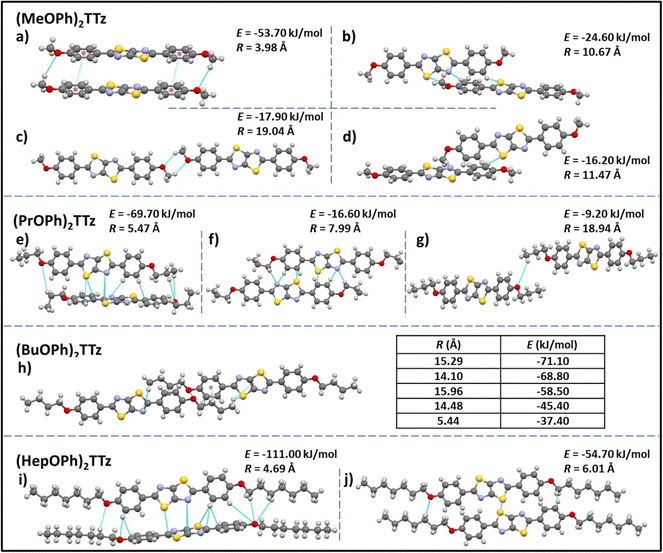 | ||
| Fig. 3 Unique intermolecular non-covalent interactions and orientation among (CnOPh)2TTz extrapolated from crystal packing and modeling studies. E is the total energy of interaction among the molecular pairs. The distance between molecular centroids is denoted by R. (cf. Tables S2, S3 and Fig. S3, ESI†). | ||
All the intermolecular interactions from crystal packing studies have been enumerated and discussed further in Table S3 (ESI†). In the case of (MeOPh)2TTz four unique molecular orientations can be observed. The cofacial arrangements (Fig. 3a and c) have close C–H–O interactions at 2.9 and 2.5 Å, respectively. In Fig. 3a, the molecules align similar to an H-type aggregate with a slipping angle of 101.93°. The TTz cores and phenyl rings stack on top of each other in this arrangement. The centroids of the phenyl rings are 3.9 Å apart. The π–π stacking arrangement could be the reason why this pair has the highest total energy of interactions in this crystal (−53.70 kJ mol−1) with the highest contribution from dispersion energy component. There are two orthogonal arrangements in the (MeOPh)2TTz crystal, (Fig. 3b and d). In both these arrangements, the alkyl chain and phenyl ring interact with the π conjugated TTz core. In (PrOPh)2TTz crystal, molecules arrange in three conformations. Among these, the orthogonal orientation (Fig. 3e) has the highest number of possible interactions with contacts distributed throughout the molecule. This arrangement also has the highest number of pairs (N = 4), and the highest energy of interactions (−69.70 kJ mol−1) in this crystal. Most of these contacts are interacting with the TTz core. One of the two cofacial arrangements (Fig. 3f) has multiple interactions with the TTz core as well. Also, among the orthogonal (Fig. 3e) and cofacial (Fig. 3g) arrangements there are multiple C–H–O interactions present. In the case of (BuOPh)2TTz crystal, the alkyl appendages are responsible for all the interactions. The molecules arrange in J-type cofacial slipped stacks, Fig. 3h, with C–H–(O, N, S, πphenyl![[thin space (1/6-em)]](https://www.rsc.org/images/entities/char_2009.gif) centroid, and TTzcentroid) interactions. The proximity of the molecules and the uniform cofacial arrangement results in very similar total energy of interactions among the pairs (−37.40 to −71.10 kJ mol−1) with the highest contribution from the dispersion energy. In (HepOPh)2TTz crystal, the orthogonal arrangement (Fig. 3i) is the most stable pair among all the molecular pairs depicted in Fig. 3 with total energy of interactions at −111 kJ mol−1. This could be because there are multiple interaction sites throughout the molecule pair. (HepOPh)2TTz also has a cofacial pair with C–H–O and S–S interaction.
centroid, and TTzcentroid) interactions. The proximity of the molecules and the uniform cofacial arrangement results in very similar total energy of interactions among the pairs (−37.40 to −71.10 kJ mol−1) with the highest contribution from the dispersion energy. In (HepOPh)2TTz crystal, the orthogonal arrangement (Fig. 3i) is the most stable pair among all the molecular pairs depicted in Fig. 3 with total energy of interactions at −111 kJ mol−1. This could be because there are multiple interaction sites throughout the molecule pair. (HepOPh)2TTz also has a cofacial pair with C–H–O and S–S interaction.
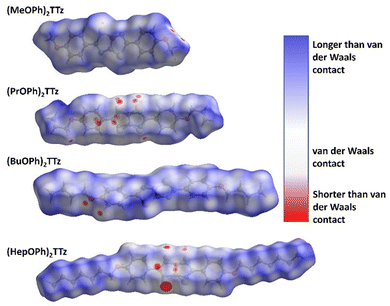
It is not enough to establish all the non-covalent intermolecular contacts in a crystal. Intermolecular interactions are inherently competitive. Since the aim of this study is to establish structure–property relationship in TTz crystals, it is important to ascertain which interactions would dominate the crystal packing. To address this problem, we simulated Hirshfeld surfaces of the molecules in the crystal unit cell. Hirshfeld surface simulations quantifies the intermolecular atomic contacts in the crystal using the descriptor dnorm. The normalized interatomic contact distance (dnorm) accounts for contact distances between nearest atoms present inside (di) and outside (de) the simulated surface and is expressed using eqn 1.
 | (1) |
All the types and distribution of relative contributions of intermolecular contacts to the Hirshfeld surface area for the (CnOPh)2TTz crystals have been provided in Fig. S5 (ESI†). In Fig. 4a, significant interaction sites near the alkyl appendage and the oxygen atom of the (MeOPh)2TTz molecule is observed. These sites represent the C–H–O bonding which was depicted in the cofacially arranged molecules in Fig. 3a and c. There is also a faint interaction site visible at the TTz core. This interaction is caused by the orthogonal arrangements in the crystal. In the case of (PrOPh)2TTz, many interaction sites are visible. Most of these sites are localized around the TTz core and phenyl rings indicating that the π conjugated backbone of the molecule is well connected with other molecules within the crystal. The most dominant interaction in (BuOPh)2TTz is the C–H–O contact. This interaction is established between the phenyl ring and oxygen atom of neighboring molecules. The TTz core of (HepOPh)2TTz molecule is strongly interacting with the orthogonal and cofacial molecules. The big red spot on the TTz core is indicative of the many sulfur-based contacts in this crystal.
A salient packing-dependent feature of organic solid-state materials that influences photophysical and excitonic properties is π–π stacking. The Shape Index feature of Hirshfeld surfaces was utilized to ascertain the presence of π–π stacking in the (CnOPh)2TTz crystals. The results are shown in Fig. S6 (ESI†). (MeOPh)2TTz crystals show evidence for π–π stacking around the phenyl rings. The stacking is caused because the phenyl centroids of cofacial (MeOPh)2TTz molecules interact with each other in a crystal environment. It must be noted that (MeOPh)2TTz was the only crystal among the four TTz derivatives in this study that exhibited pronounced π–π stacking. (BuOPh)2TTz exhibited signs of stacking along the alkyl chain. These were caused by C–H–π interactions.
Based on the single-crystal X-ray diffraction experiments and computational modeling, we can arrive at the following conclusions about the crystal packing of (CnOPh)2TTz crystals and excitonic property predictions. The cofacial molecular pair in (MeOPh)2TTz crystal is the most stable intermolecular configuration in this crystal with high dispersion energy. This pair also has significant π–π stacking which could lead to exciton formation diffused over multiple molecules. Such geometry-energy related effects could result in significantly red-shifted PL emission spectra and long singlet lifetimes.34 The π conjugated backbone of (PrOPh)2TTz is well connected to other molecules in the crystal. The most stable of these interactions are with orthogonally oriented molecules. This could lead to a broad PL emission spectrum and release of low energy photons. The (BuOPh)2TTz arranged in J-type cofacial slipped stacks with most interactions limited to the alkoxy appendages. The similar total energy of interactions among the molecular pairs along with the high contribution from dispersion energy component indicates to the possibility of exciton delocalization over multiple molecules and relaxation of excited energy via non-radiative pathways. Therefore, it can be predicted that the PL emission spectral shape and singlet radiative recombination rates of (BuOPh)2TTz crystal would resemble its solution counterpart while non-radiative pathways could lead to loss of luminescence efficiency. The TTz core of (HepOPh)2TTz is connected through multiple contacts with neighboring orthogonally oriented molecules. These interactions have the highest total energy among the four TTz crystal derivatives and thus would play the dominant role in excitonic properties of this crystal. The orthogonal orientation would result in a broad ensemble of excited state bands which could encourage exciton delocalization. Such delocalization could result in long exciton lifetimes, broad PL emission profile, and release of low energy photons. Crystallographic studies thus conclusively prove that small variations in alkyl chain length, a rather understated donor group, leads to a wide range of modulation in molecular packing in TTz-based crystals.
2.2. Photophysical studies
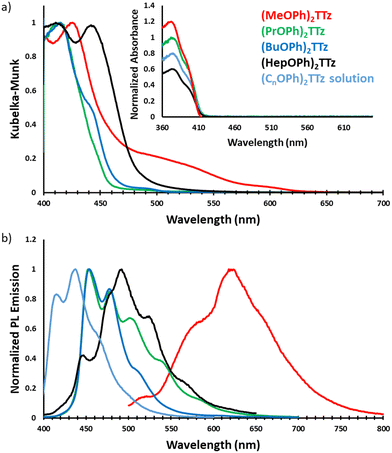
TTz-based symmetrically substituted crystals have significantly red-shifted spectra when compared to their solution counterparts. They also exhibit wide variance in their absorption characteristics when compared to each other. These features can be attributed to the unique intermolecular transition dipole orientation and arrangement previously elucidated from crystal packing studies. Since many molecules in a crystal interact with an external field through their local polarizabilities, the energy of each molecular pair established above was considered, Table S2 (ESI†). As shown earlier, (MeOPh)2TTz has 4 unique molecular pair arrangements. The orthogonal pair depicted in Fig. 3d has the lowest energy, −16.20 kJ mol−1. This would explain why (MeOPh)2TTz crystal has the smallest bandgap. The highest polarization energy in this derivative was represented by the cofacial pair depicted in Fig. 3a, −53.70 kJ mol−1. This wide range of energies exhibited by the molecular pairs of this crystal could explain the broad absorption spectral profile. The three remaining crystal derivatives have at least 1 pair with high energy of >70 kJ mol−1. In the presence of such strongly polarizable pairs, signals from other pairs could be suppressed. Interestingly, a shoulder in the case of (BuOPh)2TTz at 443 nm can be observed which could be indicative of strong excitonic coupling within the intermolecular planes. For (HepOPh)2TTz, the peak at 416 nm is caused by the cofacial molecular arrangement depicted in Fig. 3j. However, it must be noted that the orthogonal arrangement shown in Fig. 3i is the most energetically stable pair not just in this crystal, but among all the arrangements established in this study, and hence could be responsible for the strong transition at 444 nm leading to the broad spectra and second smallest excitonic bandgap in the TTz crystal series.
Images of the crystals are shown below (Fig. 6).
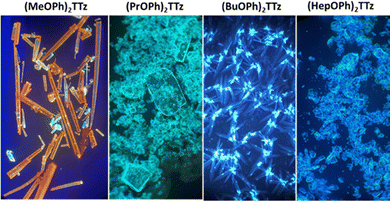 | ||
| Fig. 6 Images of (CnOPh)2TTz illuminated by UV lamp (400 nm) and viewed under an optical microscope at 10× magnification. | ||
All TTz crystals have red-shifted PL emission when compared to the solution state. (PrOPh)2TTz and (BuOPh)2TTz have the least red-shifted spectra. (BuOPh)2TTz has a relatively sharp emission profile, similar to TTz solution, and hence has blue emission in the solid state. (PrOPh)2TTz has a broad emission profile which renders the crystals cyan fluorescence. The secondary peaks and broad profile could be the result of the low photon energy release from the orthogonal molecular interaction. The effect of the orthogonal interaction is maximized in emission spectra of (HepOPh)2TTz. The transition at 450 nm typically seen among the cofacial pairs in this crystal series is suppressed by the peak at 495 nm. (MeOPh)2TTz has the most red-shifted spectra, and the crystals fluoresce orange-red. This red emission could be due to the weak polarization energy discussed earlier. Among all molecular arrangements established in this study, (MeOPh)2TTz has the most easily polarizable pairs. The orthogonal molecular arrangement depicted in Fig. 3d could be responsible for the drastic red-shift in this crystal. Recently, Wei et al. reported on the origin of red shifted transition in a very similar TTz-based crystal.46 They propose that the shift is caused mainly due to excitation polarization of unparalleled aggregates. This interpretation would be in congruence with our hypothesis as well. The wide overlap between the absorbance and emission spectrum of (MeOPh)2TTz could be caused due to anisotropy and is typical with organic crystals.47 The green emission in the crystal image was maximized by the peak at 525 nm in the emission profile. This is due to surface-to-kernel effect where surface energy perturbs the crystal packing, inducing defects-related-effects.46,48
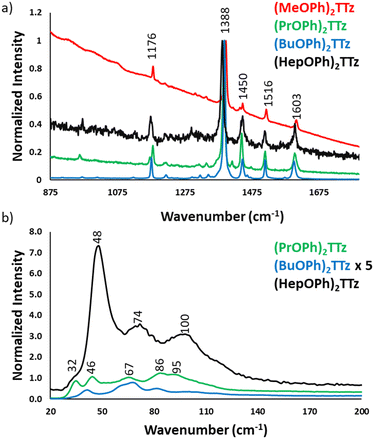
To further investigate if modulation of molecular packing in crystals would influence the excited state photophysical properties, the TTz crystals were characterized using micro-Raman spectroscopy, Fig. 7.
Since the central diphenyl TTz moiety is common in all the derivatives, the spectral signature in the fingerprint region, 875 to 1800 cm−1, is the same in all the crystals, Fig. 7a. The experimental data was verified with DFT simulation and peak assignments have been shown in Fig. S8 (ESI†). It is, however, interesting to note the difference in the intensity of the spectra. (BuOPh)2TTz exhibited the highest signal to noise ratio with sharp and highly resolved peaks. This was expected since the packing studies revealed that intermolecular interactions are limited to the alkoxy region in this crystal. The crystals that packed in herringbone pattern displayed peaks at much lower intensity.
The region of particular interest lies from 10 to 200 cm−1, Fig. 7b. This region represents lattice-phonon vibration frequencies and has been probed in various studies to identify intermolecular packing dependent effects on photophysical properties in organic crystals.49–52 The low-energy modes are highly sensitive to molecular packing, which explains the observed difference shown above. All the spectra have been normalized by maintaining the C![[double bond, length as m-dash]](https://www.rsc.org/images/entities/char_e001.gif) N vibration of the thiazole ring at 1388 cm−1 constant. Interestingly, (BuOPh)2TTz, which displayed the most intense spectral features in the >800 cm−1 region had highly muted signals in the <200 cm−1 region. The spectrum was amplified by a factor of 5 in the interest of clarity. This further contributes to the packing dependent studies revealing that the intermolecular interactions are localized in the alkoxy appendage. The weak lattice-phonon vibrations juxtaposed against the sharp, unperturbed spectral features from the conjugated backbone would support the prediction that (BuOPh)2TTz crystal would exhibit excitonic characteristics similar to its solution counterpart. (HepOPh)2TTz crystal did not exhibit highly sharp features in the >800 cm−1 region. However, it has the strongest lattice vibration in the sub 200 cm−1 region with three clear bands. This remarkably intense spectral feature in the weak-energy modes indicates that excited states in this material would prefer to relax via lattice-phonon vibrations leading to low exciton radiative rates and poor fluorescence efficiency. (PrOPh)2TTz exhibited the second most intense spectral feature in the sub 200 cm−1 region. Most of the bands are similar to (HepOPh)2TTz, albeit in different relative ratio. This was expected since both monoclinic crystals pack in herringbone pattern but display subtle differences in intermolecular interaction types and energies. Unfortunately, (MeOPh)2TTz did not yield any resolvable spectral feature in the lattice vibration region, Fig. S9 (ESI†). Nevertheless, it is clear that the alkyl appendages modulate the steady state photophysical properties of these crystals drastically.
N vibration of the thiazole ring at 1388 cm−1 constant. Interestingly, (BuOPh)2TTz, which displayed the most intense spectral features in the >800 cm−1 region had highly muted signals in the <200 cm−1 region. The spectrum was amplified by a factor of 5 in the interest of clarity. This further contributes to the packing dependent studies revealing that the intermolecular interactions are localized in the alkoxy appendage. The weak lattice-phonon vibrations juxtaposed against the sharp, unperturbed spectral features from the conjugated backbone would support the prediction that (BuOPh)2TTz crystal would exhibit excitonic characteristics similar to its solution counterpart. (HepOPh)2TTz crystal did not exhibit highly sharp features in the >800 cm−1 region. However, it has the strongest lattice vibration in the sub 200 cm−1 region with three clear bands. This remarkably intense spectral feature in the weak-energy modes indicates that excited states in this material would prefer to relax via lattice-phonon vibrations leading to low exciton radiative rates and poor fluorescence efficiency. (PrOPh)2TTz exhibited the second most intense spectral feature in the sub 200 cm−1 region. Most of the bands are similar to (HepOPh)2TTz, albeit in different relative ratio. This was expected since both monoclinic crystals pack in herringbone pattern but display subtle differences in intermolecular interaction types and energies. Unfortunately, (MeOPh)2TTz did not yield any resolvable spectral feature in the lattice vibration region, Fig. S9 (ESI†). Nevertheless, it is clear that the alkyl appendages modulate the steady state photophysical properties of these crystals drastically.
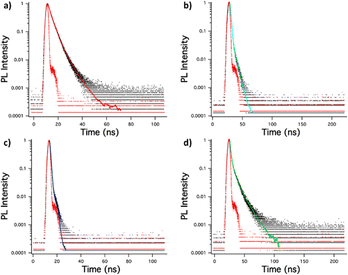 | ||
| Fig. 8 Singlet emission lifetime decay of (a) (MeOPh)2TTz, (b) (PrOPh)2TTz, (c) (BuOPh)2TTz, (d) (HepOPh)2TTz crystals. | ||
It is interesting to note that the crystals exhibited much longer lifetimes than their solution counterparts. This is expected since bulk organic aggregates require higher reorganization energy than molecular monomers in dilute solutions.29 The fluorescence decay lifetime of the TTz based crystals was used along with their quantum yield to ascertain luminescence efficiency. This has been shown in Table 1 along with excitonic bandgap of the materials derived from absorbance Tauc plot.
| Material | E g (eV) | Φ F (%) | τ avg (ns) | k r (s−1) | k nr (s−1) |
|---|---|---|---|---|---|
| (MeOPh)2TTz | 2.46 | 10 | 3.35 | 2.99 × 10⁷ | 2.69 × 10⁸ |
| (PrOPh)2TTz | 2.73 | 27 | 1.66 | 1.63 × 10⁸ | 4.40 × 10⁸ |
| (BuOPh)2TTz | 2.74 | 4 | 0.67 | 6.43 × 10⁷ | 1.43 × 10⁹ |
| (HepOPh)2TTz | 2.52 | 0.4 | 2.34 | 1.58 × 10⁶ | 4.26 × 10⁸ |
| (CnOPh)2TTz (solution) | 2.98 | 28 | 0.54 | 5.19 × 10⁸ | 1.33 × 10⁹ |
(MeOPh)2TTz crystal exhibited the longest singlet lifetime in the series. This could be because of the pi–pi stacking revealed from the Hirshfeld analysis. Another reason for the long lifetime could be the low polarization energy of the molecular pairs in this crystal. (HepOPh)2TTz crystal has the second longest singlet lifetime, however, it also has the lowest ΦF. This could be because the highly energetically stable molecular pairs facilitate exciton delocalization diffused over multiple molecules in the crystal. (PrOPh)2TTz has the shortest singlet lifetime in the herringbone packing series. However, it has a remarkably high ΦF. The radiative rate in this crystal is comparable with its solution counterpart which is rare among similar molecular systems. The high radiative rates could be because all the intermolecular interactions in this derivative are centered around the TTz heterocycle. The slipped stacked (BuOPh)2TTz exhibited radiative decay lifetime similar to its solution state. This could be because of the limited geometry-energy related effects in this derivative. However, the ΦF and knr suggest that the stacking localized around the alkoxy appendages in this J-type aggregate facilitates exciton delocalization.
Clearly, alkyl appendages induced structural modifications in symmetrically substituted D–A–D TTz-based crystals result in predictable modulation of photophysical properties. The change in photophysical properties is a function of molecular packing in these crystals. Having established a correlation between structure and photophysical properties in TTz-based crystals, we demonstrate the relevance of such a pedagogical study by fabricating novel TTz-based crystalline blends for all-organic phosphor-converted color-tuning and white-light emission applications.
2.3. CIE engineering
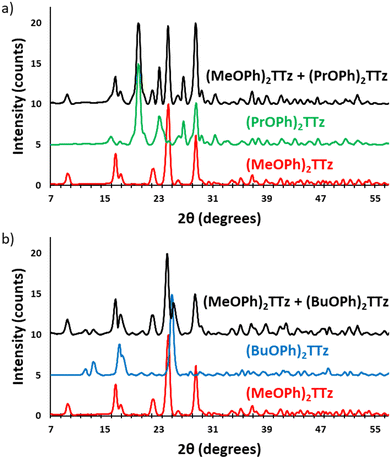
In the following section, the use of symmetrically substituted D–A–D dialkoxyphenyl TTz crystalline blends for generating a broad range of phosphor-converted light emission is demonstrated. We also prove that these crystalline blends can be used for generating white-light emission.To determine if the crystalline blends are consistent with the single-crystal structural properties we have established above, the powder X-ray diffractograms of drop cast TTz crystals were compared with the powder diffractograms generated from the SC-XRD studies, (Fig. S7, ESI†). Since the XRD pattern of the drop cast crystals were found to be in strong agreement with the single-crystal studies, it stands to reason that they will also exhibit similar photophysical properties. Two sets of parent TTz crystals were chosen based on their diverse PL emission resulting in a potentially wide color-tuning window. The crystallinity of the resultant blends was investigated (Fig. 9).
The X-ray diffractograms are conclusive proof that the TTz blends have the crystalline properties of the parent TTz derivatives. Since photophysical properties are a function of crystal packing, excitons can be managed by modulating the parent TTz contribution in the blends. Therefore, the blend proportions were tuned and studied for color-tuning and white-light emission.
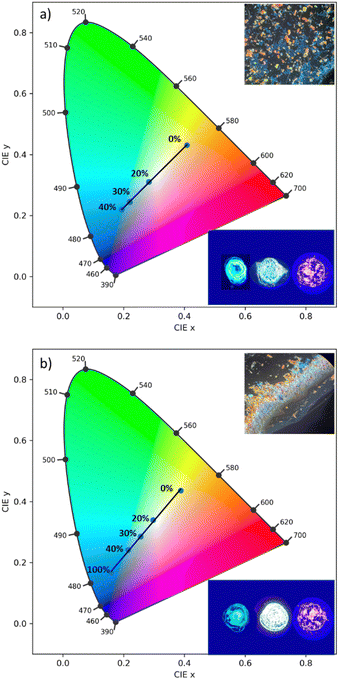
Utilizing the multi-fluorochromaticity of the symmetrically substituted dialkoxyphenyl TTz crystals, mixtures of the aggregates were drop cast on glass substrates from saturated DCM solutions with varying proportions by weight, (Fig. 10). In set 1 (Fig. 10(a)), orange-red emissive (MeOPh)2TTz crystals were mixed with varying proportions of cyan (PrOPh)2TTz crystal fluorophores. Set 2, (Fig. 10(b)), comprised of yellow fluorescent crushed (MeOPh)2TTz crystals with varying proportions of blue emissive (BuOPh)2TTz crystals.
The CIE plots establish that TTz crystals can be utilized for fabrication of multi-fluorochromic mixtures in the solid state. Increasing the contribution of (PrOPh)2TTz and (BuOPh)2TTz shifts the emission from (MeOPh)2TTz's orange-red to blue. This was consistent with our predictions based on the steady state photophysical properties established earlier in this study. The fluorescence of these TTz crystalline blends can be tuned to yield highly contrasting colors by just modulating the crystal concentration. The photostability of these crystals was tested under constant illumination for 5 hours, Fig. S10 (ESI†). The TTz crystals were found to be highly photostable even in ambient conditions. This additional feature strengthens the case of utilizing TTz-based materials for developing all-organic fluorescent phosphor layers with broad photoluminescence tunability. In both sets, mixtures with 4![[thin space (1/6-em)]](https://www.rsc.org/images/entities/char_2009.gif) :
:![[thin space (1/6-em)]](https://www.rsc.org/images/entities/char_2009.gif) 1 ratio by weight yielded white-light emissive blends. The simplicity in fabricating these crystalline blends presents a compelling case for utilization of TTz-based materials for photonic and fluorescence-based optical device applications such as pc-color-tuning and white-light emission.
1 ratio by weight yielded white-light emissive blends. The simplicity in fabricating these crystalline blends presents a compelling case for utilization of TTz-based materials for photonic and fluorescence-based optical device applications such as pc-color-tuning and white-light emission.
3. Experimental
3.1. Materials and instrumentation
4-n-Alkyloxybenzaldehyde and dithiooxamide were purchased from Sigma-Aldrich and used without further purification. Chloroform (CHCl3), dichloromethane (DCM), pentane, and hexanes were purchased from Alfa Aesar Chemicals and used without further purification. 1H-NMR measurements were carried out using JEOL 500 MHz NMR. Mass spectrometry measurements were obtained using a Perceptive Biosystems Voyager MALDI mass spectrometer. UV-Vis absorption spectrometric data for solution was obtained using Cary 300 UV-Vis spectrophotometer. Diffuse reflectance measurements of the crystals were collected using Cary 5000 UV-Vis spectrophotometer. Photoluminescence measurements were carried out on Jobin Yvon-Spex Fluorolog. PL decay lifetimes were obtained using a diode laser with a repetition rate of 1 MHz and excitation wavelengths of 389 nm. 9,10-Diphenylanthracene in cyclohexane was used as standard reference for quantum yield measurements.53 Solid state quantum yield measurements were carried out using QuantiPhi-2. Density functional theory (DFT) computational analysis were performed using Spartan '10 and CrystalExplorer17, at B3LYP/6-31G(D) and B3LYP/6-31G(d,p) level, respectively. The samples used for micro-Raman experiments were chosen with the aid of an optical microscope (Olympus BX41) interfaced to a Jobin Yvon XploRA PLUS Raman spectrometer, spanning the region 10–1800 cm−1. Excitation wavelength of 785 nm was chosen to avoid fluorescence. Neutral density optical filters were used to minimize the risk of crystal damage. Powder XRD θ/2θ patterns were obtained using ‘Xcalibur – Gemini ultra’ with Ni filtered Cu Kα radiation (λ = 1.541 Å) at 50 kV, 40 mA. The experiments were performed from 0° to 123.82° with 0.01 step size and a counting time of 1 s per point.Single crystal X-ray diffractometry data were acquired with an Agilent (now Rigaku) Gemini A Ultra diffractometer. Single crystals of (MeOPh)2TTz were obtained and isolated after rinsing the reaction product repeatedly with ethanol and deionized water. The crystal structure was compared with previously reported literature and found to be consistent.42 Single crystals of (PrOPh)2TTz, and (HepOPh)2TTz were grown via solvent–vapor diffusion technique with hexanes and chloroform. Single crystals of (BuOPh)2TTz were grown using solvent–liquid–liquid–diffusion method with hexanes and chloroform. Single crystals of suitable size were coated with a thin layer of paratone-N oil, mounted on the diffractometer, and flash cooled to 100 K in the cold stream of the Cryojet XL liquid S55 nitrogen cooling device (Oxford Instruments). The diffractometer was equipped with sealed-tube long fine focus X-ray sources with Mo target (λ = 0.71073 Å) and Cu target (λ = 1.5418 Å), four-circle kappa goniometer, and CCD detector. Mo target was used to characterize (MeOPh)2TTz. Cu target was used for (PrOPh)2TTz, (BuOPh)2TTz, and (HepOPh)2TTz crystals. CrysAlisPro9 software was used to control the diffractometer and perform data reduction. The crystal structure was solved with SHELXS.54 All non-hydrogen atoms appeared in the E-map of the correct solution. Alternate cycles of model-building in Olex2 and refinement in SHELXL followed.54,55 All non-hydrogen atoms were refined anisotropically. All hydrogen atom positions were calculated based on idealized geometry and recalculated after each cycle of least squares. During refinement, hydrogen atom – parent atom vectors were held fixed (riding motion constraint).
3.2. Preparation of dialkoxyphenyl TTz derivatives
4-n-Alkyloxybenzaldyde was reacted with dithiooxamide in 10 mL of DMF for 24 h at 150 °C. The resulting precipitate was collected by filtration and rinsed with water and ethanol. The product was purified using silica gel column chromatography, and purity and structure were established using TLC, 1H-NMR, and MALDI-TOF mass spectrometry.![[thin space (1/6-em)]](https://www.rsc.org/images/entities/char_2009.gif) 816). MALDI-TOF-MS (calcd for C18H14N2O2S2): 354.44, found: M = 354.66. Quantum yield in CHCl3 (λex = 375 nm, λem = 375 nm, λem = 435 nm) = 28%.
816). MALDI-TOF-MS (calcd for C18H14N2O2S2): 354.44, found: M = 354.66. Quantum yield in CHCl3 (λex = 375 nm, λem = 375 nm, λem = 435 nm) = 28%.
![[thin space (1/6-em)]](https://www.rsc.org/images/entities/char_2009.gif) :
:![[thin space (1/6-em)]](https://www.rsc.org/images/entities/char_2009.gif) DCM (1
DCM (1![[thin space (1/6-em)]](https://www.rsc.org/images/entities/char_2009.gif) :
:![[thin space (1/6-em)]](https://www.rsc.org/images/entities/char_2009.gif) 1) afforded 0.45 g (47%) of product. 1H-NMR (500 MHz, CDCl3, TMS, δ): 7.92 (d, J = 1.98 Hz, 2H), 6.97 (d, J = 1.99 Hz, 2H), 3.99 (t, J = 2 Hz, 2H), 1.84 (m, 2H), 1.06 (t, J = 2.86 Hz, 3H). UV-Vis λmax (CHCl3, ε = M−1 cm−1): 375 nm (ε = 70
1) afforded 0.45 g (47%) of product. 1H-NMR (500 MHz, CDCl3, TMS, δ): 7.92 (d, J = 1.98 Hz, 2H), 6.97 (d, J = 1.99 Hz, 2H), 3.99 (t, J = 2 Hz, 2H), 1.84 (m, 2H), 1.06 (t, J = 2.86 Hz, 3H). UV-Vis λmax (CHCl3, ε = M−1 cm−1): 375 nm (ε = 70![[thin space (1/6-em)]](https://www.rsc.org/images/entities/char_2009.gif) 183). MALDI-TOF-MS (calcd for C22H22N2O2S2, [M + H]+): 411.11, found: M = 411.06. Quantum yield in CHCl3 (λex = 370 nm, λem = 437 nm) = 28%.
183). MALDI-TOF-MS (calcd for C22H22N2O2S2, [M + H]+): 411.11, found: M = 411.06. Quantum yield in CHCl3 (λex = 370 nm, λem = 437 nm) = 28%.
![[thin space (1/6-em)]](https://www.rsc.org/images/entities/char_2009.gif) :
:![[thin space (1/6-em)]](https://www.rsc.org/images/entities/char_2009.gif) DCM (2
DCM (2![[thin space (1/6-em)]](https://www.rsc.org/images/entities/char_2009.gif) :
:![[thin space (1/6-em)]](https://www.rsc.org/images/entities/char_2009.gif) 1) afforded 0.11 g (45%) of product. 1H-NMR (500 MHz, CDCl3, TMS, δ): 7.92 (d, J = 2 Hz, 2H), 6.98 (d, J = 2.04 Hz, 2H), 4.03 (t, J = 2 Hz, 2H), 1.80 (m, 2H), 1.52 (m, 2H), 0.99 (t, J = 3 Hz, 3H). UV-Vis λmax (CHCl3, ε = M−1 cm−1): 375 nm (ε = 2
1) afforded 0.11 g (45%) of product. 1H-NMR (500 MHz, CDCl3, TMS, δ): 7.92 (d, J = 2 Hz, 2H), 6.98 (d, J = 2.04 Hz, 2H), 4.03 (t, J = 2 Hz, 2H), 1.80 (m, 2H), 1.52 (m, 2H), 0.99 (t, J = 3 Hz, 3H). UV-Vis λmax (CHCl3, ε = M−1 cm−1): 375 nm (ε = 2![[thin space (1/6-em)]](https://www.rsc.org/images/entities/char_2009.gif) 000
000![[thin space (1/6-em)]](https://www.rsc.org/images/entities/char_2009.gif) 000). MALDI-TOF-MS (calcd for C24H26N2O2S2, [M + H]+): 439.14, found: M = 439.04. Quantum yield in CHCl3 (λex = 375 nm, λem = 437 nm) = 28%.
000). MALDI-TOF-MS (calcd for C24H26N2O2S2, [M + H]+): 439.14, found: M = 439.04. Quantum yield in CHCl3 (λex = 375 nm, λem = 437 nm) = 28%.
![[thin space (1/6-em)]](https://www.rsc.org/images/entities/char_2009.gif) :
:![[thin space (1/6-em)]](https://www.rsc.org/images/entities/char_2009.gif) CHCl3 (0.5
CHCl3 (0.5![[thin space (1/6-em)]](https://www.rsc.org/images/entities/char_2009.gif) :
:![[thin space (1/6-em)]](https://www.rsc.org/images/entities/char_2009.gif) 4.5) afforded 0.20 g (55%) of product. 1H-NMR (500 MHz, CDCl3, TMS, δ): 7.93 (d, J = 1.96 Hz, 2H), 6.98 (d, J = 2 Hz, 2H), 4.02 (t, J = 2 Hz, 2H), 1.81 (quint, J = 2.17 Hz, 2H), 1.47 (m, 2H), 1.30 (m, 6H), 0.90 (t, J = 3.21 Hz, 3H). UV-Vis λmax (CHCl3, ε = M−1 cm−1): 375 nm (ε = 46
4.5) afforded 0.20 g (55%) of product. 1H-NMR (500 MHz, CDCl3, TMS, δ): 7.93 (d, J = 1.96 Hz, 2H), 6.98 (d, J = 2 Hz, 2H), 4.02 (t, J = 2 Hz, 2H), 1.81 (quint, J = 2.17 Hz, 2H), 1.47 (m, 2H), 1.30 (m, 6H), 0.90 (t, J = 3.21 Hz, 3H). UV-Vis λmax (CHCl3, ε = M−1 cm−1): 375 nm (ε = 46![[thin space (1/6-em)]](https://www.rsc.org/images/entities/char_2009.gif) 926). MALDI-TOF-MS (calcd for C30H38N2O2S2, [M + H]+): 523.24, found: M = 523.00. Quantum yield in CHCl3 (λex = 373 nm, λem = 437 nm) = 25%.
926). MALDI-TOF-MS (calcd for C30H38N2O2S2, [M + H]+): 523.24, found: M = 523.00. Quantum yield in CHCl3 (λex = 373 nm, λem = 437 nm) = 25%.
3.3. Preparation of crystalline films
Two sets of symmetrically substituted D–A–D TTz polycrystalline blends were studied for color tuning and all-organic white light emission. The materials were chosen for a wide fluorescence tuning window and discernable PL emission signal. The mixtures were drop casted on pre-cleaned glass substrates the solvent was allowed to evaporate at room temperature.3.4. Computing CIE chromaticity coordinate
The emission of the TTz dyes was characterized by their location on a 2D color space known as chromaticity diagram. The chromaticity diagram is defined by the x, y coordinates defined as | (2) |
 | (3) |
 | (4) |
 | (5) |
![[x with combining macron]](https://www.rsc.org/images/entities/i_char_0078_0304.gif) (λ), ȳ(λ),
(λ), ȳ(λ), ![[z with combining macron]](https://www.rsc.org/images/entities/i_char_007a_0304.gif) (λ) are the CIE 1931 standard color matching functions, and the integration limits span visible wavelengths, i.e. λ1 = 380 nm and λ2 = 780 nm.56 We utilize the WPTherml software package57 to parse the experimental emission spectra and compute the CIE (x, y) coordinates through eqn (1) and (2), and the colour58 software package to render the CIE (x, y) coordinates as colors on the standard CIE chromaticity diagram and color gamut.
(λ) are the CIE 1931 standard color matching functions, and the integration limits span visible wavelengths, i.e. λ1 = 380 nm and λ2 = 780 nm.56 We utilize the WPTherml software package57 to parse the experimental emission spectra and compute the CIE (x, y) coordinates through eqn (1) and (2), and the colour58 software package to render the CIE (x, y) coordinates as colors on the standard CIE chromaticity diagram and color gamut.
4. Conclusions
TTz-based materials have recently been used for a plethora of optical and optoelectronic applications. Studies utilizing TTz-based materials in the solid state mostly focus on polymeric materials. TTz-based materials have been seldom studied as a small molecule fluorescent dye in the solid state. Arguably this is because there is a significant gap of knowledge in correlating structure with photophysical properties in solid-state symmetrically substituted D–A–D TTz-based materials. In this study, we strategically functionalized TTz-based moiety with varying lengths of alkyl chain appendages. We have established that varying the alkyl chain length modulates the packing mode of these crystalline materials. The variation in packing modes is largely governed by a chorus of synergistic intermolecular non-covalent interactions. We have also established that modulation of crystal packing modes tunes the TTz photophysical properties such as their excitonic bandgap, photoluminescence emission, exciton lifetime, and lattice-phonon vibrational characteristics. The correlation between structure and photophysical properties of symmetrically substituted D–A–D TTz-based materials was then applied to fabricate crystalline blends. We utilized the multi-fluorochromic property of these materials to demonstrate that TTz-based crystals can be used for phosphor-converted color-tuning and white-light-emitting-diode applications. The cost effectiveness, solution processability and environment-friendly features of TTz-based materials present a compelling argument for their incorporation in solid-state photonic and fluorescence-based optical devices. This study will be crucial for the development of photonic materials and devices comprising of TTz-based small molecular fluorescent dyes.Abbreviations
| TTz | Thiazolo[5,4-d]thiazole |
| (MeOPh)2TTz | 2,5-Bis(4-methoxyphenyl)thiazolo[5,4-d]thiazole |
| (PrOPh)2TTz | 2,5-Bis(4-propoxyphenyl)thiazolo[5,4-d]thiazole |
| (BuOPh)2TTz | 2,5-Bis(4-butoxyphenyl)thiazolo[5,4-d]thiazole |
| (HepOPh)2TTz | 2,5-Bis(4-heptyloxyphenyl)thiazolo[5,4-d]thiazole. |
Author contributions
Conceptualization: A. S., M. G. W.; formal analysis: A. S., T. A. S., L. T.; investigation: A. S., S. J., D. S. J., D. D., C. O. K., J. M. S., T. A. S.; methodology: A. S., J. M. S., T. A. S., J. J. F., M. G. W.; resources: D. S. J., T. A. S., J. J. F., M. G. W.; software: A. S., S. J., D. S. J., L. T., J. J. F., T. A. S.; supervision: M. G. W.; validation: M. G. W.; visualization: A. S., L. T., J. J. F., M. G. W.; writing – original draft: A. S.; writing – review and editing: A. S., M. G. W.Conflicts of interest
There are no conflicts to declare.Acknowledgements
This research was funded by the Department of Chemistry at the University of North Carolina at Charlotte, the Nanoscale Science PhD program, and the National Institute of General Medical Sciences of the National Institutes of Health (1R15GM140392-01). J. J. F. and L. T. acknowledge the NSF CAREER Award CHE-2043215.References
- J. M. Ha, S. H. Hur, A. Pathak, J.-E. Jeong and H. Y. Woo, NPG Asia Mater., 2021, 13, 53 CrossRef CAS.
- V. F. Traven, D. A. Cheptsov and C. Lodeiro, J. Fluoresc., 2023, 33, 799–847 CrossRef CAS PubMed.
- G. Hong, X. Gan, C. Leonhardt, Z. Zhang, J. Seibert, J. M. Busch and S. Brase, Adv. Mater., 2021, 33, e2005630 CrossRef PubMed.
- C. Xu, Z. Zhao, K. Yang, L. Niu, X. Ma, Z. Zhou, X. L. Zhang and F. Zhang, J. Mater. Chem. A, 2022, 10, 6291–6329 RSC.
- L. Wang, S. Guo, K. Zhou and W. Ma, Sustainable Energy Fuels, 2020, 4, 4934–4955 RSC.
- C. Gu, X. Wang, H. Wang, Y. Tian, J. Ma and R. Yang, Mol. Syst. Des. Eng., 2022, 7, 832–855 RSC.
- L. Wu, C. Huang, B. P. Emery, A. C. Sedgwick, S. D. Bull, X. P. He, H. Tian, J. Yoon, J. L. Sessler and T. D. James, Chem. Soc. Rev., 2020, 49, 5110–5139 RSC.
- H. Shuai, C. Xiang, L. Qian, F. Bin, L. Xiaohui, D. Jipeng, Z. Chang, L. Jiahui and Z. Wenbin, Dyes Pigm., 2021, 187, 109125 CrossRef CAS.
- J. Li and K. Pu, Chem. Soc. Rev., 2019, 48, 38–71 RSC.
- B. Lu, H. Yuying, H. Quan, Z. Zhang and Y. Yao, Mater. Chem. Front., 2022, 6, 2968–2993 RSC.
- J. Zhang, X. Zhao, H. Shen, J. W. Lam, H. Zhang and B. Z. Tang, Adv. Photonics, 2021, 4, 014001 Search PubMed.
- N. Muhamad Sarih, P. Myers, A. Slater, B. Slater, Z. Abdullah, H. A. Tajuddin and S. Maher, Sci. Rep., 2019, 9, 11834 CrossRef PubMed.
- K. Panigrahi and A. Nag, J. Phys. Chem. C, 2022, 126, 8553–8564 CrossRef CAS.
- S. Kundu, B. Sk, P. Pallavi, A. Giri and A. Patra, Chemistry, 2020, 26, 5557–5582 CrossRef CAS PubMed.
- D. Bevk, L. Marin, L. Lutsen, D. Vanderzande and W. Maes, RSC Adv., 2013, 3, 11418–11431 RSC.
- G. Reginato, A. Mordini, L. Zani, M. Calamante and A. Dessì, Eur. J. Org. Chem., 2016, 233–251 CrossRef CAS.
- Y. Z. Yousif and A. J. Al-hamdani, Liq. Cryst., 1993, 15, 451–460 CrossRef CAS.
- J. Bartulin, C. Zuñiga, H. Muller and T. R. Taylor, Mol. Cryst. Liq. Cryst. Incorporating Nonlinear Opt., 1990, 180, 297–304 CrossRef.
- I. Roy, S. Goswami, R. M. Young, I. Schlesinger, M. R. Mian, A. E. Enciso, X. Zhang, J. E. Hornick, O. K. Farha, M. R. Wasielewski, J. T. Hupp and J. F. Stoddart, J. Am. Chem. Soc., 2021, 143, 5053–5059 CrossRef CAS PubMed.
- I. Osaka, M. Saito and K. Takimiya, J. Imaging Soc. Jpn, 2014, 53, 523–528 CAS.
- N. A. Sayresmith, A. Saminathan, J. K. Sailer, S. M. Patberg, K. Sandor, Y. Krishnan and M. G. Walter, J. Am. Chem. Soc., 2019, 141, 18780–18790 CrossRef CAS PubMed.
- A. R. Brotherton, A. Shibu, J. C. Meadows, N. A. Sayresmith, C. E. Brown, A. M. Ledezma, T. A. Schmedake and M. G. Walter, Adv. Sci., 2023, 10, e2205729 CrossRef PubMed.
- H. Z. Akpinar, Y. A. Udum and L. Toppare, J. Polym. Sci., Part A: Polym. Chem., 2013, 51, 3901–3906 CrossRef CAS.
- U. Olgun and M. Gülfen, React. Funct. Polym., 2014, 77, 23–29 CrossRef CAS.
- U. Olgun and M. Gülfen, RSC Adv., 2014, 4, 25165–25171 RSC.
- T.-X. Wang, H.-P. Liang, D. A. Anito, X. Ding and B.-H. Han, J. Mater. Chem. A, 2020, 8, 7003–7034 RSC.
- Q. Huang, L. Guo, N. Wang, X. Zhu, S. Jin and B. Tan, ACS Appl. Mater. Interfaces, 2019, 11, 15861–15868 CrossRef CAS PubMed.
- Q. Shi, H. Fan, Y. Liu, J. Chen, Z. Shuai, W. Hu, Y. Li and X. Zhan, J. Polym. Sci., Part A: Polym. Chem., 2011, 49, 4875–4885 CrossRef CAS.
- O. P. Dimitriev, Chem. Rev., 2022, 122, 8487–8593 CrossRef CAS PubMed.
- K. Wang, H. Zhang, S. Chen, G. Yang, J. Zhang, W. Tian, Z. Su and Y. Wang, Adv. Mater., 2014, 26, 6168–6173 CrossRef CAS PubMed.
- M. Ghora, P. Majumdar, M. Anas and S. Varghese, Chemistry, 2020, 26, 14488–14495 CrossRef CAS PubMed.
- J. Gierschner, J. Shi, B. Milián-Medina, D. Roca-Sanjuán, S. Varghese and S. Park, Adv. Opt. Mater., 2021, 9, 2002251 CrossRef CAS.
- A. Huang, Q. Li and Z. Li, Chin. J. Chem., 2022, 40, 2356–2370 CrossRef CAS.
- T. Iwasaki, S. Murakami, Y. Takeda, G. Fukuhara, N. Tohnai, Y. Yakiyama, H. Sakurai and N. Kambe, Chemistry, 2019, 25, 14817–14825 CrossRef CAS PubMed.
- Q. Li and Z. Li, Acc. Chem. Res., 2020, 53, 962–973 CrossRef CAS PubMed.
- Y. Fan, Q. Li and Z. Li, Mater. Chem. Front., 2021, 5, 1525–1540 RSC.
- M. Kaushal, A. L. Ortiz, J. A. Kassel, N. Hall, T. D. Lee, G. Singh and M. G. Walter, J. Mater. Chem. C, 2016, 4, 5602–5609 RSC.
- A. Shibu, C. Middleton, C. O. Kwiatkowski, M. Kaushal, J. H. Gillen and M. G. Walter, Molecules, 2022, 27, 35 CrossRef CAS PubMed.
- S. Varghese and S. Das, J. Phys. Chem. Lett., 2011, 2, 863–873 CrossRef CAS PubMed.
- N. S. S. Kumar, S. Varghese, C. H. Suresh, N. P. Rath and S. Das, J. Phys. Chem. C, 2009, 113, 11927–11935 CrossRef CAS.
- R. Thomas, S. Varghese and G. U. Kulkarni, J. Mater. Chem., 2009, 19, 4401–4406 RSC.
- S. Ando, D. Kumaki, J.-I. Nishida, H. Tada, Y. Inoue, S. Tokito and Y. Yamashita, J. Mater. Chem., 2007, 17, 553–558 RSC.
- J. Yang, X. Zhen, B. Wang, X. Gao, Z. Ren, J. Wang, Y. Xie, J. Li, Q. Peng, K. Pu and Z. Li, Nat. Commun., 2018, 9, 840 CrossRef PubMed.
- Z. Liu, Y. Tian, J. Yang, A. Li, Y. Wang, J. Ren, M. Fang, B. Z. Tang and Z. Li, Light: Sci. Appl., 2022, 11, 142 CrossRef CAS PubMed.
- P. R. Spackman, M. J. Turner, J. J. McKinnon, S. K. Wolff, D. J. Grimwood, D. Jayatilaka and M. A. Spackman, J. Appl. Crystallogr., 2021, 54, 1006–1011 CrossRef CAS PubMed.
- Y. C. Wei, S. W. Shen, C. H. Wu, S. Y. Ho, Z. Zhang, C. I. Wu and P. T. Chou, J. Phys. Chem. A, 2021, 125, 943–953 CrossRef CAS PubMed.
- P. Irkhin, A. Ryasnyanskiy, M. Koehler and I. Biaggio, Phys. Rev. B: Condens. Matter Mater. Phys., 2012, 86, 085143 CrossRef.
- Y.-C. Wei, Z. Zhang, Y.-A. Chen, C.-H. Wu, Z.-Y. Liu, S.-Y. Ho, J.-C. Liu, J.-A. Lin and P.-T. Chou, Commun. Chem., 2019, 2, 10 CrossRef.
- M. Brinkmann, G. Gadret, M. Muccini, C. Taliani, N. Masciocchi and A. Sironi, J. Am. Chem. Soc., 2000, 122, 5147–5157 CrossRef CAS.
- M. L. Clapham, R. R. Frontiera and C. J. Douglas, Cryst. Growth Des., 2023, 23, 3942–3946 CrossRef CAS.
- E. Venuti, I. Bilotti, R. G. Della Valle, A. Brillante, P. Ranzieri, M. Masino and A. Girlando, J. Phys. Chem. C, 2008, 112, 17416–17422 CrossRef CAS.
- B. Subramanian, N. Tchoukanova, Y. Djaoued, C. Pelletier and M. Ferron, J. Raman Spectrosc., 2013, 44, 219–226 CrossRef CAS.
- S. Hamai and F. Hirayama, J. Phys. Chem., 2002, 87, 83–89 CrossRef.
- G. M. Sheldrick, Acta Crystallogr. A, 2008, 64, 112–122 CrossRef CAS PubMed.
- O. V. Dolomanov, L. J. Bourhis, R. J. Gildea, J. A. Howard and H. Puschmann, J. Appl. Crystallogr., 2009, 42, 339–341 CrossRef CAS.
- A. S. Glassner, Principles of digital image synthesis, Elsevier, 2014 Search PubMed.
- J. F. Varner, N. Eldabagh, D. Volta, R. Eldabagh and J. J. Foley, J. Open Res. Software, 2019, 7, 28 CrossRef.
- T. Mansencal, M. Mauderer, M. Parsons, N. Shaw, K. Wheatley, S. Cooper, J. D. Vandenberg, L. Canavan, K. Crowson, O. Lev, K. Leinweber, S. Sharma, T. J. Sobotka, D. Moritz, M. Pppp, C. Rane, P. Eswaramoorthy, J. Mertic, B. Pearlstine, M. Leonhardt, O. Niemitalo, M. Szymanski, M. Schambach, S. Huang, M. Wei, N. Joywardhan, O. Wagih, P. Redman, J. Goldstone, S. Hill, J. Smith; F. Savoir, G. Saxena, S. Chopra, I. Sibiryakov, T. Gates, G. Pal, N. Tessore, A. Pierre, F.-X. Thomas, S. Srinivasan and T. Downs, Colour 0.4.2 (0.4.2), Zenodo, 2022 DOI:10.5281/zenodo.7367239.
Footnote |
| † Electronic supplementary information (ESI) available: NMR and MALDI-TOF-MS spectra, single crystal structure data and refinement, correlation between volume of unit cell and alkyl chain length, pictorial representation of interaction energies in TTz crystals, list of contacts from crystal packing data of (CnOPh)2TTz crystals, atom labelling sequence, distribution of intermolecular contacts to Hirshfeld surface area, shape index of the Hirshfeld surfaces, powder X-ray diffractograms of TTz crystals, DFT simulated Raman spectra, lattice-phonon Raman spectra of TTz crystals, photostability of TTz crystals. CCDC 2257067–2257069. For ESI and crystallographic data in CIF or other electronic format see DOI: https://doi.org/10.1039/d3ma00686g |
| This journal is © The Royal Society of Chemistry 2023 |

