 Open Access Article
Disclosing the leaching behaviour of Pd@CMK3 catalysts in formic acid decomposition by electron tomography†
Xiaohui
Huang
ab,
Ilaria
Barlocco
c,
Alberto
Villa
 *c,
Christian
Kübel
 *abd and
Di
Wang
*ad
aInstitute of Nanotechnology, Karlsruhe Institute of Technology, Eggenstein-Leopoldshafen, Germany. E-mail: christian.kuebel@kit.edu; di.wang@kit.edu
bDepartment of Materials and Earth Sciences, Technical University Darmstadt, Darmstadt, Germany
cDipartimento di Chimica, Università degli Studi di Milano, Via Golgi 19, 20133 Milano, Italy
dKarlsruhe Nano Micro Facility, Karlsruhe Institute of Technology, Eggenstein-Leopoldshafen, Germany
First published on 3rd January 2023
Abstract
Supported nanocatalysts exhibit different performances in batch and fixed bed reactors for a wide range of liquid phase catalytic reactions due to differences in metal leaching. To investigate this leaching process and its influence on the catalytic performance, a quantitative 3D characterization of the particle size and the particle distribution is important to follow the structural evolution of the active metal catalysts supported on porous materials during the reaction. In this work, electron tomography has been applied to uncover leaching and redeposition of a Pd@CMK3 catalyst during formic acid decomposition in batch and fixed bed reactors. The 3D distribution of Pd NPs on the mesoporous carbon CMK3 has been determined by a quantitative tomographic analysis and the determined structural changes are correlated with the observed differences in activity and stability of formic acid decomposition using batch and fixed bed reactors.
1. Introduction
Hydrogen, as a clean and renewable energy carrier with high specific energy density, has been regarded as one of the most promising energy sources for the future due to the depletion of fossil fuels and increasing critical environmental issues such as climate change and acid rain.1,2 One challenge for the application of hydrogen is its storage due to the nature of hydrogen. Typically, hydrogen is stored physically as high pressured hydrogen gas,3 liquid hydrogen4 or constrained within porous networks, e.g., zeolites,5 porous carbon6 and metal–organic frameworks.7 It can also be chemically stored and released via decomposition from compounds such as water,8 ammonia borane9 or formic acid.10 The decomposition of FA has attracted increasing interest in the field of hydrogen storage due to various advantages, e.g., it is environmentally benign, has a high volumetric hydrogen content (4.4 wt%), and the ability to release hydrogen under mild conditions.11Eqn (1) and (2) show the thermodynamic properties for the decomposition of FA, where FA decomposition can proceed either via dehydrogenation to release hydrogen and carbon dioxide or dehydration producing carbon monoxide and water:11| HCOOH → H2 + CO2, ΔG0 = −32.9 kJ mol−1 | (1) |
| HCOOH → H2O + CO, ΔG0 = −12.4 kJ mol−1 | (2) |
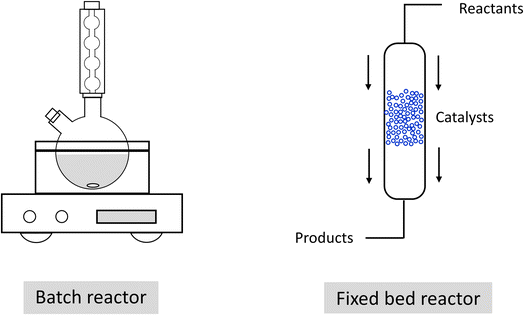
Pd is the most active monometallic transition metal for the decomposition of FA.12 However, one major challenge for monometallic Pd catalysts for this catalytic system is deactivation, which is mainly due to the active sites being blocked by poisoning species (such as CO),13 metal particle sintering and leaching.14 In addition to the weak interaction between active sites and the support, the leaching behavior depends on the experimental setup. For example, it has been demonstrated that heterogeneous catalysts exhibit different catalytic performance in batch and continuous flow reactors for a wide range of catalytic processes such as hydrogenation, cross-coupling, etc., due to differences in metal leaching.15–17 In a typical batch reaction, reactants including the catalyst are stirred under optimized conditions to accomplish the desired transformation, after which the catalyst can be retrieved for further utilization from the reaction mixture by a filtration step, as shown in Fig. 1(a). For a catalytic process accompanied by leaching, the concentration of the metal species in solution increases during the reaction, leading to the possibility of redeposition of the metal species on the solid support as all reactants, catalyst and products are constrained in a reactor with limited physical size, leading to a limited decrease of the metal concentration.18 In a continuous flow process, the catalyst is commonly placed in a packed-bed reactor (with typical packing materials such as silicon, glass, stainless steel, ceramics or polymers) and appropriate pumping systems are used to control the flow of the reaction mixture through the reactor.19 As the reaction and separation of the catalyst from the reactants and products take place simultaneously (Fig. 1(b)), further separation or filtration steps are not necessary in a fixed bed reactor to recycle the catalyst. However, the continuous reaction stream might transport the active metal species away from the support, leading to significant metal leaching from the packed-bed reactor.17
TEM has been extensively used to investigate the leaching/redeposition phenomena of supported catalysts in batch20–22 as well as continuous flow23,24 mode comparing the particle size and shape of fresh and used catalysts. However, the typically obtained 2D information is not sufficient to reveal the details of the leaching process, especially for those catalysts supported on porous materials. For example, how does the leaching behavior of particles in interior pores and on the external surface of the support differ and how to evaluate the redeposition of nanoparticles (NPs) and their preferred redeposition site? A significant number of reports have shown that the actual location and distribution of the NPs in a 3D volume can be precisely determined using electron tomography.25–29 In this work, structural changes for a Pd@CMK3 catalyst during FA decomposition in batch and fixed bed reactors are studied and correlated with the leaching behavior. CMK3 is a commercially available ordered mesoporous carbon with a pore size of a few nanometers. Using Pd nanoparticles mainly constrained inside the pores, we were able to track the overall evolution of their distribution, their particle size, and the loading after the catalytic reaction by electron tomography. In this way, we build a structure–performance relationship for the further design of more advanced catalysts.
2. Materials and experimental methods
2.1. Synthesis of the Pd@CMK3 catalyst
Pd@CMK3 was synthesized by incipient wetness impregnation. Solid K2PdCl4·2H2O (Aldrich, purity 99.99%) (0.094 mmol of Pd) was dissolved in water. The correct amount of solution to completely fill the pores (based on the total pore volume calculated from N2 adsorption analysis) was added to 1 g of mesoporous carbon. The quantity of metal in the precursor solution was set to obtain a final metal loading of 1 wt%. The produced material was filtered, redispersed in water and reduced with NaBH4 (Pd/NaBH4 molar ratio of 1/8). Afterwards, the catalyst was filtered and washed with 1 L of distilled H2O and dried at 80 °C for 4 h in air.2.2. Catalytic testing – batch reactor
Liquid-phase FA decomposition was carried out in a 100 mL two-neck round-bottom flask placed in a water/ethylene glycol bath with a magnetic stirrer and a reflux condenser. Typically, 10 mL of an aqueous solution of 0.5 M HCOOH was placed in the reactor and heated to a constant reaction temperature of 30 °C. Once the solution reached the desired temperature, the required amount of Pd@CMK3 catalyst (formic acid/catalyst molar ratio of 2000/1) was added and the solution was stirred using a magnetic stirrer. Recycling tests were performed after 30 minutes of reaction, filtering the catalyst present in the solution without further treatment. Reproducibility tests were performed by repeating each test three times.2.3. Catalytic testing – fixed bed reactor
Liquid-phase FA decomposition in a fixed bed reactor was tested with a bed length of 7 cm (50 mg Pd@CMK3 and 50 mg silica carbide). The bed was heated to a constant reaction temperature of 30 °C. 0.5 M FA was inserted into the reactor with a flow of 0.1, 0.3 and 0.5 mL min−1. Reproducibility tests were performed for every reaction repeating the test three times.2.4. Catalyst characterization
The Pd loading of Pd@CMK3 before and after the reaction was determined using an inductively coupled plasma atomic emission spectrometer (ICP-AES) and energy dispersive X-ray spectroscopy (EDX) analysis. The ICP-AES analysis for the used catalyst was based on the Pd content in the solution after the reaction. High angle annular dark-field (HAADF) scanning transmission electron microscopy (STEM) imaging and EDX analysis were performed on a Themis 300 TEM (ThermoFisher Scientific) operated at 300 kV, equipped with a probe corrector and Super-X EDX detector. TEM samples were prepared by dispersing powder samples of the Pd@CMK3 catalyst on 100 × 400 mesh carbon coated copper grids (Quantifoil). Around 30 regions of interest of the same size were selected randomly and measured by EDX to evaluate the homogeneity of the Pd loading under identical conditions for each catalyst. The mass fraction of Pd loading was calculated by fitting the L peak for Pd and K peak for carbon after subtracting the background. During this process, absorption corrections for sample thickness of 400 nm and density of 2.1 g cm−3 were also used. The Pd particle size distribution (PSD) was estimated from HAADF STEM images using the software tool ImageJ (National Institutes of Health) approximating the particles with an elliptical shape. The reported diameter of each particle is calculated as the average of the long and short axis. For each catalyst 500–700 Pd particles from 3–4 support particles were measured to obtain a good statistical representation. Electron tomography was performed using a Fischione 2020 tomography holder. HAADF-STEM tilt series with image dimensions of 2048 × 2048 pixels and a pixel size smaller than 0.5 nm were collected using the Xplore3D software (ThermoFisher Scientific) with auto focus and tracking before acquisition. All tilt-series were collected over a tilt range of at least ±70° with a tilt step of 2°. During tilt-series image acquisition no detectable morphological changes caused by electron beam damage were observed. Alignment of the tilt series was performed in IMOD version 4.7 (University of Colorado) using supported Pd nanoparticles as fiducial markers with a mean residual alignment error smaller than 0.5 pixels. The aligned tilt-series were reconstructed using the discrete algebraic reconstruction technique (DART)30 implemented in the ASTRA toolbox.31 After an initial reconstruction with 150 iterations of the simultaneous iterative reconstruction technique (SIRT),32 the main loop for DART was repeated 10 times and then SIRT with another 150 iterations was included for each iteration to ensure convergence. The grey levels used for segmentation were estimated from the average intensity of each component based on the initial SIRT reconstruction. During the DART reconstruction, the random probability was fixed to 0.3 and a 3 × 3 Gaussian filter was used to smooth the re-projected sinogram in each loop. The Pd loading (in wt%) of each catalyst was also calculated based on the segmented volumes using the bulk density of metallic Pd (12.02 g cm−3) and CMK3 carbon (2.1 g cm−3). 3D visualization was performed in Avizo 2020.2 (Thermo Fisher Scientific).3. Results and discussion
3.1. Catalytic performance during FA decomposition
The Pd@CMK3 catalyst was tested for FA decomposition in a batch reactor, as a model system for hydrogen production using liquid organic hydrogen carriers (LOHCs), and compared to one of the promising Pd-based monometallic catalysts presented in the literature (1 wt% Pd@HHT, where the Pd NPs are supported on the surface of high-heat treated carbon nanofibers exhibiting a highly graphitized surface).33 In contrast to other highly efficient Pd catalysts supported on porous carbons,34,35 where the Pd particles are distributed both on internal and external surfaces, Pd@HHT is a morphologically simple reference system with all Pd particles located on the external surface of the support. As shown in Fig. 2(a), Pd@CMK3 shows an initial activity of 3261 h−1 (calculated at 5 minutes of reaction as mol of reacted FA to total mol of metal per hour), which is more than 3 times higher compared to Pd@HHT (979 h−1). Moreover, Pd@CMK3 exhibited a conversion of 67% after two hours of reaction time, around two times higher compared to Pd@HHT. The Pd@CMK3 catalyst was also tested over 5 h of reaction in the fixed bed reactor using three different flow rates, i.e., 0.1, 0.3 and 0.5 mL min−1. Silica carbide was mixed to the catalyst (ratio of 1![[thin space (1/6-em)]](https://www.rsc.org/images/entities/char_2009.gif) :
:![[thin space (1/6-em)]](https://www.rsc.org/images/entities/char_2009.gif) 1 by weight) in order to increase the length of the catalytic bed. From Fig. 2(b), it is clear that the catalyst reached a high conversion after 30 min of reaction time (61%) at the flow of 0.1 mL min−1, around 1.5 times that of the batch reactor at the same reaction time. However, the catalyst deactivated rapidly and the conversion decreased to only 21% after 2 h of reaction time, around 3 times lower compared to the batch reactor (67%). A similar fast deactivation can also be seen for the higher flow rate of 0.3 mL min−1 (Fig. 2(b)). The conversion reached only 8% after 30 min reaction time for the flow rate of 0.5 mL min−1 and is deactivated further with increasing reaction time.
1 by weight) in order to increase the length of the catalytic bed. From Fig. 2(b), it is clear that the catalyst reached a high conversion after 30 min of reaction time (61%) at the flow of 0.1 mL min−1, around 1.5 times that of the batch reactor at the same reaction time. However, the catalyst deactivated rapidly and the conversion decreased to only 21% after 2 h of reaction time, around 3 times lower compared to the batch reactor (67%). A similar fast deactivation can also be seen for the higher flow rate of 0.3 mL min−1 (Fig. 2(b)). The conversion reached only 8% after 30 min reaction time for the flow rate of 0.5 mL min−1 and is deactivated further with increasing reaction time.
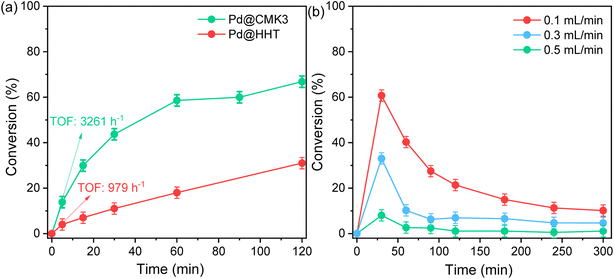 | ||
| Fig. 2 Catalytic performance of Pd@CMK3 and Pd@HHT (from ref. 33) during FA decomposition. (a) FA conversion as a function of reaction time on Pd@CMK3 and Pd@HHT catalysts in the batch reactor. (b) FA conversion as a function of reaction time on Pd@CMK3 in the fixed bed reactor using flow rates of 0.1, 0.3 and 0.5 mL min−1. | ||
The catalyst stability was evaluated for the batch reactor using repeated catalytic testing. Both Pd@CMK3 and Pd@HHT catalysts were tested by filtering and reusing the catalyst without further treatment over 6 reaction runs. As a compromise to balance achieved conversion and total reaction time after six reaction runs, the stability test was performed on Pd@CMK3 after 30 minutes and on Pd@HHT after 2 hours of reaction time for the FA decomposition. While Pd@HHT is rapidly deactivated (Fig. 3(b)), Pd@CMK3 shows a more stable behavior over 6 reaction cycles (Fig. 3(a)). The stability difference can be attributed to the different support structures for these two catalysts. Compared to the Pd@HHT catalyst, where the Pd NPs are supported on the surface of high-heat treated carbon nanofibers having a highly graphitized surface, the Pd NPs immobilized in the porous carbon support for Pd@CMK3 are expected to show higher stability due to confinement effects. Such enhanced stability caused by confinement effects has been reported by various groups.36,37
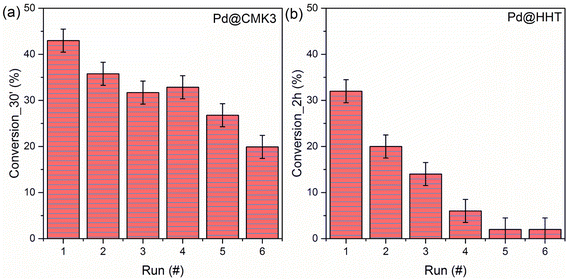 | ||
| Fig. 3 Stability test during FA decomposition with a similar initial conversion: (a) Pd@CMK3 after 30 minutes of reaction time and (b) Pd@HHT after 2 hours of reaction time. | ||
3.2. 2D morphology and Pd loading of Pd@CMK3
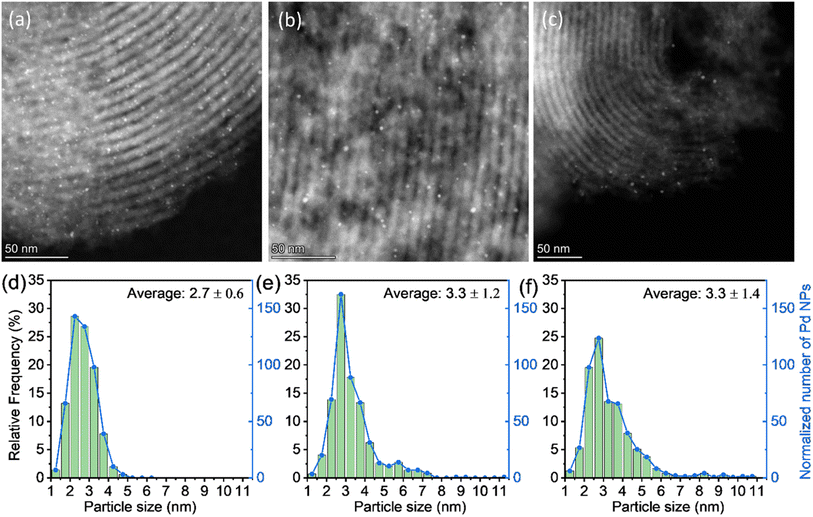
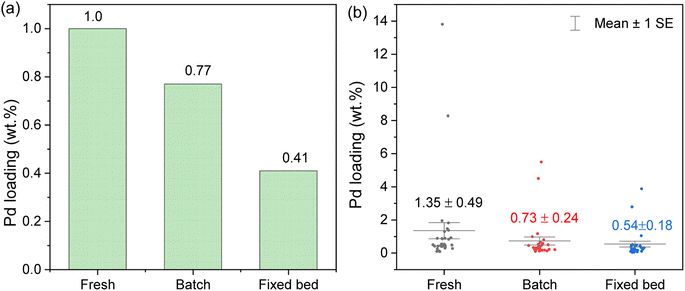
To understand the different catalytic performances of Pd@CMK3 in the batch and the fixed bed reactors, the fresh and used catalysts were characterized using STEM to assess the PSD. Fig. 4 shows STEM images of these three catalysts and histograms of their PSDs. It is clear that the Pd NPs for the fresh catalyst are fairly homogeneously dispersed on the support with an average particle size of 2.7 nm. However, the average particle size grows to 3.3 nm for both used catalysts after the reactions, indicating particle sintering or aggregation during the FA decomposition. A small number of Pd NPs with a diameter larger than 5 nm can be found in both used samples, which are not present in the fresh sample (Fig. 4(d)–(f)). This aggregation of active particles might be one reason for the catalyst deactivation. To unravel the dependence of the catalytic performance on the structural evolution, a more accurate analysis of the particle size by alternative techniques will be discussed later.The Pd loading was measured by EDX and ICP-AES, as shown in Fig. 5. Pd loading for the catalysts was measured after the end of the stability test: after the 6th cycle for the batch reactor and after 300 min on the fixed bed reactor. According to the ICP-AES results, the Pd loading of the as-prepared sample was 1 wt%, as expected from the synthesis process. However, after FA decomposition, the Pd loading decreased by 59 wt% in the fixed bed reactor, showing severe leaching of Pd during the catalytic reaction. This fits roughly to the observed deactivation in Fig. 2(b), suggesting a loss of active metal content as the dominant deactivation mechanism. For the catalyst used in the batch reactor during the stability test (Fig. 3(a)), the activity was reduced by 50% after six cycles while only 23 wt% of Pd was lost. This difference may be attributed to the adsorption of poison species such as CO on the catalyst surface, as the activity of the catalyst could be partially recovered by washing with water (Fig. S1†). Similar recovery of activity for Pd catalysts in FA decomposition by washing can also be seen in other studies.38,39 The quantitative EDX analysis from around 30 randomly selected regions of interest for each of the three catalysts deviates slightly from the ICP measurements. However, considering systematic errors in EDX quantification using on different transition lines and the limited volume analyzed, the overall agreement between ICP-AES and EDX measurements is reasonable with the absolute quantification from ICP-AES being more accurate. However, the EDX measurements provide statistical information on the homogeneity of the three samples. A few measured areas exhibit significantly higher Pd loading in each of the samples indicating some inhomogeneity of the catalyst with 5–10% of the particles exhibiting significant loading differences. Nevertheless, the overall trend of decreasing Pd content is observed by EDX for the batch and the fixed bed reactors. However, for the fixed bed reactor care has to be taken with the interpretation, as a loading gradient from the inlet to the outlet is expected, which would affect the local EDX analysis.
3.3. 3D characterization by electron tomography
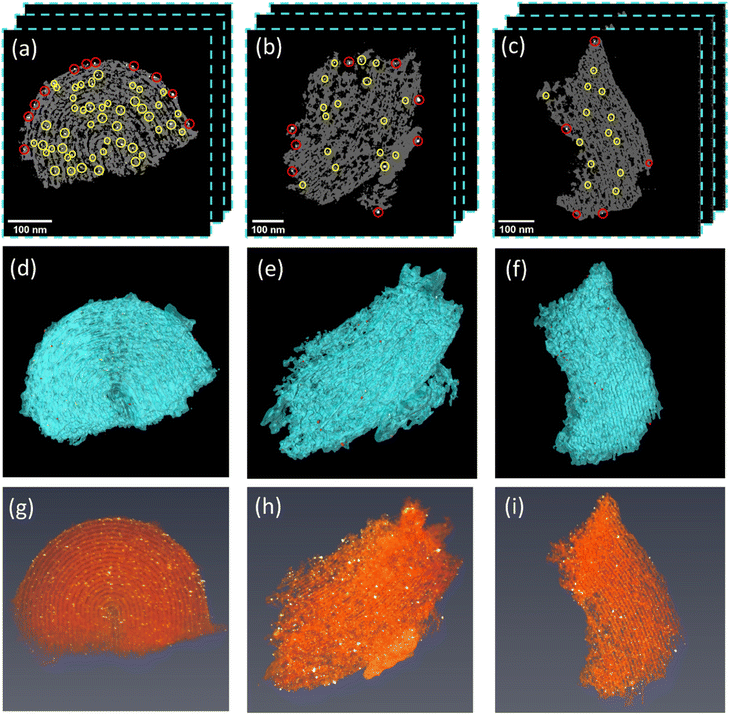
Electron tomography was used to further analyze the leaching behavior of Pd NPs of the Pd@CMK3 catalyst in both reactors based on three-dimensional nanoscale reconstructions. For each sample, three tilt-series were acquired from different CMK3 pieces as shown in Fig. S2† and the corresponding 2D slices from the initial SIRT reconstructions are shown in Fig. S3.† After the reconstruction, the 3D locations of all Pd NPs on the external/internal surface of CMK3 were extracted. The detailed procedure for the extraction can be found in Fig. S4.†Fig. 6(a)–(c) show representative 2D slices from the reconstructed volume of the three Pd@CMK3 catalysts and the corresponding rendered volumes, where Pd NPs located on the external surface are marked by red and those on the internal surface are marked by yellow circles (due to the large number of the Pd NPs inside the pores, only part of them are marked in Fig. 6(a)). From the reconstructed slices, it is clear that the number of Pd particles is reduced after reaction in the batch reactor (Fig. 6(b)) compared to the as-prepared sample (Fig. 6(a)), while a more severe loss of Pd NPs is observed after reaction in the fixed bed reactor (Fig. 6(c)), in agreement with the EDX and ICP results in Section 3.2. Such a leaching phenomenon can also be seen in the other reconstructed tomograms in Fig. S5 and S6.† The Pd loading calculated from the segmented volume is shown in Fig. S7,† which shows the same decreasing trend. These results show again a more significant leaching of Pd NPs in the fixed bed reactor compared to the batch reactor for FA decomposition.At a first glance, the results seem to indicate that Pd NPs inside the pores seem to be easier leached than those on the external surface, which is most obvious in the case of the fixed bed reactor where most NPs inside the pores disappeared after the reaction. This is against the expectation when considering confinement effects in heterogeneous catalysis where metal particles immobilized inside the porous channels often show higher stability than those on external surfaces.22 A possible reason might be that leached Pd NPs are redeposited on the support during the reaction as evident in Fig. 6(g)–(i), where larger particles are observed on the external surface after the reactions in both reactor modes compared to the fresh sample. To get a deeper understanding of the leaching and redeposition, a quantitative analysis of the Pd NPs on the internal/external surface of the support has been performed based on the 3D reconstructions.
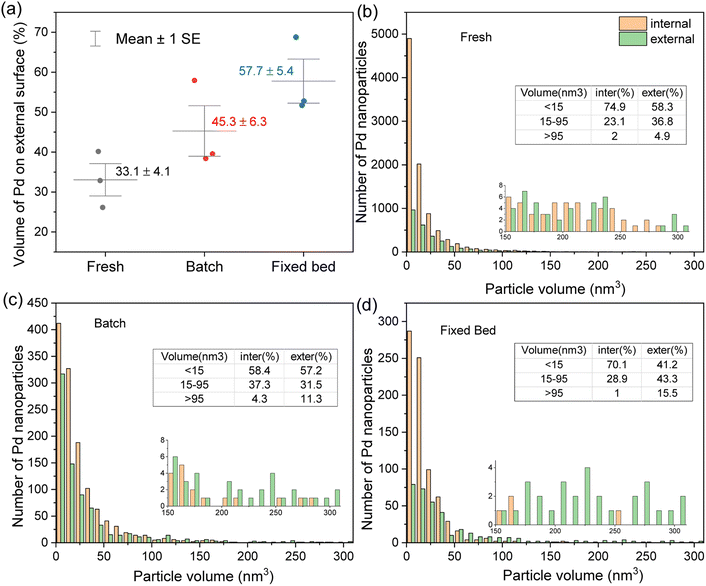
The particle diameters were also calculated from the segmented tomographic volumes using the equivalent diameter of spherical Pd particles with the same volume (Fig. S8†). The resulting average sizes match well with those measured from the 2D STEM images in Fig. 4. Fig. 7(a) shows the volume fraction of Pd NPs on the external surface in the fresh and used Pd@CMK3 catalysts. The volume of Pd NPs was measured by calculating the number of voxels contained in each particle after segmentation and determination of the particle location. To provide some statistical sampling, the Pd NPs of three tomograms for each catalyst were analyzed. It is obvious that the volume of Pd particles on the external surface of the support increased in both used catalysts compared to the fresh one. For the fresh sample, only 33.1% of Pd NPs were detected on the external surface of the CMK3 support, while most of the particles are located inside the pores due to the higher area of the inner surface. However, after FA decomposition in the batch reactor, the fraction of Pd NPs on the external surface increased to 45.3%, around 1.4 times as much as in the fresh sample, indicating that leached Pd species preferably redeposited on the external surface, probably due to the slower diffusion rate inside the pores. After FA decomposition in the fixed bed reactor, the fraction of Pd NPs on the external surface increased to 57.7%. Considering the overall severe Pd loss for this catalyst due to the constant flow of reactants and solvent through the porous support, the enrichment at the surface is surprising. A possible explanation for the high fraction of Pd on the external surface is notable redeposition taking place on the external surfaces even in the flow reactor, presumably due to a gradient of Pd species over the catalyst column. Pd NPs leach fast at the top of the column, while leached Pd species redeposit on the support surface of the catalyst located on the bottom of the column.
Further comparison of the Pd NPs located on the internal and external support surfaces can be found in Fig. 7(b)–(d), which show the histograms of Pd NPs for various ranges of particle volume. Based on a compromise between visibility in the tomographic images, original particle size and the purpose of seeing significant particle growth, particles in the volume range of <15 nm3 (corresponding to a diameter of smaller than ∼3 nm dominant in the as-prepared sample), 15–95 nm3 (corresponding to a diameter of ∼3–5.7 nm indicating some growth), and >95 nm3 (corresponding to a diameter of larger than ∼5.7 nm indicating significant growth/sintering) are classified as small, medium and large particles. It is clear that all catalysts show quite homogeneous particle sizes with a high fraction of small Pd NPs and a small fraction of large particles. While the size distribution of particles located on the internal and external support surfaces is not too different for the fresh catalyst, the table in Fig. 7(b) shows that the particles located on the internal surface exhibit a higher fraction of small particles compared to the externally located particles, whereas larger particles are preferentially observed on the external surface. This confirms that pores can reduce the formation of big particles by ripening or agglomeration.
Looking in more detail at the catalyst used in the batch reactor, the amounts of small Pd NPs on the internal and external support surfaces are both severely decreased. The fractions of small Pd NPs on the internal and external support surfaces are comparable, while an increased fraction of large particles can be found on the external surface. Considering the strong reduction of the number of particles and only slight reduction of Pd loading (∼23%) according to the ICP-AES and EDX results (Fig. 5), the redeposition and aggregation of Pd particles plays an important role in the change of the particle size evolution. According to the diffusion simulation results from Tallarek et al., where the effective diffusion coefficient decreased rapidly with the increased size of tracer particles,40,41 the detachment of whole Pd particles from the CMK3 support is unlikely. Therefore, the evolution of particle size could be attributed to the dissolution of Pd particles, leading to a high Pd concentration in solution and then redeposition/ripening leads to growth of the particles. As the diffusion rate of dissolved Pd species on the external surface is faster than that on the internal surface, the Pd species is preferentially redeposited on the external surface. In addition, the increase of Pd NPs on the external surface provides more nuclear sites for the growth/ripening of the particles, resulting in a higher fraction of Pd volume (Fig. 7(a)) and larger particle size (inserted table in Fig. 7(c)) on the external surface. However, the competition of dissolution and redeposition of Pd species leads to similar PSD shapes for particles on both external and internal surfaces when compared to the fresh sample. This is expected as the reaction mixtures are constrained in the batch reactor, so there is sufficient time for Pd dissolution and reposition during the reaction. Overall, our observations suggest a highly dynamic equilibrium in the batch reactor with a lot of local leaching and redeposition taking place both for particles on the internal and external support surfaces. Here, the limited size of the pores limits the internal particles from growing extremely big. These observations help to explain the stability of the catalyst in the batch reactor. In the case of the fixed bed reactor, even though a significant amount of Pd was lost from the catalyst, the overall PSD is more or less similar to the fresh sample for particles on the internal surface of the support, where the small Pd NPs comprise the highest fraction and a decreasing fraction belongs to particles with increasing size. The higher fraction of small particles compared to the batch reactor might be due to the fact that the particles were eroded continuously by the flow without much redeposition on the internal surfaces. This is not surprising as leached Pd species are easily removed from the solid support by the continuous flows and do not have sufficient time for redeposition due to the short diffusion path in the packed columns. A decreasing fraction of small Pd NPs and an increasing fraction of medium and large Pd NPs was observed on the external surface. This increasing fraction of larger particles on the external surface contributed to the increased average particle diameter observed in Fig. 4(f). One possible explanation for the redeposition of Pd on the external surface in the fixed bed reactor might be the existence of a gradient of Pd species on the catalyst column as discussed above for the increased fraction of particles on the external surface. The overall leaching and reposition behavior in both batch and fixed bed reactors is summarized schematically in Fig. 8.
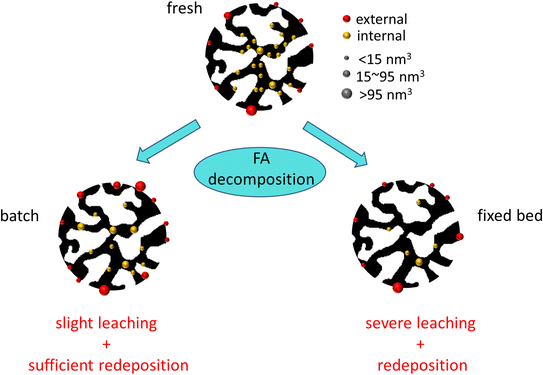 | ||
| Fig. 8 Schematic of the leaching and redeposition behavior of the Pd@CMK3 catalyst during formic acid decomposition in the batch and the fixed bed reactors. | ||
The detailed structural analysis above for Pd@CMK3 before and after FA decomposition provides a clear understanding of the different structure–performance relationships in batch and fixed bed reactors. In the fixed bed reactor, the catalyst reaches a high initial conversion during the first half hour due to the fast diffusion rate of the reactant and products by the flow of reactants. However, as the reaction progresses, Pd nanoparticles are rapidly lost and only partially redeposited on the support surface, resulting in rapid deactivation of the catalyst. In contrast, the leaching of Pd NPs in the batch reactor is much slower and the leached particles are able to redeposit both on the internal and external surfaces of the CMK3 support, thus allowing for a higher activity and better stability.
4. Conclusions
This work helps to unravel the leaching and redeposition behavior of Pd@CMK3 during FA decomposition in batch and fixed bed reactors using a quantitative electron tomography analysis. The Pd NPs immobilized in mesoporous CMK3 show a higher FA conversion rate and stability in batch reactors compared to other catalysts discussed in the literature such as Pd@HHT, probably due to the confinement effects of the mesopores of CMK3. The amount of Pd leaching was measured by ICP-AES and EDX, both showing that Pd leaching from Pd@CMK3 is much more severe in the fixed bed than in the batch reactor. Quantitative analysis of the tomographic data enables a precise tracking of the evolution of number and size distribution for the particles on the internal and external support surfaces. Based on the quantitative tomographic analysis, the 3D distribution of Pd NPs in the fresh and used catalysts was systematically investigated. For fresh Pd@CMK3, the particle size is quite homogeneous everywhere in the support, e.g., on the internal and external support surfaces. After the reaction in the batch reactor, leaching decreased the fraction of small Pd particles (<15 nm3) on the internal surface. Redeposition and ripening result in the formation of particles with intermediate size due to the confinement effect inside the mesoporous space. A notable increase of the fraction of large particles (>95 nm3) on the external surface was observed after the reaction, suggesting the existence of redeposition on the external surface. Sufficient redeposition of leached Pd NPs helps to maintain good stability during the recycling test. In contrast, more than half of the Pd was lost after the reaction in the fixed bed reactor, especially the particles inside the porous support. This causes fast deactivation during FA decomposition. However, redeposition was also observed in this case based on the increased fraction of Pd NPs on the external surface. These results demonstrate that quantitative tomography is essential for an in-depth understanding of the structural differences and how they affect the catalytic properties of catalysts in different reactors. In turn, this information can be used to precisely design catalysts with desired properties to optimize the reaction conditions.Data availability
The raw data and all processed images are available at KITOpen through the DOI: http://10.5445/IR/1000154215.Conflicts of interest
There are no conflicts of interest to declare.Acknowledgements
X. Huang acknowledges the China Scholarship Council (CSC) for supporting her Ph.D. at the Karlsruhe Institute of Technology and Technical University Darmstadt. We acknowledge TrackAct (CRC 1441), a project on tracking the active site in heterogeneous catalysis for emission control from Deutsche Forschungsgemeinschaft (DFG), for the funding of this work. We acknowledge support by the KIT-Publication Fund of the Karlsruhe Institute of Technology.References
- C. Wang, et al., Resolving atomic-scale phase transformation and oxygen loss mechanism in ultrahigh-nickel layered cathodes for cobalt-free lithium-ion batteries, Matter, 2021, 4(6), 2013–2026 CrossRef CAS.
- M. Yue, et al., Hydrogen energy systems: A critical review of technologies, applications, trends and challenges, Renewable Sustainable Energy Rev., 2021, 146, 111180 CrossRef.
- A. Yamashita, et al., Development of High-Pressure Hydrogen Storage System for the Toyota “Mirai”, 2015, SAE Technical Paper Search PubMed.
- W. Xu, Q. Li and M. Huang, Design and analysis of liquid hydrogen storage tank for high-altitude long-endurance remotely-operated aircraft, Int. J. Hydrogen Energy, 2015, 40(46), 16578–16586 CrossRef CAS.
- J. Weitkamp, M. Fritz, and S. Ernst. Zeolites as media for hydrogen storage, in Proceedings from the Ninth International Zeolite Conference, Elsevier, 1993 Search PubMed.
- R. Ströbel, et al., Hydrogen storage by carbon materials, J. Power Sources, 2006, 159(2), 781–801 CrossRef.
- Y. H. Hu and L. Zhang, Hydrogen storage in metal–organic frameworks, Adv. Mater., 2010, 22(20), E117–E130 CrossRef CAS PubMed.
- M. Rashid, et al., Hydrogen production by water electrolysis: a review of alkaline water electrolysis, PEM water electrolysis and high temperature water electrolysis, Int. J. Eng. Adv. Technol., 2015, 4(3), 80–93 Search PubMed.
- A. Karkamkar, C. Aardahl and T. Autrey, Recent developments on hydrogen release from ammonia borane, Mater. Matters, 2007, 2, 6–9 CAS.
- M. Grasemann and G. Laurenczy, Formic acid as a hydrogen source–recent developments and future trends, Energy Environ. Sci., 2012, 5(8), 8171–8181 RSC.
- D. Wang, et al., Three-dimensional hollow-structured binary oxide particles as an advanced anode material for high-rate and long cycle life lithium-ion batteries, Nano Energy, 2016, 20, 212–220 CrossRef CAS.
- K. Tedsree, et al., Hydrogen production from formic acid decomposition at room temperature using a Ag-Pd core-shell nanocatalyst, Nat. Nanotechnol., 2011, 6(5), 302–307 CrossRef CAS PubMed.
- A. Kosider, et al., Enhancing the feasibility of Pd/C-catalyzed formic acid decomposition for hydrogen generation – catalyst pretreatment, deactivation, and regeneration, Catal. Sci. Technol., 2021, 11(12), 4259–4271 RSC.
- D. Zhang, et al., Transfer hydrogenation of phenol on supported Pd catalysts using formic acid as an alternative hydrogen source, Catal. Today, 2014, 234, 133–138 CrossRef CAS.
- N. S. Biradar, et al., Tailoring the Product Distribution with Batch and Continuous Process Options in Catalytic Hydrogenation of Furfural, Org. Process Res. Dev., 2014, 18(11), 1434–1442 CrossRef CAS.
- Y. Wang, et al., Comparative Study of Supported Monometallic Catalysts in the Liquid-Phase Hydrogenation of Furfural: Batch Versus Continuous Flow, ACS Sustainable Chem. Eng., 2018, 6(8), 9831–9844 CrossRef CAS.
- D. Cantillo and C. O. Kappe, Immobilized Transition Metals as Catalysts for Cross-Couplings in Continuous Flow-A Critical Assessment of the Reaction Mechanism and Metal Leaching, ChemCatChem, 2014, 6(12), 3286–3305 CrossRef CAS.
- S. MacQuarrie, et al., Visual observation of redistribution and dissolution of palladium during the Suzuki-Miyaura reaction, Angew. Chem., Int. Ed. Engl., 2008, 47(17), 3279–3282 CrossRef CAS PubMed.
- C. G. Frost and L. Mutton, Heterogeneous catalytic synthesis using microreactor technology, Green Chem., 2010, 12(10), 1687–1703 RSC.
- Y. Yang, et al., Dendrimer-stabilized Pd polymer composites: drastic suppression of Pd leaching and fine catalysis sustainability, Polym. J., 2015, 47(4), 340–347 CrossRef CAS.
- K. Köhler, et al., Highly active palladium/activated carbon catalysts for heck reactions: Correlation of activity, catalyst properties, and Pd leaching, Chem.–Eur. J., 2002, 8(3), 622–631 CrossRef.
- W. Wang, et al., Tailoring the 3D Structure of Pd Nanocatalysts Supported on Mesoporous Carbon for Furfural Hydrogenation, ChemNanoMat, 2018, 4(11), 1125–1132 CrossRef CAS.
- D. Motta, et al., An investigation on AuPt and AuPt-Bi on granular carbon as catalysts for the oxidation of glycerol under continuous flow conditions, Catal. Today, 2018, 308, 50–57 CrossRef CAS.
- M. A. Newton, et al., In situ study of metal leaching from Pd/Al2O3 induced by K2CO3, Catal. Sci. Technol., 2020, 10(2), 466–474 RSC.
- E. Castillejos, et al., An efficient strategy to drive nanoparticles into carbon nanotubes and the remarkable effect of confinement on their catalytic performance, Angew. Chem., Int. Ed. Engl., 2009, 48(14), 2529–2533 CrossRef CAS PubMed.
- H. Friedrich, et al., Measuring Location, Size, Distribution, and Loading of NiO Crystallites in Individual SBA-15 Pores by Electron Tomography, J. Am. Chem. Soc., 2007, 129(33), 10249–10254 CrossRef CAS PubMed.
- A. H. Janssen, et al., Localization of Small Metal (Oxide) Particles in SBA-15 Using Bright-Field Electron Tomography, J. Phys. Chem. B, 2003, 107(38), 10552–10556 CrossRef CAS.
- P. A. Midgley, et al., High-resolution scanning transmission electron tomography and elemental analysis of zeptogram quantities of heterogeneous catalyst, J. Phys. Chem. B, 2004, 108(15), 4590–4592 CrossRef CAS.
- G. Prieto, et al., Towards stable catalysts by controlling collective properties of supported metal nanoparticles, Nat. Mater., 2013, 12(1), 34–39 CrossRef CAS PubMed.
- K. J. Batenburg and J. Sijbers, DART: a practical reconstruction algorithm for discrete tomography, IEEE Trans. Image Process, 2011, 20(9), 2542–2553 Search PubMed.
- W. van Aarle, et al., The ASTRA Toolbox: A platform for advanced algorithm development in electron tomography, Ultramicroscopy, 2015, 157, 35–47 CrossRef CAS PubMed.
- P. Gilbert, Iterative Methods for the Three-dimensional Reconstruction of an Object from Projections, J. Theor. Biol., 1972, 36(1), 105–117 CrossRef CAS PubMed.
- F. Sanchez, et al., Hydrogen production from formic acid decomposition in the liquid phase using Pd nanoparticles supported on CNFs with different surface properties, Sustainable Energy Fuels, 2018, 2(12), 2705–2716 RSC.
- Z. Wang, et al., Pd nanoparticles anchored on amino-functionalized hierarchically porous carbon for efficient dehydrogenation of formic acid under ambient conditions, J. Mater. Chem. A, 2019, 7(45), 25791–25795 RSC.
- Y. Chen, et al., Efficient synthesis of ultrafine Pd nanoparticles on an activated N-doping carbon for the decomposition of formic acid, Catal. Commun., 2018, 108, 55–58 CrossRef CAS.
- S. Wang, et al., Aggregation-free gold nanoparticles in ordered mesoporous carbons: toward highly active and stable heterogeneous catalysts, J. Am. Chem. Soc., 2013, 135(32), 11849–11860 CrossRef CAS PubMed.
- F. Ziegler, et al., Olefin Metathesis in Confined Geometries: A Biomimetic Approach toward Selective Macrocyclization, J. Am. Chem. Soc., 2019, 141(48), 19014–19022 CrossRef CAS PubMed.
- X. Wang, et al., Pd/C nanocatalyst with high turnover frequency for hydrogen generation from the formic acid–formate mixtures, Int. J. Hydrogen Energy, 2014, 39(2), 837–843 CrossRef CAS.
- J.-P. Zhou, et al., Formic acid–ammonium formate mixture: A new system with extremely high dehydrogenation activity and capacity, Int. J. Hydrogen Energy, 2016, 41(47), 22059–22066 CrossRef CAS.
- D. Hlushkou, A. Svidrytski and U. Tallarek, Tracer-Size-Dependent Pore Space Accessibility and Long-Time Diffusion Coefficient in Amorphous, Mesoporous Silica, J. Phys. Chem. C, 2017, 121(15), 8416–8426 CrossRef CAS.
- S.-J. Reich, et al., Hindrance Factor Expression for Diffusion in Random Mesoporous Adsorbents Obtained from Pore-Scale Simulations in Physical Reconstructions, Ind. Eng. Chem. Res., 2018, 57(8), 3031–3042 CrossRef CAS.
Footnote |
| † Electronic supplementary information (ESI) available. See DOI: https://doi.org/10.1039/d2na00664b |
| This journal is © The Royal Society of Chemistry 2023 |

