 Open Access Article
Creative Commons Attribution 3.0 Unported Licence
Photocatalytic formation of a gas permeable layer selectively deposited on supported metal nanoparticles for sintering-resistant thermal catalysis†
Ayato
Takabayashi
a,
Fuminao
Kishimoto
 a,
Hiroto
Tsuchiya
b,
Hitoshi
Mikami
b and
Kazuhiro
Takanabe
 *a
*a
aDepartment of Chemical System Engineering, School of Engineering, The University of Tokyo, 7-3-1 Hongo, Bunkyo-ku, Tokyo 113-8656, Japan. E-mail: takanabe@chemsys.t.u-tokyo.ac.jp
bHonda R&D Co., Ltd., 4630 Shimotakanezawa, Haga-machi, Hagagun, Tochigi 321-3393, Japan
First published on 19th December 2022
Abstract
Nanoparticle aggregation of supported metal catalysts at high temperatures is a serious problem that causes a drop in catalytic performance. This study investigates the protection of metal nanoparticles from sintering by selectively forming nanoscale SiO2 shells on Pd supported on TiO2 by ultraviolet (UV) light irradiation. The proton-coupled reduction reaction increases the local pH around Pd nanoparticles, resulting in hydrolysis of tetraethoxyorthosilicate (TEOS) in only the vicinity of the metal. An apparent quantum efficiency of only 0.6% is obtained for the Pd/TiO2 catalyst in H2 evolution from ethanol-containing water under 370 nm excitation light. Therefore, the pH of raw slurry solution should be precisely controlled to that slightly below the threshold value for the TEOS hydrolysis reaction before the photodeposition. Transmission electron microscopy (TEM) and energy dispersive X-ray spectroscopy (EDX) clearly show that the particle size of the Pd nanoparticles (∼40 nm) with the SiO2 shell (∼20 nm) was almost unchanged by the high-temperature treatment at 900 °C in air, suggesting that the SiO2 shell prevented thermal aggregation of Pd nanoparticles. The Pd/TiO2 without SiO2 shell decoration exhibited a drop in the number of active sites, which was likely due to aggregation of the Pd catalysts. However, the number of active sites on the Pd@SiO2/TiO2 catalyst was maintained even after the catalyst was calcined at 900 °C. Consequently, the Pd@SiO2/TiO2 catalyst maintained its catalytic performance for simulated exhaust gas purification even after treatment at 900 °C. This study presents a methodology to produce sintering-tolerant supported metal nanoparticles using the photocatalytic gas permeable layer fabrication method.
Introduction
An exhaust-gas purification system for automobiles uses an excessive amount of noble metals due to aggregation of the supported metal catalysts under harsh conditions, such as high-temperature hydrothermal conditions.1,2 Aggregation is a phenomenon in which highly dispersed nanoparticles fuse on support materials at high temperature, resulting in particles with a large diameter and low dispersion.3,4 The aggregation is typically induced by increased diffusion coefficients due to temperature beyond the Tammann temperature,5 nanosizing of particles6 (Ostwald ripening7), or direct particle migration and coalescence.8 Suppressing the sintering could allow for high reactivity to be maintained for the exhaust-gas purification reaction, which could minimize the amount of noble metals (Rh, Pd, and Pt) used in the system, thus reducing the system cost and mitigating security risks related to the rare metals.Many studies have proposed ways to avoid the aggregation of metal particles on a support,9 such as the development of a series of “super intelligent” catalysts,10 enhanced metal–support interactions,11–13 and coating metal nanoparticles with thin metal oxide layers.14–20 However, the aggregation of the supported Pd nanoparticles under high-temperature treatment is complicated, and redispersion and sintering can occur during calcination in the presence of oxygen.21–23 Two-dimensional surface Pd oxides during oxidation have been considered to be responsible for the redispersion of the Pd nanoparticles. Because the redispersion temperature depends on the Pd particle size, there is a very complex trade-off between the redispersion and aggregation of Pd nanoparticles. Such complex physicochemical phenomena lead us to fabricate an ensured protection layer on nanoparticles by encapsulation.24
Indeed, while there are many reports on the encapsulation of metal nanoparticles by metal oxide protection layers, most of them demonstrated self-assembly of metal alkoxides on colloidal metal nanoparticles.25–31 The assembly of metal alkoxide precursors with a structure directing agent (SDA) can be induced by surfactant molecules or a microemulsion environment around the metal nanoparticles, resulting in the formation of gas-permeable metal oxide layers. Although these synthetic methods are well established in terms of materials chemistry, they are not suitable for industrial catalytic applications that require robust supports. Nevertheless, there are very limited examples of fabricating metal oxide protective layers on supported metal nanoparticle catalysts. Stair et al. developed a metal oxide decoration method on supported metal catalysts using atomic layer deposition (ALD).32,33 Appropriate thermal treatment of the encapsulated catalyst can induce gas permeability of the metal oxide layers by the formation of cracks. However, large-scale manufacturing processes using ALD have not yet been established due to the requirement of vacuum conditions and extraordinary devices. Although strong metal–support interaction (SMSI) under reducing conditions that can also induce spontaneous encapsulation of supported metal nanoparticles is well studied,34,35 the SMSI state is not stable during the oxidative exhaust-gas purification reaction.
In this study, we demonstrated a photocatalytic fabrication method of an ultrathin SiO2 layer selectively decorated on already supported Pd metal nanoparticles to develop a sintering-resistant exhaust gas purification catalyst. The SiO2 layer decoration was done using a slurry consisting of Pd/TiO2 catalysts, tetraethylorthosilicate (TEOS) as a silica source, aqueous NaNO3 as an electrolyte, and the tetramethylammonium cation (TMA+) as an SDA. Thermal decomposition of the SDA endows the SiO2 layer with gas permeability, which enables the reactant exhaust gas components to get access to the Pd surface. This fabrication method is an application of our previous report on the decoration of a SiO2 layer over the Pt/SrTiO3 photocatalyst to develop efficient particulate photocatalysts for overall water splitting.36 The role of the SiO2 shell on Pt/SrTiO3 is to function as a nanomembrane; H2 generated inside the shell should escape through it, but O2 generated outside cannot reach the Pt surface, preventing the reverse reaction of the overall water splitting. This reaction proceeded at close to room temperature in the liquid phase. The current paper investigates whether this nanomembrane selectively decorated on the supported metal particles can be applied to high-temperature exhaust gas purification. The physicochemical role of the SiO2 layer in sintering-resistance of supported Pd nanoparticles was investigated. To apply the fabrication method of the SiO2 layer for universal support materials, which are not specifically designed as a photocatalyst, precise control of the pH of the SiO2 deposition solution is very crucial for effective SiO2 decoration on Pd nanoparticles.
Experimental
Materials
All chemicals were used as received. Rutile TiO2 (<5 μm, ≥99.9%), tetramethylammonium bromide (TMAB, ≥98.0%), NaNO3 (≥99.0%), sodium hydroxide (NaOH, 99.9%), hydrochloric acid (HCl, 37%), methanol (99.5%), and ethanol (99.5%) were purchased from Sigma--Aldrich. HNO3 solution containing Pd(NO3)2 (0.216 M) was purchased from Kojima Chemicals Co., Ltd. Tetraethyl orthosilicate (TEOS, >97.0%) was purchased from Tokyo Chemical Industry.Preparation of Pd-impregnated TiO2
The Pd/TiO2 catalyst was prepared by a simple impregnation method. TiO2 rutile (0.950 g) was dispersed in a mixture of ultrapure water (20 mL) and Pd(NO3)2·HNO3 solution (0.202 or 1.01 mL corresponding to 1 or 5 wt% Pd). The resulting slurry was ultrasonicated for 15 min and stirred while heating in a water bath at 100 °C until the water completely evaporated. Next, the sample was placed in a muffle furnace and calcined under static air for 2 h at 500 °C, 700 °C, or 900 °C with a heating rate of 5 °C min−1. Finally, the products were reduced under pure H2 for 2 h at 150 °C with a heating rate of 5 °C min−1.36–38 The obtained catalysts were denoted as Pd/TiO2-500, Pd/TiO2-700, and Pd/TiO2-900, respectively.Photocatalytic performance test of Pd/TiO2
A photocatalytic performance test was conducted on the 5 wt% Pd/TiO2 catalyst to see whether the excited electrons from TiO2 could be utilized in this reaction. The Pd/TiO2 catalyst (0.010 g) was dispersed in 10 mL of an aqueous solution of 10 vol% MeOH. The slurry was then irradiated with UV light under ambient pressure with stirring. The amount of evolved H2 gas was quantified using an online GC (GC-8A, Shimadzu) equipped with a thermal conductivity detector (TCD). The apparent quantum yield (AQY) of the catalyst was calculated using the following equation:where N(H2) and N(photons) denote the number of H2 molecules produced and the number of photons reaching the surface of the reaction solution, respectively.
SiO2 precipitation by increasing pH
A solution was prepared for the SiO2 precipitation test by dissolving TMAB (5.25 g) and NaNO3 (0.852 g) in a mixture of ultrapure water (100 mL) and ethanol (100 mL). TEOS (15.2 mL) was then added into the solution after the pH was adjusted to 3 with HCl (1.0 M). After 2 h of stirring, NaOH aqueous solution (10 mM) was added drop by drop to increase the pH. With every increase in pH of 0.5, the UV-Vis absorption spectrum and dynamic light scattering (DLS) of the solution were measured using a JASCO UV-Vis V-770 (wavelength range of 200 nm to 2700 nm with a scan speed of 400 nm min−1) and HORIBA nanoPartica SZ-100, respectively. For the DLS measurement, the diameter of the precipitates was determined from the average of 10 measurements.Preparation of the Pd@SiO2/TiO2 structure
SiO2 layer deposition on Pd/TiO2 was performed in a solution consisting of TMAB, NaNO3, and TEOS. TMAB (7.86 g) and NaNO3 (1.28 g) were dissolved in a mixture of ultrapure water (150 mL) and ethanol (150 mL), and then TEOS (22.8 mL) was added to the solution after the pH was adjusted to 3 with HCl (1.0 M). After 2 h of stirring, Pd/TiO2-500 (0.150 g) was dispersed in the solution, and the pH was adjusted to 5 by the addition of an aqueous solution of NaOH (0.10 M). The resulting slurry was irradiated with UV light (Asahi Spectra Co., Ltd., CL-H1-365-9-1) for 0.5 h with stirring and Ar bubbling. The UV light had a peak wavelength of 370 nm and a power of 870 mW.The precipitates were separated by centrifugation and dried for 16 h at 110 °C with a heating rate of 5 °C min−1. They were then calcined under static air for 2 h at 500 °C, 700 °C, or 900 °C with a heating rate of 5 °C min−1 in a muffle furnace. Finally, the catalysts were reduced under 30 mL min−1 of pure H2 for 2 h at 150 °C with a heating rate of 5 °C min−1. They were denoted as Pd@SiO2/TiO2-500, Pd@SiO2/TiO2-700, or Pd@SiO2/TiO2-900, respectively.
Carbon monoxide chemisorption
The obtained catalysts (0.040 g) were packed in a U-shape quartz tube and pretreated under 4% H2 balanced with Ar (10 mL min−1) at 150 °C for 30 min with a heating rate of 40 °C min−1. After purging with pure Ar (10 mL min−1) at 150 °C for 30 min, the catalysts were cooled down to 10 °C with ice packs. Subsequently, 500 μL of diluted CO gas (Ar balance, 0.4%) was injected every 8 min until CO was no longer adsorbed. The amount of CO that slipped through without being adsorbed was quantified using a gas chromatograph with a flame ionization detector (SHIMADZU GC-FID, GC-8A) and a methanizer (SHIMADZU MTN-1) and calculated from the peak area.Characterization
Transmission electron microscope (TEM) images were obtained using a JEOL 2000EX-II (acceleration voltage: 200 kV) equipped with a CCD camera. The specimens for TEM were prepared by placing drops of the sample dispersed in EtOH onto a 200-mesh copper grid coated with an amorphous carbon film with holes. Scanning transmission electron microscope images and energy dispersive spectroscopy mappings (STEM/EDS) were obtained using an FEI Talos F200X equipped with a Super-X (FEI) and SDD detector (Bruker). Nitrogen adsorption–desorption isotherms were recorded using a MicrotracBEL BELMETAL III. Prior to the measurement, the samples were dried under vacuum at 100 °C for 2 h.Elemental analysis of the catalysts was performed using a scanning electron microscope and an energy dispersive X-ray spectrometer (SEM/EDX, Hitachi High-Tech S-4700-D). The length of the measurement was 120 s, and the acceleration voltage was 20.00 kV. Inductively coupled plasma optical emission spectrometry measurements were also performed (ICP-OES, Agilent 5110 VDV). X-ray photoelectron spectroscopy (XPS) was performed using a JEOL JPS-9010 MC with a Mg Kα X-ray source. The powder sample was deposited on a metal nickel plate, and powder X-ray diffraction (XRD) patterns of the catalysts were collected on a D/texUltra UltimaIII operated at 40 kV and 40 mA. The samples were scanned from 20° to 60° at 10° min−1, and the average of 10 measurements was taken.
Catalytic performance test
Catalytic reaction rates were measured using a fixed bed catalyst reactor system (MicrotracBEL, BELREA). First, 0.100 g of each catalyst was pretreated at 500 °C in both O2 flow and H2 flow for 15 min each. The catalytic performance was then tested in 400 mL min−1 of simulated exhaust gas, which consisted of 500 ppm of NO, 5000 ppm of CO, 400 ppm of C3H6, 10% H2O, 14% CO2, 4900 ppm of O2, and 1700 ppm of H2 in N2 balance and ambient pressure. The reaction temperature was 200 °C to 500 °C. The outlet gas was analyzed by FT-IR (Best Instruments Co., Ltd., Bex-1000FT), an oxygen meter, and a hydrogen meter (Best Instruments Co., Ltd., Bex-520M).Results and discussion
Photocatalytic shell formation scheme
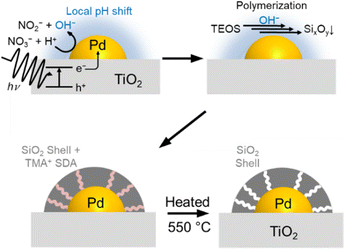
Fig. 1 illustrates the shell formation scheme. Under UV light irradiation, the electrons generated by the photoexcitation of TiO2 can be transferred to Pd nanoparticles. Next, the excited electrons in the Pd nanoparticles produce H2 or reduce NO3− as in the following equations, resulting in higher local pH in the vicinity of the Pd nanoparticles.| 2H+ + 2e− → H2 | (1) |
| NO3− + H+ + 2e− → NO2− + OH− | (2) |
The locally increased pH induces the polymerization reaction of TEOS to form SixOy oligomers, which are deposited on the Pd surface with TMA+ by electrostatic force.39–41 Finally, the removal of TMA+ by the calcination process forms micropores in the SiO2 shell, which allows gas diffusion to the core Pd.42,43
Optimization of SiO2 decoration conditions
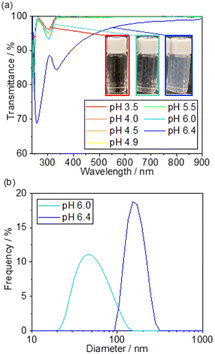
The photocatalytic activity of 5 wt% Pd/TiO2 is shown in Fig. S1,† for which the H2 production rate was recorded in the presence of methanol as an electron donor. The 5 wt% Pd/TiO2 catalyst (∼0.6%) had an apparent quantum yield (AQY) at 370 nm that was approximately one-hundredth lower than the reported AQY value for SrTiO3-based photocatalysts.39 Hence, the local pH shift induced by the photocatalysis of 5 wt% Pd/TiO2 was expected to be smaller than that of Pt/SrTiO3. Therefore, prior to the preparation of the catalyst, the threshold pH for SiO2 precipitation was precisely measured. Based on the results, the initial pH for SiO2 decoration on Pd/TiO2 was determined to be slightly lower than the threshold pH.Fig. 2a shows the UV-Vis transmission spectra of the solutions consisting of TEOS, NaNO3, and TMAB at various pH controlled by the addition of aqueous NaOH solution. The transmittance is hardly changed in the range of pH 3.5–5.5, but it begins to decrease slightly at pH 6.0 and significantly drops at pH 6.4. These results demonstrate that a small amount of SixOy nanoparticles were formed at pH 6.0, and more were produced at pH 6.4. The formation of the nanoparticles was also observed by DLS measurements, as shown in Fig. 2b.
Below pH 6, almost no particles were present in the solution, which is consistent with the non-reproducible histograms derived from small fluctuations of the laser. Particles with a size distribution of 20–100 nm were observed at pH 6.0, which increased to 100–300 nm at pH 6.4. These results suggest that the formation of SixOy precipitates by dehydration condensation of TEOS-derived Si(OH)4 began at pH 5.5–6.0. Based on the results, the initial pH of the solution for SiO2 deposition was set to 5.
SiO2 shell decoration on Pd/TiO2
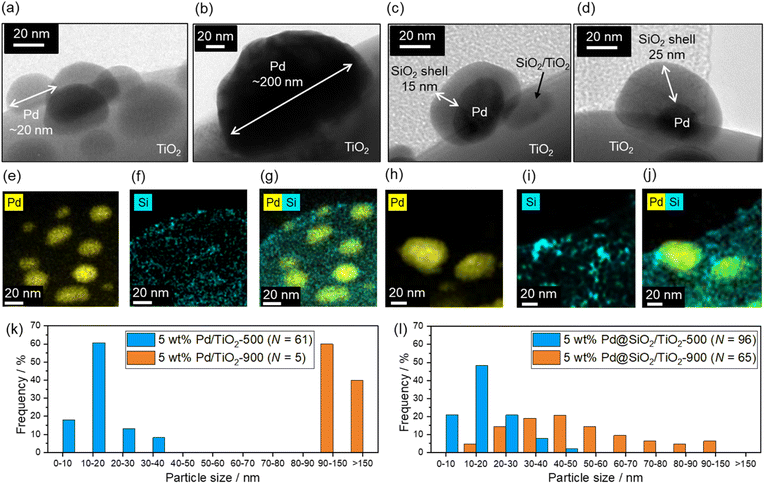
Fig. 3 shows the TEM images of the 5 wt% Pd/TiO2-500, 5 wt% Pd/TiO2-900, 5 wt% Pd@SiO2/TiO2-500, and 5 wt% Pd@SiO2/TiO2-900 catalysts. Pd nanoparticles with a size of about 5–30 nm are observed in 5 wt% Pd/TiO2-500 (Fig. 3a), but after 900 °C heat treatment in air, the Pd nanoparticles are sintered and have a particle size of more than 100 nm air (5 wt% Pd/TiO2-900, Fig. 3b). Histograms of Pd particle size on 5 wt% Pd/TiO2-500 and 5 wt% Pd/TiO2-900 obtained from TEM images are shown in Fig. 3k. The mean particle size increased from 16 nm to over 130 nm. The distribution of Pd particle size was statistically enlarged due to sintering induced by high-temperature heat treatment. The TEM image of 5 wt% Pd@SiO2/TiO2-500 in Fig. 3c shows that Pd nanoparticles with a size of ∼40 nm are covered by an amorphous shell with a thickness of ∼15 nm. Other TEM images of 5 wt% Pd@SiO2/TiO2-500 are shown in Fig. S2.† The particle size of Pd nanoparticles was roughly ∼20 nm and the thickness of the SiO2 layer was ∼20 nm.To confirm that the amorphous shell consists of SiO2, STEM/EDS mapping images of Pd and Si distribution on the catalysts were acquired (Fig. 3e–g). The distribution of Si is localized around the Pd nanoparticles in both 5 wt% Pd@SiO2/TiO2-500 and 5 wt% Pd@SiO2/TiO2-900, demonstrating that the amorphous shell layer on Pd nanoparticles in Fig. 3c should be SiO2. Similar to the 5 wt% Pd/TiO2, SiO2 decoration on 1 wt% Pd/TiO2 was also demonstrated, as shown in Fig. S3.† The Pd nanoparticles with a size of about 5 nm were covered by amorphous SiO2 shells with a thickness of a few nanometers. Fig. S4† shows the SEM image of 5 wt% Pd@SiO2/TiO2-500. The particle size of the TiO2 was ∼1 μm.
To investigate the importance of UV light irradiation for uniform decoration of the SiO2 shell on Pd nanoparticles, TEOS treatment of Pd/TiO2 catalysts under dark conditions was performed as a control experiment. The TEM image of the Pd/TiO2 after TEOS treatment under dark conditions (Fig. S5†) shows sparse deposition of amorphous SiO2 clusters on the entire Pd/TiO2 surface. Unlike Pd@SiO2/TiO2 catalysts prepared by UV-light irradiation, the Pd nanoparticles were not covered by the uniformly decorated SiO2 nanoparticles. Therefore, the photocatalytic reaction induced by UV light irradiation is essential for the uniform SiO2 shell decoration on Pd nanoparticles.
Weight fractions of Si and Pd in 5 wt% Pd@SiO2/TiO2-500 were determined by ICP-OES measurement and the results are shown in Table 1. The weight percent of Pd was measured to be 5.0 wt%, which is equal to the Pd quantity in the impregnation solution. The weight fraction of SiO2 was determined to be 5.9 wt%. No impurities of Na and Br were detected. According to the density of the Pd and SiO2 (12.0 g cm−1 and 2.65 g cm−1, respectively), the volume ratio between the Pd and SiO2 was calculated as 1:5.3.
| Sample | Component ratio/wt% | Si/Pd ratio | ||
|---|---|---|---|---|
| Pd | SiO2 | TiO2 | ||
| 5 wt% Pd@SiO2/TiO2-500 | 5.0 | 5.9 | 89 | 2.1 |
| 5 wt% Pd@SiO2/TiO2-900 | 5.1 | 6.3 | 89 | 2.2 |
Assuming that all the SiO2 forms a hemispherical shell on the hemispherical Pd nanoparticles, the thickness of the shell should be about 0.4 times the diameter of the Pd nanoparticles. Hence, if the Pd grain size is 40 nm, the thickness of the SiO2 shell is calculated to be 16 nm, which is roughly consistent with the TEM result (Fig. 3c). Therefore, the weight content of the SiO2 (∼6 wt%) should be reasonable. SiO2 particles were also observed on the TiO2 surface because SiO2 precursors are unavoidably adsorbed on the TiO2 surface.
The Pd particle size is almost maintained even after heat treatment at 900 °C in air (5 wt% Pd@SiO2/TiO2-900, Fig. 3d). The diameter of the Pd nanoparticles seems to be slightly increased after heat treatment at 900 °C (Fig. 3h) in comparison to the STEM/EDS mapping images of Pd in 5 wt% Pd@SiO2/TiO2-500 (Fig. 3e). Histograms of Pd particle size on 5 wt% Pd@SiO2/TiO2-500 and 5 wt% Pd@SiO2/TiO2-900 were obtained from the STEM/EDS mapping and shown in Fig. 3l. Although the mean particle size increased from 23 nm to 53 nm after 900 °C heat treatment, the Pd particle size of 5 wt% Pd@SiO2/TiO2-900 was clearly statistically smaller compared to 5 wt% Pd/TiO2-900. The localization of the Si distribution around Pd particles was also measured (Fig. 3i and j), and the weight percent of Pd and SiO2 was not changed after heat treatment at 900 °C in air (Table 1). This suggests that the SiO2 shell prevents aggregation of the Pd nanoparticles.
Table 2 summarizes the amount of CO adsorbed on 5 wt% Pd/TiO2 and 5 wt% Pd@SiO2/TiO2 after heat treatment in air at various temperatures. The amount of CO adsorbed on 5 wt% Pd/TiO2 after heat treatment at 500 °C drastically dropped from 15 μmol gcat−1 to 2.8 μmol gcat−1 after heat treatment at 900 °C. The rate of the decrease of the surface Pd site after heat treatment at 900 °C in air was calculated to be 22%. The calculated particle diameter with an assumption of hemispherical Pd particles was 25 nm after heat treatment at 500 °C and 139 nm after heat treatment at 900 °C, which is consistent with the TEM results.
The CO adsorption capacity on 5 wt% Pd@SiO2/TiO2 was 94% retained even after heat treatment at 900 °C, suggesting that the SiO2 decoration suppressed the aggregation of Pd nanoparticles and achieved excellent high-temperature stability. Although the CO adsorption amount decreases for 5 wt% Pd@SiO2/TiO2-500 (5.0 μmol gcat−1) compared to 5 wt% Pd/TiO2-500 (15 μmol gcat−1), this result may not simply be due to the SiO2 layer inhibiting the adsorption of CO onto the Pd surface. As will be discussed later, the catalytic activity of exhaust gas purification reactions is almost unchanged with or without the SiO2 layer. Hence, it can be concluded that SiO2 does not block the surface sites, and the decrease in CO adsorption by the SiO2 layer modification can be attributed to the difference in the interaction between CO and the Pd surface.
A similar trend was observed when the loaded Pd amount was decreased to 1 wt%. The amount of CO adsorbed on 1 wt% Pd/TiO2 significantly drops to 22% after heat treatment at 900 °C in air, but the CO adsorption amount on 1 wt% Pd@SiO2/TiO2 is well maintained (∼100%) after the heat treatment. Therefore, aggregation of Pd nanoparticles at elevated temperature can be effectively prevented by the shell.
X-ray photoemission spectroscopy was also performed on 5 wt% Pd/TiO2-500 and 5 wt% Pd@SiO2/TiO2-500. In the survey scan (Fig. 4a), Si peaks that cannot be seen for 5 wt% Pd/SiO2/TiO2-500 clearly appear for 5 wt% Pd@TiO2-500, indicating that SiO2 was deposited on the catalyst. The detailed chemical state of Si species on the Pd/TiO2 catalyst was characterized using the Si 2p region X-ray photoemission spectrum (Fig. 4b). Based on the binding energy of the Si 2p peaks, the deposited Si species on both Pd@SiO2/TiO2 and Pd/TiO2 after TEOS treatment under dark conditions can be identified as SiO2. The spectra show that the Si 2p peak position of Pd@SiO2/TiO2 was positively shifted compared to the Si 2p peak of the Pd/TiO2 catalyst after TEOS treatment under dark conditions. Unlike the SiO2 clusters sparsely deposited on the Pd/TiO2 catalyst, the SiO2 shell localized on the Pd nanoparticles became positively charged probably due to electron withdrawal by Pd nanoparticles.
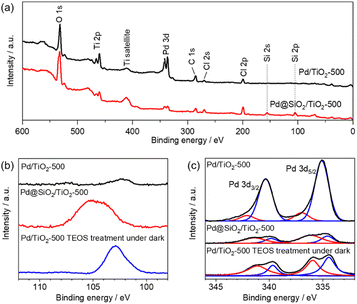 | ||
| Fig. 4 XPS results of 5 wt% Pd/TiO2-500 and 5 wt% Pd@SiO2/TiO2-500. (a) Survey scan, (b) Si 2p region and (c) Pd 3d region. | ||
Fig. 4c shows the detailed spectra of the region of Pd 3d peaks. The peak area decreased after the SiO2 decoration, suggesting that the Pd nanoparticles were successfully covered by SiO2. Pd 3d peaks were also slightly decreased by the TEOS treatment, suggesting that the Pd nanoparticles should be partially coated with the SiO2 clusters. However, the peak intensity is much higher than that of the Pd@SiO2/TiO2 catalysts prepared by UV light irradiation. Therefore, the photocatalytic reaction triggers uniform SiO2 shell formation on Pd nanoparticles, which corresponds to the TEM observation.
Deconvolution revealed the components of metallic Pd (340.5 eV and 335.3 eV) and PdO (342.3 eV and 337.0 eV) in the spectra of both 5 wt% Pd/TiO2-500 and 5 wt% Pd@SiO2/TiO2-500. The ratio of the PdO peak to the Pd metal peak is higher for 5 wt% Pd@SiO2/TiO2-500, which is probably due to the selective SiO2 decoration on metallic Pd or oxidation of the surface Pd species resulting from the formation of an interface with the SiO2 shell.
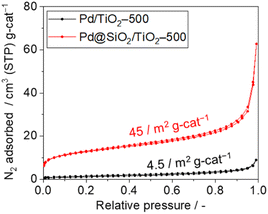
The surface area and porosity of the SiO2 shell were examined using nitrogen adsorption–desorption isotherms and carbon monoxide pulsed adsorption measurement, as shown in Fig. 5. The isotherm of 5 wt% Pd/TiO2-500 exhibits type II features and a Brunauer–Emmett–Teller (BET) surface area of 4.5 m2 gcat−1 (Fig. 5). However, the isotherm of 5 wt% Pd@SiO2/TiO2 shows a steep rise in the lower relative pressure region, suggesting the presence of micropores. The BET surface area of Pd@SiO2/TiO2 was 45 m2 gcat−1. The 10-fold increase in the surface area of 5 wt% Pd@SiO2/TiO2 compared to Pd/TiO2 is attributed to the porous nature of the SiO2 shell on Pd.
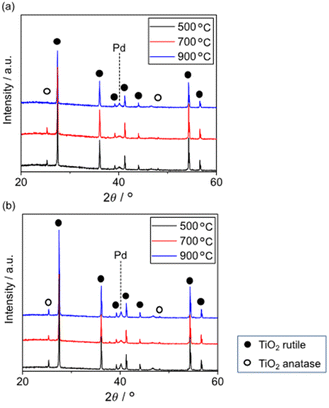
Fig. 6 shows the XRD patterns of 5 wt% Pd/TiO2 and 5 wt% Pd@SiO2/TiO2 after heating at various temperatures. All patterns exhibited a small peak around 40.1° corresponding to Pd0(111). The pattern of 5 wt% Pd/TiO2 demonstrated that the TiO2 support consisted of a major rutile phase and a minor anatase phase. The minor anatase peaks of 5 wt% Pd/TiO2 disappeared after heat treatment at 900 °C. Typically, the transition temperature of TiO2 without any modifications is around 800 °C. However, 5 wt% Pd@SiO2/TiO2 showed the anatase peaks even after heat treatment at 900 °C, suggesting that SiO2 deposition on the Pd/TiO2 shifted the anatase-to-rutile transition temperature of the TiO2 support to a higher temperature.
Okada et al. reported an upper shift of the transition temperature of TiO2 by a few atomic percent with Si doping. This was due to the suppression of surface nucleation sites for rutile by the formation of an amorphous SiO2 surface layer.44 Similar to this report, the SiO2 partially covering the Pd/TiO2 applied via photodeposition seemed to have the ability to suppress the nucleation sites of rutile TiO2.
Catalytic performance of Pd@SiO2/TiO2
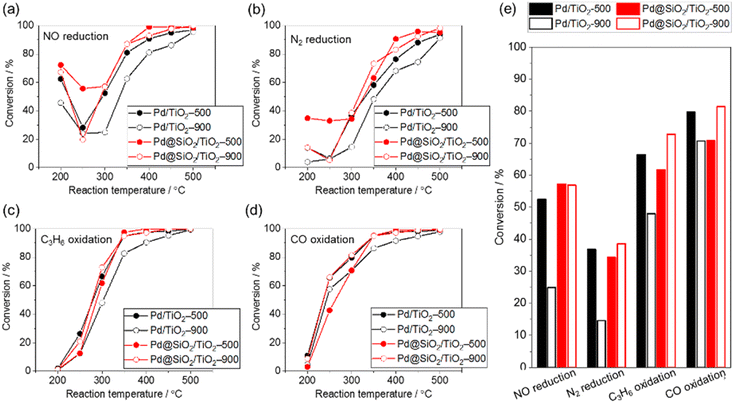
The purification reaction of simulated exhaust gas was examined to investigate the influence of the high-temperature treatment of 5 wt% Pd/TiO2 and 5 wt% Pd@SiO2/TiO2 on the catalytic performance (Fig. 7). The test was carried out under a gas flow of NO (500 ppm), CO (5000 ppm), C3H6 (400 ppm), H2O (10%), CO2 (14%), O2 (4900 ppm), and H2 (1700 ppm) with N2 balance at ambient pressure. The conversion of NO reduction, CO oxidation, and C3H6 oxidation was estimated from the concentrations of NO, CO, and C3H6 in outlet gas, respectively, while N2 reduction was estimated using the NH3, NO2, and N2O concentrations in the outlet gas.In all reactions, the conversion increased at an elevated reaction temperature, but there was a relatively high conversion of NO and N2 reduction at lower temperature due to the selective reduction by H2 contained in the reaction gas. In other words, the reducing agent for NO and N2 reduction was changed from H2 at lower temperature to other gases (e.g., CO or C3H8) at higher temperature. This occurred because the H2 was consumed by the reaction with O2 at higher temperature.45
The conversion of NO reduction, N2 reduction, and C3H8 oxidation over 5 wt% Pd/TiO2 significantly dropped after heat treatment at 900 °C in air due to the aggregation of the Pd nanoparticles. In contrast, Pd@SiO2/TiO2 maintained the conversion of the NO and N2 reduction or improved the conversion of C3H8 oxidation even after the treatment. This demonstrates the protective role of the SiO2 shell on Pd nanoparticles in preventing the thermal drop of the catalytic performance. The catalytic performance of Pd@SiO2/TiO2-500 for the NO reduction, N2 reduction and C3H8 oxidation was almost corresponding to the performance of Pd/TiO2-500. Therefore, the gas permeability of the SiO2 shell was sufficiently high not to prevent the catalytic reaction at Pd nanoparticles. Moreover, SiO2 decoration does not inhibit the Pd surface site for activation of exhaust gas. On the other hand, the performance of CO oxidation is not significantly changed by the SiO2 decoration and probably due to CO diffusion limitation of the CO oxidation kinetics above 277 °C.46
There have been no previous demonstrations of the use of these photocatalytically fabricated gas-permeable layers for high-temperature thermal catalytic reactions, and this paper is the first report of such a demonstration. The current photocatalytic fabrication method can be applied for a large variety of gas permeable layers, such as chromium-,47 molybdenum-,48 titanium-,49,50 tantalum-based oxides,49,50 and so on. Furthermore, this photo-assisted fabrication method does not require special vacuum conditions and can be applied for mass production using a continuous-flow synthesis system.51 This study bridges strategies of photocatalysis-assisted nanostructure synthesis and thermal catalysts with sintering tolerance.
Conclusions
In this work, ultrathin SiO2 shells were successfully synthesized on Pd nanoparticles supported by TiO2 by a local pH shift near the supported Pd catalyst using a UV light-induced photocatalytic reaction on the TiO2 support. TEM and STEM/EDS mapping images showed that the particle size of the Pd nanoparticles (∼40 nm) with the SiO2 shell (∼20 nm) was almost unchanged by high-temperature treatment at 900 °C in air. This suggested that the SiO2 shell prevented thermal aggregation of the nanoparticles. The Pd/TiO2 without the SiO2 shell exhibited a drop in the number of active sites, which was likely due to aggregation of the –Pd catalysts. However, the number of active sites on the Pd@SiO2/TiO2 catalyst was maintained even after the catalyst was calcined at 900 °C. Consequently, the SiO2 shell on Pd nanoparticles prevented the drop in the catalytic performance of the Pd/TiO2 catalyst in simulated exhaust gas purification without disturbing the catalytic performance.Author contributions
K. T. and H. M. led the research and contributed to the experiment planning, results analysis, and supervision of the research project. A. T. and H. T. carried out the experiments. F. K. and H. T. were involved in the design of experiments, results analysis, and paper writing. All the authors worked on the preparation of the manuscript and provided useful comments.Conflicts of interest
There are no conflicts to declare.Acknowledgements
F. K. would appreciate the financial support of the Leading Initiative for Excellent Young Researchers (LEADER) program by the Ministry of Education, Culture, Sports, Science and Technology (MEXT), Japan. The study was financially supported by Honda R&D Co., Ltd.References
- A. Beniya and S. Higashi, Nat. Catal., 2019, 2, 590 CrossRef.
- R. J. Farrauto, M. Deeba and S. Alerasool, Nat. Catal., 2019, 2, 603 CrossRef CAS.
- S. E. Wanke and P. C. Flynn, Catal. Rev., 1975, 12, 93 CrossRef CAS.
- E. Ruckenstein and B. Pulvermacher, J. Catal., 1973, 29, 224 CrossRef CAS.
- T. J. Gray, J. Am. Ceram. Soc., 1954, 37, 534 CrossRef CAS.
- K. Dick, T. Dhanasekaran, Z. Zhang and D. Meisel, J. Am. Chem. Soc., 2002, 124, 2312 CrossRef CAS PubMed.
- S. B. Simonsen, I. Chorkendorff, S. Dahl, M. Skoglundh, J. Sehested and S. Helveg, J. Catal., 2011, 281, 147 CrossRef CAS.
- T. W. Hansen, A. T. Delariva, S. R. Challa and A. K. Datye, Acc. Chem. Res., 2013, 46, 1806 CrossRef PubMed.
- A. K. Datye and M. Votsmeier, Nat. Mater., 2021, 20, 1049 CrossRef CAS PubMed.
- Y. Nishihata, J. Mizuki, T. Akao, H. Tanaka, M. Uenishi, M. Kimura, T. Okamoto and N. Hamada, Nature, 2002, 148, 164 CrossRef PubMed.
- H. Jeong, O. Kwon, B. Kim, J. Bae, S. Shin, H. Kim, J. Kim and H. Lee, Nat. Catal., 2020, 3, 368 CrossRef CAS.
- E. J. Peterson, A. T. DeLaRiva, S. Lin, R. S. Johnson, H. Guo, J. T. Miller, J. H. Kwak, C. H. F. Peden, B. Kiefer, L. F. Allard, F. H. Ribeiro and A. K. Datye, Nat. Commun., 2014, 5, 4885 CrossRef CAS PubMed.
- V. Muravev, G. Spezzati, Y. Q. Su, A. Parastaev, F. K. Chiang, A. Longo, C. Escudero, N. Kosinow and E. J. Hensen, Nat. Catal., 2021, 4, 469 CrossRef CAS.
- Y. Lu, Y. Yin, Z. Li and Y. Xia, Nano Lett., 2002, 2, 785 CrossRef CAS.
- J. N. Park, A. J. Forman, W. Tang, J. Cheng, Y. S. Hu, H. Lin and E. W. McFarland, Small, 2008, 4, 1694 CrossRef CAS PubMed.
- N. Almana, S. P. Phivilay, P. Laveille, M. N. Hedhili, P. Fornasiero, K. Takanabe and J. Basset, J. Catal., 2016, 340, 368 CrossRef CAS.
- R. G. Chaudhuri and S. Paria, Chem. Rev., 2012, 112, 2373 CrossRef PubMed.
- M. B. Gawande, A. Goswami, T. Asefa, H. Guo, A. V. Biradar, D. Peng, R. Zboril and R. S. Varma, Chem. Soc. Rev., 2015, 44, 7540 RSC.
- J. Li, Y. Zhang, S. Ding, R. Panneerselvam and Z. Tian, Chem. Rev., 2017, 117, 5002 CrossRef CAS PubMed.
- H. O. Otor, J. B. Steiner, C. Garcia-Sancho and A. C. Alba-Rubio, ACS Catal., 2020, 10, 7630 CrossRef CAS.
- E. Ruckenstein and J. J. Chen, J. Phys. Chem., 1981, 85, 1606 CrossRef.
- E. Ruckenstein and J. J. Chen, J. Colloid Interface Sci., 1982, 86, 1 CrossRef CAS.
- H. Lieske and J. Völter, J. Phys. Chem., 1985, 89, 1841 CrossRef CAS.
- A. Aitbekova, et al. , Nat. Mater., 2022, 21, 1290 CrossRef CAS PubMed.
- Q. Zhang, I. Lee, J. B. Joo, F. Zaera and Y. Yin, Acc. Chem. Res., 2013, 46, 1816 CrossRef CAS PubMed.
- C. Y. Seo, X. Chen, K. Sun, L. F. Allard, G. B. Fisher and J. W. Schwank, Catal. Commun., 2018, 108, 73 CrossRef CAS.
- A. J. Hill, C. Y. Seo, X. Chen, A. Bhat, G. B. Fisher, A. Lenert and J. W. Schwank, ACS Catal., 2019, 10, 1731 CrossRef.
- S. H. Joo, J. Y. Park, C. K. Tsung, Y. Yamada, P. Yang and G. A. Somorjai, Nat. Mater., 2009, 8, 126 CrossRef CAS PubMed.
- M. Cargnello, N. L. Wieder, T. Montini, R. J. Gorte and P. Fornasiero, J. Am. Chem. Soc., 2010, 132, 1402 CrossRef CAS PubMed.
- K. A. Dahlberg and J. W. Schwank, Chem. Mater., 2012, 24, 2635 CrossRef CAS.
- Z. Niu and Y. Li, Chem. Mater., 2014, 26, 72 CrossRef CAS.
- J. Lu, B. Fu, M. C. Kung, G. Xiao, J. W. Elam, H. H. Kung and P. C. Stair, Science, 2012, 335, 1205 CrossRef CAS PubMed.
- J. Lu, J. W. Elam and P. C. Stair, Acc. Chem. Res., 2013, 46, 1806 CrossRef CAS PubMed.
- S. J. Tauster, S. C. Fung and R. L. Garten, J. Am. Chem. Soc., 1978, 10, 170 CrossRef.
- H. Xin, R. Li, D. Li, T. Song, R. Mu, Q. Fu and X. Bao, J. Am. Chem. Soc., 2022, 144, 4874 CrossRef CAS PubMed.
- H. Zhu, Z. Qin, W. Shan, W. Shen and J. Wang, J. Catal., 2005, 233, 41 CrossRef CAS.
- H. Zhu, Z. Qin, W. Shan, W. Shen and J. Wang, Catal. Today, 2007, 126, 382 CrossRef CAS.
- F. Liang, H. Zhu, Z. Qin, G. Wand and J. Wand, Catal. Commun., 2009, 10, 737 CrossRef CAS.
- J. A. Bau and K. Takanabe, ACS Catal., 2017, 7, 7931 CrossRef CAS.
- A. Walcarius, E. Sibottier, M. Etienne and J. Ghanbaja, Nat. Mater., 2007, 6, 602 CrossRef CAS PubMed.
- A. Goux, M. Etienne, E. Aubert, C. Lecomte, J. Ghanbaja and A. Walcarius, Chem. Mater., 2009, 21, 731 CrossRef CAS.
- G. Herzog, E. Sibottier, M. Etienne and A. Walcarius, Faraday Discuss., 2013, 164, 259 RSC.
- S.-H. Wu, C.-Y. Mou and H.-P. Lin, Chem. Soc. Rev., 2013, 42, 3862 RSC.
- K. Okada, N. Yamamoto, Y. Kameshima, A. Yasumori and K. J. D. MacKenzie, J. Am. Ceram. Soc., 2001, 84, 1591 CrossRef CAS.
- H. Hamada and M. Haneda, Appl. Catal., A, 2012, 421, 1 CrossRef.
- B. Michel, Kinetics of Heterogeneous Catalytic Reactions, Princeton University Press, 1984 Search PubMed.
- K. Maeda, K. Teramura, D. Lu, N. Saito, Y. Inoue and K. Domen, Angew. Chem., Int. Ed., 2006, 45, 7806 CrossRef CAS.
- A.-T. Garcia-Esparza, et al. , Angew. Chem., Int. Ed., 2017, 56, 5780–5784 CrossRef CAS PubMed.
- T. Takata, C. Pan, M. Nakabayashi, N. Shibata and K. Domen, J. Am. Chem. Soc., 2015, 137, 9627 CrossRef CAS PubMed.
- T. Suguro, et al. , Nat. Commun., 2022, 13, 5698 CrossRef CAS PubMed.
- D. Cambie, C. Bottecchia, N. J. Straathof, V. Hessel and T. Noel, Chem. Rev., 2016, 116, 10276 CrossRef CAS PubMed.
Footnote |
| † Electronic supplementary information (ESI) available: TEM and SEM images, and photocatalytic activity. See DOI: https://doi.org/10.1039/d2na00703g |
| This journal is © The Royal Society of Chemistry 2023 |


