 Open Access Article
Cu2O/Co3O4 nanoarrays for rapid quantitative analysis of hydrogen sulfide in blood†
Manli
Lu‡
a,
Xiaomeng
Zhu‡
a,
Haoming
Sun
ab,
Huijuan
Chen
a,
Kaifeng
Xue
a,
Lulu
Du
a,
Liyuan
Cui
c,
Pinhua
Zhang
*a,
Dongchao
Wang
*a and
Guangliang
Cui
 *a
*a
aSchool of Physics and Electrical Engineering, Linyi University, Linyi, 276000, China. E-mail: cuiguangliang@lyu.edu.cn
bSchool of Mechanical Engineering, Dalian Jiaotong University, Dalian, 116028, China
cLinyi People's Hospital, Linyi 276000, Shandong, China
First published on 15th February 2023
Abstract
2D heterostructure nanoarrays have emerged as a promising sensing material for rapid disease detection applications. In this study, a bio-H2S sensor based on Cu2O/Co3O4 nanoarrays was proposed, the controllable preparation of the nanoarrays being achieved by exploring the experimental parameters of the 2D electrodeposition in situ assembly process. The nanoarrays were designed as a multi-barrier system with strict periodicity and long-range order. Based on the interfacial conductance modulation and vulcanization reaction of Cu2O and Co3O4, the sensor exhibited superior sensitivity, selectivity, and stability to H2S in human blood. In addition, the sensor exhibited a reasonable response to 0.1 μmol L−1 Na2S solution, indicating that it had a low detection limit for practical applications. Moreover, first-principles calculations were performed to study changes in the heterointerface during the sensing process and the mechanism of rapid response of the sensor. This work demonstrated the reliability of Cu2O/Co3O4 nanoarrays applied in portable sensors for the rapid detection of bio-H2S.
Introduction
Endogenous signaling molecules play an important role in many physiological functions—such as regulating the cardiovascular, nervous, and immune systems. In addition to NO and CO, hydrogen sulfide (H2S) was found to be a third endogenous gas signal molecule, its abnormal concentration being closely related to many ailments—including inflammation, myocardial infarction, hypertension, lung disease, and diabetes.1–7 To emphasize an important point, many of these diseases are chronic and incurable, and patients have to struggle with the disease for a long time, so a simple and reliable monitoring method is of special significance and value to health maintenance. A good example is the application of a portable glucose meter in the control and treatment of diabetes. In view of this, if one could obtain a rapid, convenient, highly sensitive, and highly selective sensor to monitor the dynamic changes in H2S in organisms, the controllability of these diseases could be greatly improved.H2S is a colorless, flammable, acidic, and water-soluble gas. Under physiological conditions, it exists primarily in the form of HS−, with just 20% (approximately) existing in the form of H2S.8 HS− and H+ maintain a dynamic equilibrium of H2S through a reversible reaction.9 Moreover, based on previous reports, S2− is the main component of lethal H2S toxicological effects.10 Consequently, it is reasonable to use the HS−/S2− concentration to represent the H2S concentration under physiological conditions.
To date, several methods for detecting H2S have been explored by researchers, including high-performance liquid chromatography (HPLC), colorimetry, fluorescent probe technology, and gas chromatography/mass spectrometry (GC/MS).9–13 HPLC and GC detection are the most widely used methods,10 but they required special equipment and professional operation, which may not meet the needs of family monitoring. Colorimetry is simple to operate, but its sensitivity is limited, and fluorescent probe technology has a similarly low detection range. Consequently, a convenient and highly sensitive H2S detection method remains to be explored.
Heterostructure nanoarrays are formed by the contact of two or more different chemical components, which form distinct heterointerfaces between them.14,15 The heterointerface has an important effect on electron transitions and coupling due to the interface potential barrier.16 Moreover, the height of the barrier is sensitive to changes in the carrier concentration—that is, even if the carrier concentration changes only slightly, the nanoarray's conductivity changes will be obvious. Consequently, heterostructure nanoarrays have attracted much attention because of their excellent electronic transport characteristics and good designability.17,18 Their composition, structure, and morphology can be designed based on the needs of specific applications, so as to achieve functional characteristics that cannot be achieved by each component alone.19,20 This provides a path for the convenient preparation of bio-H2S sensors with high detection accuracy and sensitivity ranges.
Meanwhile, semiconductor metal oxides have been widely studied in recent years because of their simple preparation methods, low cost, and good compatibility with other components.21–23 Heterostructure nanoarrays based on metal oxides can be constructed using targeted structural design techniques, giving full play to the characteristics of multiple components.24 To date, there have been many reported nanoarrays for detecting H2S based on such structures—for example, CuO nanotubes/In2S3 nanosheets,25 octahedral CuO/In2O3 mesocages,26 CuO/ZnO nanorods,27 and Cu2O/SnO2.28 As a typical P-type semiconductor, CuO/Cu2O has attracted extensive attention due to its unique performance. In addition to heterointerface conductance modulation, nanoarrays based on CuxO can also react with H2S to produce metallic CuxS, resulting in substantial changes in the conductivity of heterostructure nanoarrays, which contributes greatly to improving the detection range of sensors based on such nanoarrays.29 In addition. Co3O4 nanostructures have also been extensively studied in the field of nano- and micro-sensor components.30 However, efficient and controllable methods for the preparation of these heterostructure nanoarrays require further study.
The 2D electrodeposition in situ assembly method can effectively regulate the structural parameters of deposits by regulating the frequency, waveform, current density, and solution composition, proving it to be an effective method to prepare heterostructures with ideal electrical properties.31,32 However, for bio-H2S sensors based on metal oxide heterostructure nanoarrays, there are few reports on the physical and chemical process of H2S signal expression and the relationship between its structure and its rapid sensing performance reaction mechanism. Theoretical calculations (multi-level research) can be conducted on nanoarrays—at a micro-, mesoscopic and macro scale—to simulate the performance evolution and failure mechanisms of nanoarrays under service conditions, and realize the improvement of nanoarray performance and design.33–35
In this study, a bio-H2S sensor based on Cu2O/Co3O4 nanoarrays was successfully constructed using the electrodeposition in situ assembly method. The nanoarrays exhibited strict periodicity and long-range order, to realize both the interfacial conductance modulation and vulcanization reaction required for the sensor to achieve higher selectivity and sensitivity to bio-H2S. We measured the detection accuracy and sensitivity range of the sensing nanoarrays in detail, fully meeting the detection requirements of H2S concentration changes for related diseases. The physical and chemical process of H2S signal expression was explored through theoretical calculations, providing a theoretical basis for a better understanding of the relationship between the structure and sensing mechanism of the sensor.35 Moreover, we performed in vitro tests using blood, further verifying the reliability and practicality of our nanoarrays for home or clinical bio-H2S monitoring applications.
Experimental
Materials
The chemicals used in this experiment included Cu(NO3)2·3H2O, Co(NO3)2·6H2O, HNO3 Na2S·9H2O, citric acid, NaHSO3, KCl, bovine serum albumin (BSA), glutathione (GSH), Na2S2O3, NaHCO3, Na3C6H5O7·2H2O, cysteine (Cys), Vaseline, and anhydrous ethanol. HNO3 was purchased from Yantai Yuandong Fine Chemicals Co., Ltd. (China), KCl was purchased from Tianjin Bodi Chemical Co., Ltd. (China), anhydrous ethanol was purchased from Tianjin Hengxing Chemical Reagent Manufacturing Co., Ltd. (China), and other chemical reagents were purchased from Aladdin Industrial Corporation (Shanghai, China). All chemicals were used without further purification. Human blood samples were provided by Linyi People's Hospital (Linyi City, China). All experiments were conducted in accordance with the relevant laws of China, the hospital's usage guidelines and relevant regulations and standard procedures, and were approved by the Linyi University Ethics Committee (no. LYU20220103). Consent was obtained for any experimentation with human subjects. The substrate was a coverslip (18 × 18 mm), and the electrodes were pieces of copper foil (99.99%, 30 μm-thick).Synthesis of Cu2O/Co3O4 nanoarrays
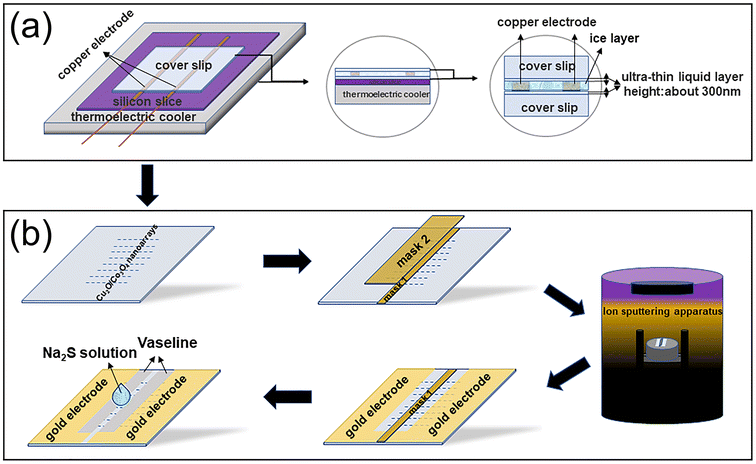
A 2D electrodeposition in situ assembly method similar to that in our previous reports36,37 was used to synthesize Cu2O/Co3O4 nanoarrays. The electrolytes were prepared by dissolving 0.5821 g Co(NO3)2 and 0.7248 g Cu(NO3)2 in 49.95 mL deionized water, after which 0.05 mL nitric acid (pH = 3) was added to the 49.95 mL electrolyte to adjust its pH.The nanoarray synthesis process is shown in Fig. 1(a). First, the silicon wafer is placed on the Peltier element at the bottom of the growth chamber as the reflector of an optical microscope to observe the real-time growth of the samples more clearly. A coverslip glass substrate is then placed on the silicon wafer, and two copper electrodes are placed in parallel on the coverslip. Afterwards, 25 μL electrolyte is dropped onto the coverslip between the two electrodes, and another coverslip is used to cover both electrodes. A low-temperature circulating water bath is used to control the temperature of the growth chamber to freeze the electrolyte, with an ultra-thin ice layer being formed between the two coverslips. Two ultra-thin concentrated electrolyte layers (deposition space, of approximately 300 nm thickness (ref. 36)) are formed between the two coverslips and the ice layer. A 700 mV DC voltage is first applied to the electrodes to induce nanoarray growth. After nanoarray growth for approximately 10 min, the applied voltage is switched to a semi-sine deposition voltage of 0.3 V, frequency of 0.8 Hz, and amplitude of 0.6 V for deposition. The total electrodeposition time is approximately 40 min. When the deposition process is complete, the two coverslip glass substrates are removed and washed with deionized water 2–3 times. Finally, strictly periodic and long-range ordered Cu2O/Co3O4 nanoarrays are attached to both coverslip glass substrates.
Fabrication and sensor measurement
The fabrication process of a sensor based on Cu2O/Co3O4 nanoarrays is shown in Fig. 1(b). Mask 1, with width 1 mm and length 18 mm, is first used to cover the nanoarrays, after which mask 2, with width 3 mm and length 15 mm, is used to cover mask 1 to ensure that redundant nanoarrays are left on both sides of mask 2 to connect the circuit. Au film electrodes are sputtered on both sides of mask 2 using a vacuum ion sputtering instrument to connect it to the test circuit. Next, mask 2 is removed. To eliminate errors caused by the conductivity of the solution itself, Vaseline, with width 1 mm and length 15 mm, is coated on both sides of mask 1 to prevent direct contact between the Au film electrodes and the solution. Finally, mask 1 is removed, completing the sensor fabrication process.It has been confirmed that the concentration of HS−/S2− can represent the concentration of H2S in blood.8 Consequently, citric acid can be used to adjust the pH of Na2S solutions with different concentrations to 7.4 to simulate the human blood environment. The sensor responses were recorded using a source meter (Fig. S1, ESI†). The response of the sensor can then be defined as R = (Ib − Ia)/Ia, where Ia and Ib are the sensor currents before and after the sensing test, respectively.
Characterization
The morphology and crystal nano-microstructure of the as-synthesized Cu2O/Co3O4 nanoarrays were characterized by scanning electron microscopy (SEM, EVO18, ZEISS, Germany), transmission electron microscopy (TEM, JEM-2200FS, JEOL, Tokyo, Japan), ultraviolet-visible spectrophotometry (UV-Vis, UV-1800, Shimadzu, Japan), and X-ray photoelectron spectroscopy (XPS, ESCALAB MKII, VG, UK). The sensor responses were recorded using a source meter (Model 2400, Keithley, USA).Results and discussion
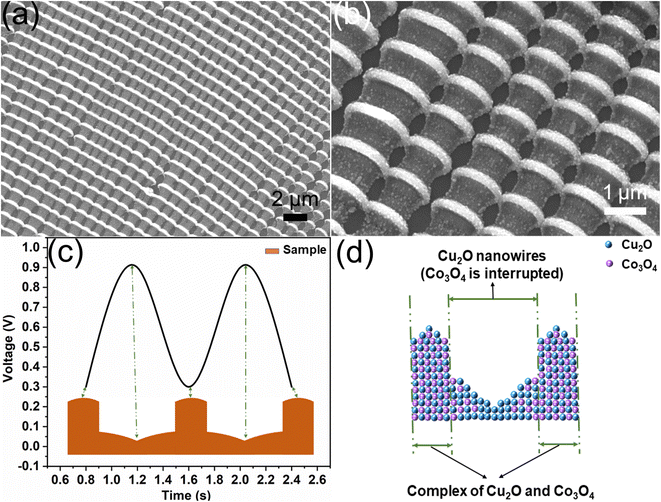
Fig. 2 shows the morphology and structure of Cu2O/Co3O4 nanoarrays prepared by the 2D electrodeposition in situ assembly method, Fig. 2(a) and (b) show SEM images of the nanoarrays. As can be seen from Fig. 2(a), the nanoarrays show favorable periodicity and long-range order, which is conducive to improving the controllability and practicability of the sensor. Fig. 2(b) shows that each cycle consists of a nanojunction and a nanowire, which is due to the semi-sine deposition potential used in the deposition process. The growth mechanism of nanoarrays is shown in Fig. 2(c), with the growth rate of the nanoarrays being dependent on the deposition potential. When the deposition potential is low, ions can migrate to the front of the sample in time. At this point, the migration rate is greater than the growth rate, so the nano-polycrystalline structure begins to accumulate on the substrate to form a wide nanojunction. However, when the deposition potential is high, the situation is the opposite, with the migration rate of ions in the ultra-thin liquid layer being less than the growth rate, and the nano-polycrystalline structure becoming narrow nanowires, which explains the formation of a periodic bamboo-like structure.Fig. 2(d) shows the distribution of Cu2O and Co3O4. When the deposition voltage is low, the concentration of Cu2+ and Co2+ and the migration speed under the action of an electric field are sufficient for both to accumulate at the front end of the sample to form a complex of Cu2O and Co3O4. As the deposition voltage rapidly increases, the ions have little time to respond to changes in the growth rate. Moreover, the concentration of Co2+ is less than that of Cu2+, so Cu2O can still grow continuously in the narrow nanowires, while the doping volume of Co3O4 decreases. In summary, Cu2O is continuously distributed throughout the nanoarrays, while Co3O4 is interrupted.
TEM was used to further explore the composition and structure of the Cu2O/Co3O4 nanoarrays. Fig. 3(a) shows TEM images that further confirm the bamboo-like structure of the nanoarrays. It can be seen from the inset that parts of the nanoarrays are composed of uniform and dense cubic nanoparticles (Cu2O).29,36 The HRTEM image shown in Fig. 3(b) shows the measured fringe spacing to be 0.245 nm and 0.47 nm corresponding to the (111) plane of Cu2O and the (111) plane of Co3O4, respectively, confirming the successful synthesis of the nanoarrays. Fig. 3(d–f) are local enlargements of Cu, Co, and O element distributions, respectively, corresponding to Fig. 3(c). Copper is continuously distributed in both the wide nanojunctions and narrow nanowires, while cobalt is noticeably sparser in the nanowires, further verifying the results in Fig. 2(d). Fig. 3(f) shows the O element distribution, the periodicity of which is consistent with that of the sample morphology.
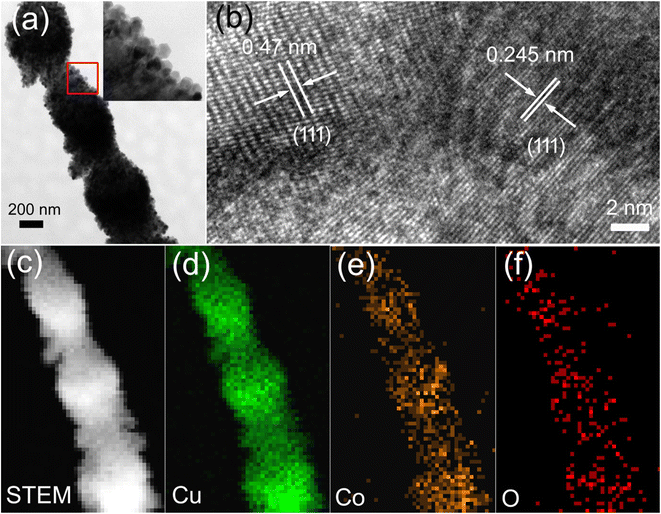 | ||
| Fig. 3 (a) TEM images of Cu2O/Co3O4 nanoarrays. (b) HRTEM images of nanoarrays. (c) STEM images of nanoarrays. (d–f) Element mapping of Cu, Co, and O corresponding to (c). | ||
The elemental chemical composition and valence state of Cu2O/Co3O4 nanoarrays were characterized by XPS. Fig. 4(a) shows the fine spectrum of Cu 2p. There are two main strong peaks at 952.3 and 932.5 eV, representing the 2p1/2 and 2p3/2 orbits of Cu+, respectively, while two weak peaks at 954.5 and 934.6 eV correspond to the 2p1/2 and 2p3/2 orbits of Cu2+, respectively. There are two weak satellite peaks which further confirm the existence of Cu in the form of Cu+, although there is a small amount of Cu2+ due to the natural oxidation of the nanoarrays in air at room temperature.38,39Fig. 4(b) shows the fine XPS spectrum of Co 2p. The peak at 796.1 eV of the Co 2p1/2 orbit can be clearly observed, as well as the peak at 779.9 eV of the Co 2p3/2 orbit. Moreover, there are two satellite peaks which further prove the formation of Co3O4.40,41 The fine spectrum of O 1s can be seen in Fig. 4(c). The stronger main peak—with a binding energy of 531.7 eV—is the surface adsorbed oxygen (OS), with the peak at 530.1 eV being assigned to the lattice oxygen (OL), as was the case in previous reports.42 It can be further confirmed that the nanoarrays are consistent with the expected structure and composition.
 | ||
| Fig. 4 XPS spectra of Cu2O/Co3O4 nanoarrays. (a–c) Are curve-fitting results of Cu 2p, Co 2p, and O 1s XPS spectra. | ||
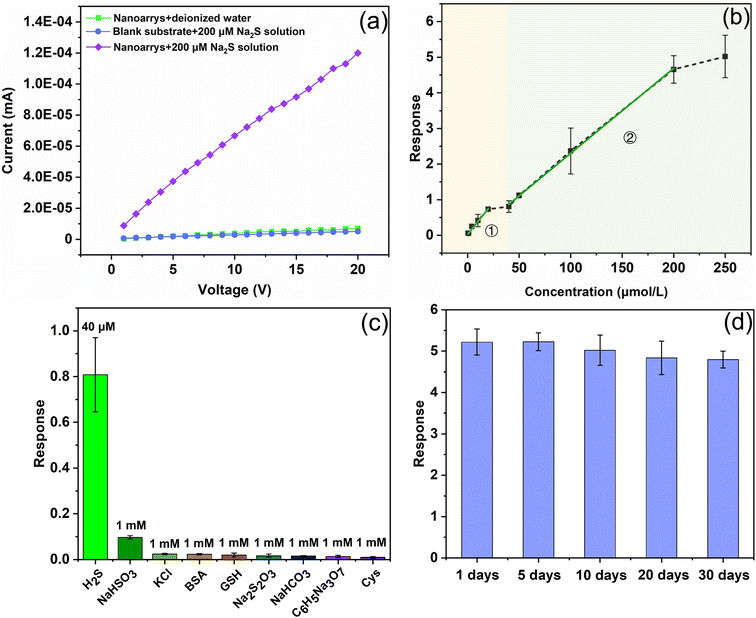
The performance of a sensor based on Cu2O/Co3O4 nanoarrays was systematically examined, as shown in Fig. 5, where Fig. 5(a) shows the conductivity of the 200 μmol L−1 Na2S solution as well as the sensor before and after reacting with Na2S. Through comparison, it is clear that the conductivity of the nanoarrays and solution is weak, which is beneficial for the response calculation as the conductivity of the sensor changes dramatically during the Na2S sensing test. For instance, by measuring the currents before and after the sensor reacts with Na2S at a bias voltage of 20 V, it can be seen that the currents increase from ∼10−6 mA to ∼10−4 mA, showing that the sensor has good sensitivity to H2S. Fig. 5(b) shows the relationship between the sensor response and the concentration of 0–250 μmol L−1 Na2S. The curve can be divided into two linear sections, the first section being in the range of 0.5–20 μmol L−1, before the curve flattens as the reaction reaches saturation, and the second section being in the range of 40–200 μmol L−1. Above 200 μmol L−1, the sensor response does not change dramatically, the response tending to saturate once again. It is worth noting that the sensor still has a reasonable response when the concentration of Na2S is 0.1 μmol L−1 (R = 0.55), meaning that the sensor has high detection accuracy for bio-H2S at room temperature. The comparison results between this work and previously reported bio-H2S sensors are summarized in Table 1. The Cu2O/Co3O4 nanoarrays exhibit quite excellent advantages for detecting bio-H2S.
| Electrode materials | Linear range (μM) | LOD (μM) | Methods | Portable real-time detection | Ref. |
|---|---|---|---|---|---|
| Escherichia coli/NPG/GCE bioelectrode | 50–5000 | 2500 | CV | × | 43 |
| Coated membrane | 1400 | Colorimetry | × | 44 | |
| Dinitro-functionalized Zr(IV) MOF | 14.14 | Fluorescence | × | 45 | |
| AE-AuNPs | 3–10 | 0.2 | Colorimetry | × | 46 |
| AuNPs/4-AA | 0.1 | Surface-enhanced Raman scattering | × | 47 | |
| Cu2O/Co3O4 nanoarrays | 0.5–200 | 0.1 | Amperometry | √ | This work |
To verify the selectivity of the Cu2O/Co3O4 nanoarrays, systematic studies were conducted, the results of which are shown in Fig. 5(c). The sensor exhibits a higher response to the 40 μmol L−1 Na2S solution even if other potentially interfering components take advantage of higher concentrations (1 mmol L−1)—the response of the sensor to NaHCO3 is 10.9% that of Na2S, while the response to other interference components (KCl, BSA, GSH, Na2S2O3, NaHCO3, Na3C6H5O7·2H2O, and Cys) is in the 0.7–2.4% Na2S range. The results show that a sensor based on Cu2O/Co3O4 nanoarrays has excellent selectivity for Na2S. Consequently, we can eliminate the interference of other factors when the sensor is used to detect the concentration of H2S in blood, ensuring the accuracy of the detection results. The stability of the sensor is a necessary feature to broaden its field of practical application. We placed the sensors in air at room temperature for 1, 5, 10, 20, and 30 days, before systematically evaluating their response to a 250 μmol L−1 Na2S solution. From Fig. 5(d), it is clear that the response of the sensors changes very little, indicating that sensors based on Cu2O/Co3O4 nanoarrays have excellent stability.
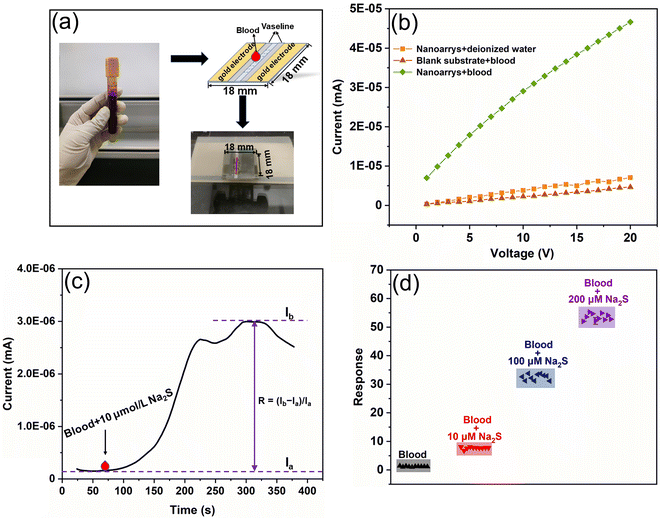
A series of experiments were conducted to further verify the feasibility of sensors based on Cu2O/Co3O4 nanoarrays for detecting H2S in blood, as shown in Fig. 6. Fig. 6(a) shows a diagram of the sensing element to detect blood. We tested the conductivity of the blood itself and the sensor performance before and after reacting with H2S in the blood (Fig. 6(b)). It is clear that the conductivity of the sensor after the blood test changes considerably compared to that of the blood and sensor itself, tested separately. For example, when the bias voltage is 5 V, the current of the blood and the sensor itself is in the range of 10−7 mA, the current of the sensor changes by two orders of magnitude to 10−5 mA after reacting with H2S in the blood. This proves that the sensor exhibits excellent sensitivity to the H2S in blood.
A Na2S solution of pH 7.4 was then added to the blood to simulate a change in H2S concentration in a pathological state. The dynamic reaction of the sensor to blood with an additional 10 μmol L−1 Na2S is shown in Fig. 6(c). When 1 μL blood is dropped onto the sensor at 70 s, the sensor current increases sharply, with the response time being approximately 200 s. The current then reaches its maximum value, lasting for 50 s. After 340 s, the current decreases slightly. The sensor response to blood with different H2S concentrations is shown in Fig. 6(d), the elevated concentration of H2S being sufficient to cover the variation range of bio-H2S in human blood—the sensor response after the blood H2S concentration increases by 10, 100, and 200 μmol L−1 being 6, 27, and 44 times that of pure blood, respectively. Moreover, as shown in Fig. 5(b), the detection limit of the sensor is 0.1 μmol L−1, proving the sensor to be suitable for bio-H2S detection. This provides compelling evidence for the practical application of Cu2O/Co3O4 nanoarrays, which have a short response time, high detection accuracy, and large sensitivity detection range.
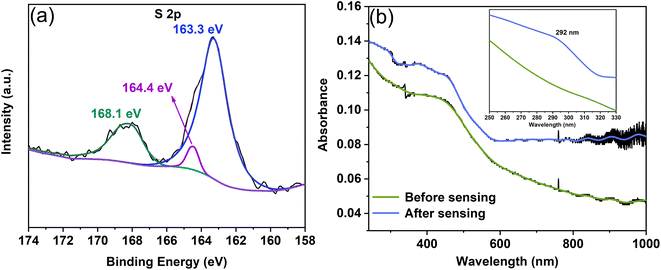
We explored the mechanism from a vulcanization reaction perspective using XPS and UV-vis spectrophotometry (Fig. 7). The S 2p spectrum produced from the vulcanization reaction between Cu2O/Co3O4 nanoarrays and Na2S solution in the absence of a bias voltage is shown in Fig. 7(a), with a binding energy of 163.3 and 164.4 eV corresponding to Cu2S48,49 and Co3S4 (ref. 50 and 51) respectively. The peak at 168.1 eV can be assigned to sulfates (SO42−, SO32−, and S2O32−),48,52 which are formed because of oxidation reactions caused by the high potential between sulfides and O2. Based on previous work,29,53 we found elemental sulfur to be generated after applying a bias voltage. Fig. 7(b) shows the UV-vis absorption spectrum of the Cu2O/Co3O4 nanoarrays before and after a bias voltage is applied. It is clear that the curve after applying a bias voltage has a characteristic peak at a wavelength of 292 nm, while the curve before applying a bias voltage is smooth at that point.
Based on previous literature,54,55 the absorption peak at 292 nm represents S nanoparticles, with the formation of elemental S being ascribed to the binding reaction of S2− with electrons when a bias voltage is applied. This provides evidence for the reduction of the Cu2S/Co3S4 nanoarrays and explains the decline of the I–t curve after 340 s, as shown in Fig. 6(c).
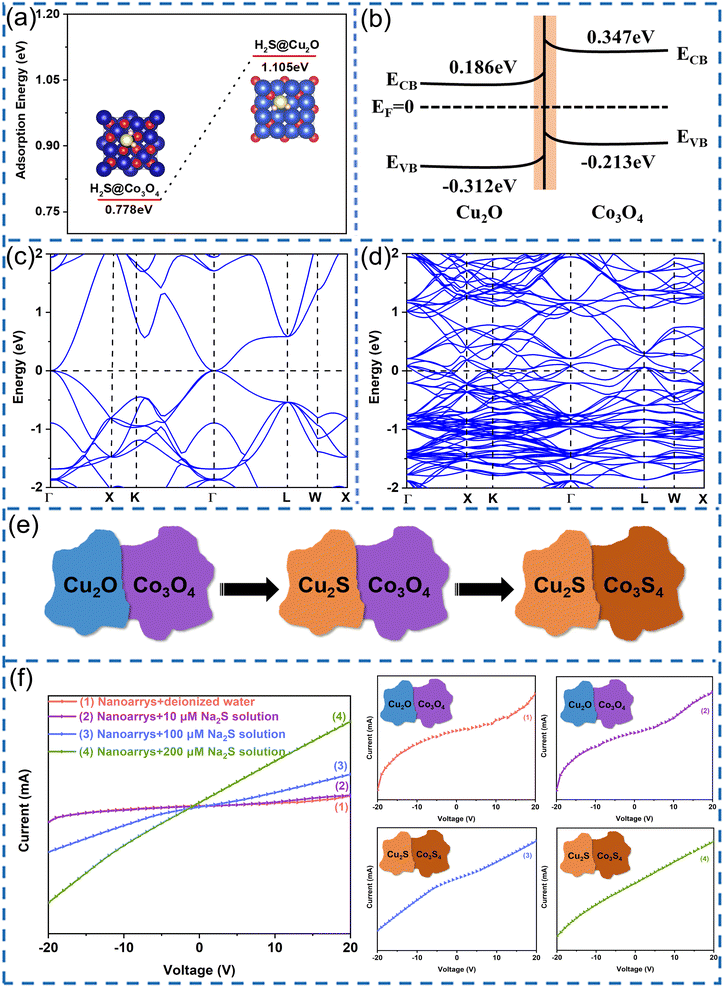
To further clarify the mechanism of the sensor's dramatically enhanced conductivity during the Na2S sensing test, we calculated the adsorption energy of Cu2O and Co3O4 for H2S as well as the band structures of Cu2S and Co3S4 based on first-principles calculations. Fig. 8(a) shows the adsorption energy of Cu2O and Co3O4 for H2S, with the adsorption energy of Cu2O for H2S being 1.105 eV, which is larger than that of Co3O4 for H2S (0.778 eV), indicating that H2S is more easily adsorbed on the Cu2O surface. Considering the band structures and band gaps of Cu2O and Co3O4, an energy band diagram of Cu2O and Co3O4 can be constructed, as shown in Fig. 8(b). When Cu2O and Co3O4 come into contact with each other, the electrons are transferred from Co3O4 to the lower energy conduction band of Cu2O to form the Fermi level. As a result, the energy bands bend and potential barriers are established near the interface between Cu2O and Co3O4, further confirming that Cu2S is easier to form than Co3S4. Based on these calculation results, Cu2O reacts with H2S prior to Co3O4 to form Cu2S, with Co3S4 forming later with sufficient H2S. Consequently, we can deduce the nanostructure evolution of Cu2O/Co3O4 nanoarrays during the reaction with H2S, as shown in Fig. 8(e).
Fig. 8(c) and (d) show the band structure of Cu2S and Co3S4, respectively. The band gap is 0 eV for both Cu2S and Co3S4, indicating Cu2S and Co3S4 to be metallic, whereas Cu2O and Co3O4 are semiconductors. Consequently, as shown in Fig. 8(e), we can determine that the change process of the interfacial barrier of nanoarrays is as follows: the p–p interfacial barrier of Cu2O–Co3O4 initially changes into a Schottky barrier of Cu2S–Co3O4, after which the ohmic contact of Cu2S–Co3S4 replaces the interfacial barrier. The carrier transport is extremely sensitive to the interfacial barrier. During the transition from a p–p heterojunction to a Schottky junction, the sensor conductivity progressively increases, corresponding to the first linear change shown in Fig. 5(b). When the H2S concentration increases to 40 μmol L−1 (Fig. 5(b)), the Cu2S and Co3S4 on the surface of the nanoarrays gradually increases to form a conductive channel, resulting in a dramatic increase in conductivity (the dominant mechanism of the second linear section shown in Fig. 5(b)). The increased rate of conductivity slows down after the concentration exceeds 200 μmol L−1, which can be explained by the fact that only the size and number of conductive channels change in the context of an adequate supply of H2S.
Fig. 8(f) shows the I–V curves of the sensor measured at different concentrations of Na2S solution. From I–V curves (1)–(4), the I–V characteristics change from nonlinear to linear with increasing Na2S concentration. The nonlinear relationships shown in I–V curves (1) and (2) verify the existence of the p–p heterojunction as well as the dominance of the interfacial conductance modulation, corresponding to the first linear section shown in Fig. 5(b). The linear characteristics shown in I–V curves (3) and (4) verify the gradual formation of metallic conductive channels on the surface of the nanoarrays, explaining the conductive mechanism of the second linear section of Fig. 5(b). The variation of the I–V characteristics is mutually supported by the theoretical calculation results.
Conclusions
In this study, we fabricated a sensor based on Cu2O/Co3O4 nanoarrays with high sensitivity to bio-H2S in blood. The sensor exhibited excellent rapid detection performance to bio-H2S, with a detection limit of 0.1 μmol L−1 and a response time of approximately 200 s. The high selectivity to bio-H2S, strong anti-interference to other components, and long-term stability within 30 days of the sensor were all verified. Moreover, the reliability of the sensor's application in actual disease detection was successfully demonstrated using a human blood test in vitro. Based on XPS and first-principles calculations, we analyzed the reaction process of the sensor to the rapid response of bio-H2S and proposed a physical analysis model of interfacial conductance modulation. We believe that this work provides new ideas for the design and device development of functional materials that respond quickly to biomarkers.Conflicts of interest
There are no conflicts to declare.Acknowledgements
This work was supported by the Natural Science Foundation of Shandong Province (ZR2022MA023, ZR2022MF342, and ZR2021QA055) and National Natural Science Foundation of China (No. 11704168 and 11404158). We thank Shiyanjia Lab (https://www.shiyanjia.com) for the XPS analysis and linguistic assistance during the preparation of this manuscript.Notes and references
- A. Corvino, V. Citi, F. Fiorino, F. Frecentese, E. Magli, E. Perissutti, V. Santagada, V. Calderone, A. Martelli, E. Gorica, S. Brogi, F. F. Colombo, C. N. Capello, H. H. Araujo Ferreira, M. G. Rimoli, F. Sodano, B. Rolando, F. Pavese, A. Petti, M. N. Muscara, G. Caliendo and B. Severino, J. Adv. Res., 2022, 35, 267–277 CrossRef CAS PubMed.
- Y. Li, Y. Feng, L. Liu, X. Li, X. Y. Li, X. Sun, K. X. Li, R. R. Zha, H. D. Wang, M. D. Zhang, X. X. Fan, D. Wu, Y. Fan, H. C. Zhang, G. F. Qiao and B. Y. Li, Acta Pharmacol. Sin., 2021, 42, 898–908 CrossRef CAS PubMed.
- X. Lu, H. Zhu, Y. Chen, Y. Wu, D. Zhang, B. Zhu and S. Huang, Sci. Rep., 2021, 11, 20156 CrossRef CAS PubMed.
- R. Montanaro, A. D'Addona, A. Izzo, C. Ruosi and V. Brancaleone, Sci. Rep., 2021, 11, 14811 CrossRef CAS PubMed.
- J. Wu, Z. Tian, Y. Sun, C. Lu, N. Liu, Z. Gao, L. Zhang, S. Dong, F. Yang, X. Zhong, C. Xu, F. Lu and W. Zhang, Cell Death Discovery, 2017, 8, e2992 CrossRef CAS PubMed.
- A. Xiao, H. Wang, X. Lu, J. Zhu, D. Huang, T. Xu, J. Guo, C. Liu and J. Li, Sci. Rep., 2015, 5, 16086 CrossRef CAS PubMed.
- M. Yao, Y. Lu, L. Shi, Y. Huang, Q. Zhang, J. Tan, P. Hu, J. Zhang, G. Luo and N. Zhang, Bioact. Mater., 2022, 9, 168–182 CrossRef CAS PubMed.
- V. Saini, K. C. Chinta, V. P. Reddy, J. N. Glasgow, A. Stein, D. A. Lamprecht, M. A. Rahman, J. S. Mackenzie, B. E. Truebody, J. H. Adamson, T. T. R. Kunota, S. M. Bailey, D. R. Moellering, J. R. Lancaster Jr and A. J. C. Steyn, Nat. Commun., 2020, 11, 557 CrossRef CAS PubMed.
- Y. Ding, X. Li, C. Chen, J. Ling, W. Li, Y. Guo, J. Yan, L. Zha and J. Cai, Sci. Rep., 2017, 7, 9638 CrossRef PubMed.
- D. Zhao, J. Zhang, M. Zhou, H. Zhou, C. Gotor, L. C. Romero, J. Shen, X. Yuan and Y. Xie, Plant Physiol. Biochem., 2020, 155, 367–373 CrossRef CAS PubMed.
- B. D. Paul and S. H. Snyder, Nat. Rev. Mol. Cell Biol., 2012, 13, 499–507 CrossRef CAS PubMed.
- N. M. Vuong, N. D. Chinh, B. T. Huy and Y. I. Lee, Sci. Rep., 2016, 6, 26736 CrossRef PubMed.
- X. Han, C. Gu, Y. Ding, J. Yu, K. Li, D. Zhao and B. Chen, ACS Appl. Mater. Interfaces, 2021, 13, 20371–20379 CrossRef CAS PubMed.
- H. Zheng, Y. Li, H. Liu, X. Yin and Y. Li, Chem. Soc. Rev., 2011, 40, 4506–4524 RSC.
- H. Wang, W. Fu, X. Yang, Z. Huang, J. Li, H. Zhang and Y. Wang, J. Mater. Chem. A, 2020, 8, 6926–6956 RSC.
- K. Nagashio, Semicond. Sci. Technol., 2020, 35, 103003 CrossRef CAS.
- T.-Y. Eom, M. Cho, K.-Y. Song, J.-S. Park and H.-J. Lee, Sens. Actuators, B, 2022, 356, 131377 CrossRef CAS.
- P. Wang, T. Song, G. Gao, K. Matras-Postolek and P. Yang, Sens. Actuators, B, 2022, 357, 131433 CrossRef CAS.
- Y. Lv, S. Duan and R. Wang, Prog. Nat. Sci.: Mater. Int., 2020, 30, 1–12 CrossRef CAS.
- M. J. Wang, X. Zheng, L. Song, X. Feng, Q. Liao, J. Li, L. Li and Z. Wei, J. Mater. Chem. A, 2020, 8, 14145–14151 RSC.
- J. Wang, T. Fu, F. Meng, D. Zhao, S. S. C. Chuang and Z. Li, Appl. Catal., B, 2022, 303, 120890 CrossRef CAS.
- J. Huang, H. Sheng, R. D. Ross, J. Han, X. Wang, B. Song and S. Jin, Nat. Commun., 2021, 12, 3036 CrossRef CAS PubMed.
- Z. Yang, W. Cao, C. Peng, T. Wang, B. Li, H. Ma, Y. Su, Z. Zhou, J. Yang and M. Zeng, IEEE Sens. J., 2021, 21, 11023–11030 CAS.
- C. Su, L. Zhang, Y. Han, C. Ren, B. Li, T. Wang, M. Zeng, Y. Su, N. Hu, Z. Zhou, Y. Wang, Z. Yang and L. Xu, Sens. Actuators, B, 2021, 329, 129167 CrossRef CAS.
- W. Zhang, X. Wang, Z. Fan, J. Li, G. Liu, X. Lv, B. Li, J. Zhou, E. Xie and Z. Zhang, ACS Appl. Mater. Interfaces, 2021, 13, 44 Search PubMed.
- X. Li, C. Shao, D. Lu, G. Lu, X. Li and Y. Liu, ACS Appl. Mater. Interfaces, 2017, 9, 44632–44640 CrossRef CAS PubMed.
- J. Kim, W. Kim and K. Yong, J. Phys. Chem. C, 2012, 116, 15682–15691 CrossRef CAS.
- G. Cui, C. Xiao, P. Zhang and M. Zhang, Phys. Chem. Chem. Phys., 2016, 18, 10918–10923 RSC.
- P. Zhang, H. Zhu, K. Xue, L. Chen, C. Shi, D. Wang, J. Li, X. Wang and G. Cui, RSC Adv., 2020, 10, 8332–8339 RSC.
- X. Chen, S. Wang, C. Su, Y. Han, C. Zou, M. Zeng, N. Hu, Y. Su, Z. zhou and Z. Yang, Sens. Actuators, B, 2020, 305, 127393 CrossRef CAS.
- B. Dong, W. Liu, Y. Zhang, W. Banthukul, Y. Zhao, T. Zhang, Y. Fan and X. Li, J. Nat. Gas Sci. Eng., 2020, 80, 103371 CrossRef CAS.
- L. Han, J. Lin, J. Liu, E. Fahrenkrug, Y. Guan, K. Sun, Y. Wang, K. Liu, Z. Wang, Z. Wang, S. Qu and P. Jin, Nano Lett., 2021, 21, 5931–5937 CrossRef CAS PubMed.
- E. S. Penev, N. Marzari and B. I. Yakobson, ACS Nano, 2021, 15, 5959–5976 CrossRef CAS PubMed.
- X. Yu, J. Xie, Q. Liu, H. Dong and Y. Li, J. Colloid Interface Sci., 2021, 593, 133–141 CrossRef CAS PubMed.
- Y. Zeng, S. Lin, D. Gu and X. Li, Nanomaterials, 2018, 8, 851 CrossRef PubMed.
- G. Cui, P. Zhang, L. Chen, X. Wang, J. Li, C. Shi and D. Wang, Sci. Rep., 2017, 7, 43887 CrossRef PubMed.
- H. Sun, M. Cao, P. Zhang, X. Tian, M. Lu, L. Du, K. Xue and G. Cui, ACS Sens., 2022, 7, 1903–1911 CrossRef CAS PubMed.
- M. Waqas, L. Wu, H. Tang, C. Liu, Y. Fan, Z. Jiang, X. Wang, J. Zhong and W. Chen, ACS Appl. Nano Mater., 2020, 3, 4788–4798 CrossRef CAS.
- Q. Zhao, K. Wang, J. Wang, Y. Guo, A. Yoshida, A. Abudula and G. Guan, ACS Appl. Nano Mater., 2019, 2, 2706–2712 CrossRef CAS.
- Y. Wang, Y. Lei, J. Li, L. Gu, H. Yuan and D. Xiao, ACS Appl. Mater. Interfaces, 2014, 6, 6739–6747 CrossRef CAS PubMed.
- H. Zhu, K. Li, M. Chen and F. Wang, Int. J. Hydrogen Energy, 2017, 42, 25960–25968 CrossRef CAS.
- Y. Sun, P. Li, Y. Zhu, X. Zhu, Y. Zhang, M. Liu and Y. Liu, Biosens. Bioelectron., 2021, 194, 113600 CrossRef CAS PubMed.
- Z. Liu, H. Ma, H. Sun, R. Gao, H. Liu, X. Wang, P. Xu and L. Xun, Biosens. Bioelectron., 2017, 98, 29–35 CrossRef CAS PubMed.
- J. Lee, Y. J. Lee, Y. J. Ahn, S. Choi and G.-J. Lee, Sens. Actuators, B, 2018, 256, 828–834 CrossRef CAS.
- S. Nandi, S. Banesh, V. Trivedi and S. Biswas, Analyst, 2018, 143, 1482–1491 RSC.
- Z. Yuan, F. Lu, M. Peng, C.-W. Wang, Y.-T. Tseng, Y. Du, N. Cai, C.-W. Lien, H.-T. Chang, Y. He and E. S. Yeung, Anal. Chem., 2015, 87, 7267–7273 CrossRef CAS PubMed.
- D.-W. Li, L.-L. Qu, K. Hu, Y.-T. Long and H. Tian, Angew. Chem., Int. Ed., 2015, 54, 12758–12761 CrossRef CAS PubMed.
- Q. Zhou, T.-T. Li, J. Wang, F. Guo and Y.-Q. Zheng, Electrochim. Acta, 2019, 296, 1035–1041 CrossRef CAS.
- X. Guan, X. Sun, H. Feng, J. Zhang, H. Wen, W. Tian, D. Zheng and Y. Yao, Chem. Commun., 2020, 56, 13571–13574 RSC.
- Y. S. Park, J. H. Lee, M. J. Jang, J. Jeong, S. M. Park, W.-S. Choi, Y. Kim, J. Yang and S. M. Choi, Int. J. Hydrogen Energy, 2020, 45, 36–45 CrossRef CAS.
- A. T. Aqueel Ahmed, A. S. Ansari, H. Kim and H. Im, Int. J. Energy Res., 2021, 46, 5315–5329 CrossRef.
- Z. Xu, J. Xu and Y. Li, Appl. Organomet. Chem., 2021, 35, e6349 CAS.
- P. Zhang, W. Di, K. Xue and G. Cui, Sens. Actuators, A, 2021, 331, 113001 CrossRef CAS.
- S. M. Kim, S. Roy, K. S. Yoon and J. W. Rhim, Packag. Technol. Sci., 2021, 34, 505–516 CrossRef CAS.
- P. Paralikar and M. Rai, IET Nanobiotechnol., 2017, 12, 25–31 CrossRef.
Footnotes |
| † Electronic supplementary information (ESI) available. See DOI: https://doi.org/10.1039/d2na00865c |
| ‡ These authors contributed equally to this article. |
| This journal is © The Royal Society of Chemistry 2023 |

