 Open Access Article
Kilogram-scale fabrication of TiO2 nanoparticles modified with carbon dots with enhanced visible-light photocatalytic activity†
Jingjing
Xu‡
 a,
Jiayan
Zhang‡
 a,
Feifei
Tao
 *ab,
Pengfei
Liang
 a and
Pingan
Zhang
 a
a
aDepartment of Chemistry and Chemical Engineering, Shaoxing University, Zhejiang 312000, P. R. China. E-mail: feifeitao@usx.edu.cn
bShanghai Advanced Research Institute, Chinese Academy of Sciences, Shanghai 201210, P. R. China
First published on 21st March 2023
Abstract
Incorrect discharge of dye wastewater will cause environment pollution and be very harmful to human health. Visible-light photocatalysis over large-scale synthesized semiconductor materials can become one of the feasible solutions for the practical application of purifying dye wastewater. As a new candidate, carbon dots (CDs) with unique fluorescence were fabricated on a tens of grams scale and then further applied to the kilogram-scale synthesis of a CDs/TiO2 composite by one-step heat treatment. Compared with single TiO2 nanoparticles (NPs), the CDs/TiO2 composite with a large specific surface area exhibits enhanced photo-degradation performance for methyl orange (MO). This phenomenon can be attributed to the loading of CDs in the TiO2 NPs, which is conducive to broadening the light absorption spectrum and improving absorption intensity, narrowing the band gap, charge carrier trapping, up-converting properties, and charge separation. The kilogram-scale synthesis of the CDs/TiO2 photocatalyst does not affect the morphology, structure, optical properties and photocatalytic performance of the composite, which opens up a new avenue to construct elaborate heterostructures for enhanced photocatalytic performance using visible light as the light source.
1. Introduction
In the face of rapid industrial growth, the crisis caused by energy shortage and environmental deterioration has become one of the most critical issues and has threatened the sustainable development of mankind in recent years.1,2 The alarming discharge of organic dye contaminants from the textile industry has brought about serious water pollution, which affects the natural environment and seriously harms human health.3–5 In order to solve these problems, various technologies, such as physical adsorption,6 membrane filtration,7 biodegradation,8 Fenton processes,9 electrochemical methods10 and photocatalytic degradation,11 are applied to get rid of organic dye pollutants in wastewater. Among them, visible-light photocatalysis over semiconductors is an economic, efficient and sustainable method, because it can make the best of renewable and clean solar energy to remove organic pollutants in wastewater.12,13 Although many achievements have been made in visible-light photocatalysis, the practical application of large-scale photocatalytic materials with excellent activity and stability is still not realized, which involves complex and expensive synthesis. Therefore, it is urgently needed to develop scalable and facile synthesis of photocatalysts with efficient visible-light utilization and long-term stability.The facile synthesis of photocatalytic materials is crucial to obtain excellent photocatalytic performance.14 Nowadays, many semiconductors with micro- and nano-structures have been prepared to act as photocatalysts, including TiO2,15 ZnO,16 Fe2O3,17 SnO2,18 Co3O4,19 and so on. Among them, TiO2 is considered as the most widely studied semiconductor with many characteristics including low cost, non-toxicity, excellent photocatalytic properties and stability.20,21 However, TiO2 also has some shortcomings of a large band gap (∼3.2 eV) and the fast recombination of photo-excited charge carriers. These seriously restrict the use of solar energy and the improvement of photocatalytic properties.22 To solve the above problems, a large number of solutions have been reported including controlling morphologies,23,24 doping25 and constructing semiconductor composites.26 Among them, the modification of carbonaceous materials in TiO2 may be a feasible method to obtain visible-light photocatalysts.
Carbon dots (CDs) as a new type of fluorescent carbon nanomaterial have the characteristics of non-toxicity, low cost, a wide source of raw materials and good biocompatibility.27 Therefore, CDs display broad application prospects in many fields, such as biology,28 optoelectronics29 and photocatalysis.30 CDs not only have the fluorescence characteristics of traditional quantum dots, such as emitting fluorescent light, controlling excitation and emission wavelengths and up-conversion luminescence, but also serve as electron donors and acceptors.31,32 Coupling CDs with other semiconductors can be used to broaden the absorption spectrum, promote the charge separation and transfer, and enhance the photocatalytic activity.33–35 However, the low-cost and efficient preparation of CDs is scarce, which limits the large-scale synthesis of CD-based photocatalysts and practical application in photocatalysis. Therefore, it is urgent to explore a feasible large-scale route to design a CDs/TiO2 composite with a broadened light response range and enhanced photocatalytic properties.
In this paper, glucose was used for the large-scale preparation of CDs, and the kilogram-scale synthesis of CDs/TiO2 composites was realized by a simple heat treatment method. Due to the unique up-conversion of CDs, the interfacial interaction and the narrowed band gap, the kilogram-scale CDs/TiO2 composites exhibit superior photocatalytic properties when irradiated with visible light and excellent stability for the degradation of methyl orange (MO).
2. Experimental
2.1 Synthesis
2.2 Characterization
The morphologies, structures and lattice fringes were detected by using a scanning electron microscope (SEM, JSM-6360 LV) and high resolution transmission electron microscope (HRTEM, JEM-2100F). The chemical composition was detected via energy dispersive X-ray spectroscopy (EDS) analysis and elemental mapping. The crystal structure was characterized by powder X-ray diffraction (XRD, Empyrean XRD-6000, Cu Kα radiation, and λ = 0.15406 nm). The functional groups were measured by Fourier transform infrared spectroscopy (FT-IR, VERTEX70) and Raman spectroscopy on a Horiba LabRAM HR Evolution with a 632.8 nm laser. N2 adsorption–desorption isotherms were obtained on a TriStar 3020. X-ray photoelectron spectra (XPS) were collected on a Physical Electronics PHI 1600 ESCA system (monochromatic Al Kα source, 1486.6 eV). Ultraviolet visible (UV-vis) spectra and photoluminescence (PL) curves were recorded on a UV-2550 and F-7000, respectively. Time-resolved photoluminescence (TRPL) spectra were recorded on a FluoTime 300 (picoQuant GmbH) using a laser of 405 nm. The surface photovoltage (SPV) spectra were obtained on a home-built apparatus including a source for monochromatic light, a double-grating monochromator (Zolix SP500), a lock-in amplifier (SR830-DSP) and an optical chopper (SR540) at a testing frequency of 24 Hz.2.3 Photoelectrochemical measurements
The photoelectrochemical performance was characterized on an electrochemical analyser (CHI 760E, Shanghai Chenhua, China) with a 300 W xenon lamp (λ > 420 nm). An Ag/AgCl electrode (saturated KCl) and platinum foil were used as the reference electrode and counter electrode, and 0.5 M Na2SO4 aqueous solution as the electrolyte solution. After ultrasonic cleaning with acetone and deionized water in turn, the F-doped tin oxide (FTO) glass was placed under an infrared lamp to dry. The catalyst was put in absolute ethanol to make the slurry (1.0 g L−1) by sonication for at least 30 min. 0.1 mL of the above slurry was coated on the conductive surface of the cleaned FTO glass. After natural drying in air, the modified FTO glass was treated at 300 °C for 1 h to construct the working electrode with an active area of 0.196 cm2.2.4 Photocatalytic degradation
The photocatalyst (30 mg) was added to the MO aqueous solution (30 mL and 10 mg L−1) under the action of ultrasound. After stirring in the dark for at least 30 min, the suspension was irradiated with a 300 W xenon lamp (λ > 420 nm). A certain amount of the reaction mixture was sampled every once in a while and centrifuged. The supernatant was measured at the maximum absorption of MO on a UV-vis spectrometer (UV-2550) to evaluate the MO removal. The stability was determined in 5 cycles of photocatalytic tests. After each photocatalytic reaction, the sample was washed with plenty of deionized water and dried at 60 °C for the next cycle.2.5 Active species trapping experiments
To determine the active species, tert-butyl alcohol (TBA), benzoquinone (BQ) and disodium ethylenediaminetetraacetate dehydrate (EDTA-2Na) at the same concentration of 1.0 mmol L−1 were used as a scavenger to detect hydroxyl radicals (·OH), superoxide radicals (·O2−) and photo-generated holes (h+), respectively. The experiment was similar to the MO photocatalytic test.To detect the ·O2− amount during the photocatalytic process, 20 mg of photocatalyst was added to 50 mL of nitroblue tetrazolium (NBT) solution (2.5 × 10⁻⁵ mol L−1) under ultrasonication. The concentration of NBT was evaluated by recording the maximum absorption peak of NBT at 259 nm on a UV-2550 UV-vis spectrophotometer.36 The generated ·OH radicals were determined by using a terephthalic acid (TA) probe molecule on a Fluoromax-3 spectrometer. In detail, the photocatalyst (20 mg) was added to TA solution (50 mL, 5 × 10⁻⁴ mol L−1 in 2 × 10⁻³ mol L−1 NaOH). The 2-hydroxyterephthalic acid (2-TAOH) from the reaction of TA and ·OH has a characteristic fluorescence emission of about 425 nm at the 300 nm excitation wavelength.36
3. Results and discussion
3.1 Structure, composition and morphology
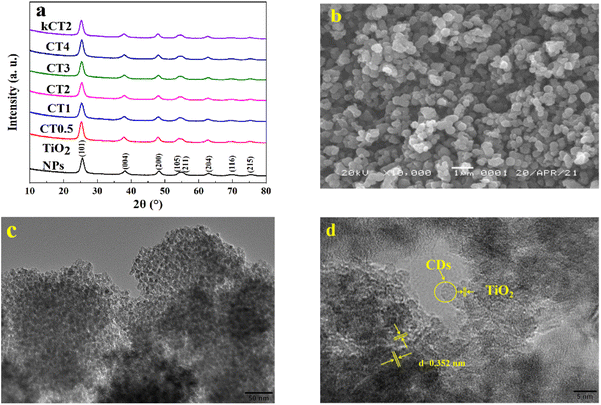
The TiO2 NPs and the CDs/TiO2 composites were investigated by using XRD patterns in Fig. 1a. For TiO2 NPs, the diffraction peaks at 25.4°, 37.8°, 48.1°, 54.0°, 55.2°, 62.4°, 69.3° and 75.5° coincide well with the (101), (004), (200), (105), (211), (204), (116) and (215) crystal planes of typical anatase TiO2 (JCPDS card no. 21-1272).37 All the CDs/TiO2 composites including kCT2 display the XRD curves similar to TiO2 NPs, implying no effect of the modification of CDs on the original crystal structure of TiO2 NPs. The diffraction peaks assigned to CDs couldn't be found in the XRD curves of all the composites, which may be ascribed to the amorphous features and/or the low content of CDs.The SEM and HRTEM images in Fig. S1† and 1b are used to explore the morphologies of TiO2 NPs, CDs and the CDs/TiO2 sample. The as-prepared TiO2 sample has a sphere-like structure with a uniform size of 200–400 nm (Fig. S1a†). According to the further HRTEM observation (Fig. S1b†), the spherical morphology is composed of a large number of nanoparticles of about 5–10 nm. These nanoparticles agglomerate with each other, leading to low dispersion. In Fig. S1c,† there are a large number of obvious lattice fringes of d = 0.352 nm that belong to the (101) crystal plane of anatase TiO2.38,39 The HRTEM image shows that the CDs with a diameter of 2–5 nm are well monodispersed and have a nearly spherical shape (Fig. S1d†). At the same time, the absence of lattice fringes indicates the poor crystallinity of the CDs. It is observed from the SEM image (Fig. 1b) that CT2 has a similar sphere-like morphology and size to TiO2 NPs, suggesting that the modification of CDs doesn't destroy the original shape of TiO2 NPs. And the CT2 sample is also composed of a large number of TiO2 NPs and CDs (Fig. 1c and d). The introduction of CDs into TiO2 NPs can help to inhibit the agglomeration of TiO2 NPs. According to the obvious lattice fringes (d = 0.352 nm) attributed to the (101) crystal plane of TiO2,38,39 it is proved that TiO2 NPs and CDs are intertwined with each other, implying the existence of interaction at their interface.40 Meanwhile, Fig. S2† shows the SEM and HRTEM images of kCT2, which has a similar morphology to CT2. The optical photo of kCT2 indicates the kilogram-scale synthesis of CT2, confirming that the method can realize the kilogram-scale preparation of the photocatalyst. Combined with the XRD result, it is found that the amplification of the synthesis reaction doesn't destroy the shape and crystal structure of the products. This facile method to obtain the CDs/TiO2 composite on a large scale provides a promising path for massive applications of photocatalysts.
The CDs/TiO2 composite synthesized on the kilogram scale (kCT2) was further investigated by EDS and elemental mapping (Fig. S3†). The EDS result confirms that the kCT2 consists of Ti, O and C elements, and the carbon content is 1.98 wt%. This value is very consistent with the addition amount of CDs of 2.0 wt% in the preparation process, suggesting that there is almost no less of CDs in the synthesis of kCT2. It is further confirmed by the elemental mapping diagrams that all elements are evenly distributed and CDs are uniformly dispersed in the TiO2 NPs, just like CT2 (Fig. 1c and d). Compared with Ti and O elements, the sparser distribution of C element proves the low content of CDs in kCT2 from the EDS result, which explains the absence of the XRD diffraction peak of CDs in the composites combined with weak crystallinity.
The HRTEM image clearly displays the porous features of the composite, which can be investigated by the BET measurement, as depicted in Fig. 2. The N2 adsorption–desorption curves of TiO2 NPs and kCT2 can be attributed to type IV isotherms with a H2 hysteresis loop in the relative pressure (P/P0) range of 0.4–0.7, implying mesoporous properties.41,42 The specific surface areas of TiO2 NPs and kCT2 are 162.85 and 185.78 m2 g−1, respectively. The higher specific surface area of kCT2 may be ascribed to the specific hierarchical structure and the modification of TiO2 NPs by CDs with a small size, which can effectively alleviate the aggregation of nanoparticles.43 It can be further observed in the insets of Fig. 2 that the pore size of TiO2 NPs and kCT2 is mainly concentrated at about 4.1 and 4.6 nm by the BJH method from the gas escape during the heat treatment. In addition, from the enlarged pore size distribution of kCT2, there is another type of pore at about 11 nm, possibly due to the loading of CDs. The modification of TiO2 NPs with CDs leads to a larger specific surface area and more pores, which generally favour adsorption and photocatalysis.44
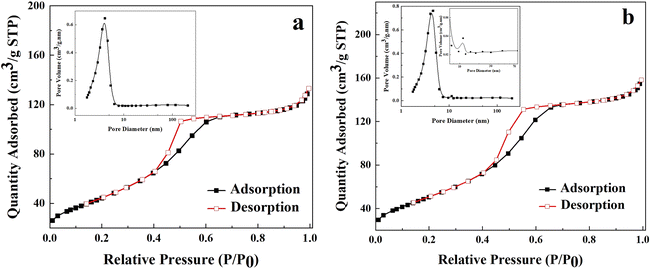 | ||
| Fig. 2 N2 adsorption–desorption curves and pore size distribution (inset) of TiO2 NPs (a) and kCT2 (b). | ||
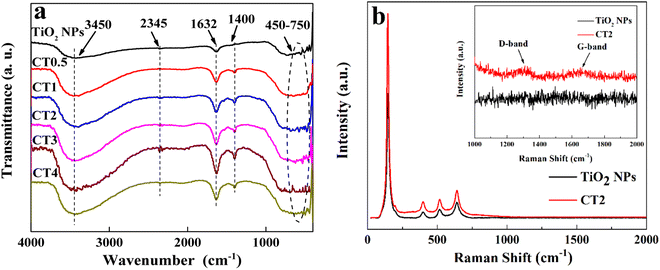
The surface functional groups of TiO2 NPs and CDs/TiO2 were further evaluated by FT-IR and Raman analyses (Fig. 3). For TiO2 NPs, the broad absorption at 450–750 cm−1 is assigned to the bending and stretching vibrations of the Ti–O–Ti bond.45–47 The absorption peaks at 1632 and 3450 cm−1 correspond to the bending vibration of the O–H group and the stretching vibration of hydrogen-bonded water molecules and adsorbed hydroxyl groups on the surface.48 The CDs/TiO2 composites display similar FT-IR curves and absorption bands to TiO2 NPs, suggesting that the addition of CDs in the samples causes no obvious damage to the surface functional groups of TiO2 NPs. The peaks at 2345 and 1400 cm−1 belonging to the stretching vibration of C![[double bond, length as m-dash]](https://www.rsc.org/images/entities/char_e001.gif) C (ref. 49) and C–O (ref. 37 and 50) can be found only in the composites and become stronger and slightly blue shift with the increase of the CD content, due to the existence of interaction between CDs and TiO2 NPs.50 In Fig. S4†, kCT2 shows a similar FT-IR spectrum to the CDs/TiO2 composites, suggesting that the CDs are successfully modified in TiO2 NPs and the amplification of the reaction has no effect on the surface functional groups of the composite. In addition, the effect of the modification of CDs on the surface composition and structures of TiO2 NPs was further investigated by Raman spectroscopy (Fig. 3b). TiO2 NPs clearly exhibit four characteristic bands at about 145, 399, 518 and 643 cm−1 corresponding to the anatase phase of TiO2.37,51 For CT2, the introduction of CDs into TiO2 NPs causes a slight blue shift of the peaks at about 518 and 643 cm−1, further confirming the existence of the interface interaction.40 Moreover, in addition to the anatase peaks of TiO2, there are two weak characteristic bands in CT2 corresponding to 1312 cm−1 (D-band) and 1620 cm−1 (G-band). The D-band is related to the vibration of carbon atoms with dangling bonds in the plane terminations of disordered graphite, and the G-band is indexed to the in-plane vibration of sp2 hybridized carbon atoms.37,40,52 Therefore, these results provide the evidence of existence of CDs in the composite.
C (ref. 49) and C–O (ref. 37 and 50) can be found only in the composites and become stronger and slightly blue shift with the increase of the CD content, due to the existence of interaction between CDs and TiO2 NPs.50 In Fig. S4†, kCT2 shows a similar FT-IR spectrum to the CDs/TiO2 composites, suggesting that the CDs are successfully modified in TiO2 NPs and the amplification of the reaction has no effect on the surface functional groups of the composite. In addition, the effect of the modification of CDs on the surface composition and structures of TiO2 NPs was further investigated by Raman spectroscopy (Fig. 3b). TiO2 NPs clearly exhibit four characteristic bands at about 145, 399, 518 and 643 cm−1 corresponding to the anatase phase of TiO2.37,51 For CT2, the introduction of CDs into TiO2 NPs causes a slight blue shift of the peaks at about 518 and 643 cm−1, further confirming the existence of the interface interaction.40 Moreover, in addition to the anatase peaks of TiO2, there are two weak characteristic bands in CT2 corresponding to 1312 cm−1 (D-band) and 1620 cm−1 (G-band). The D-band is related to the vibration of carbon atoms with dangling bonds in the plane terminations of disordered graphite, and the G-band is indexed to the in-plane vibration of sp2 hybridized carbon atoms.37,40,52 Therefore, these results provide the evidence of existence of CDs in the composite.
XPS measurement was conducted to further examine the chemical composition and bonding configuration of the photocatalyst. Based on the XPS survey spectra (Fig. 4a), both TiO2 NPs and CT2 contain Ti and O, and C element appears in CT2. The C element detected in TiO2 NPs might be due to adventitious hydrocarbon in the XPS instrument. According to the deconvolution spectrum of C 1s in Fig. 4b, CT2 displays four peaks at 282.6, 284.8, 286.3 and 288.6 eV, indicating different types of C states. The deconvoluted C 1s peak at 284.8 eV is assigned to C–C bonds in adventitious carbon and sp2-hybridized carbon from aromatic networks.53–55 The other C 1s peaks at 286.3 and 288.6 eV represent the oxygen bound species C–O and C![[double bond, length as m-dash]](https://www.rsc.org/images/entities/char_e001.gif) O,55,56 which provides the evidence that the carbon is incorporated into the lattice of TiO2 by substitution in the lattice of titanium sites or interstitial sites55,57 and oxidized to carbonate species during the heating treatment.54,55 And when the TiO2 NPs are modified with CDs, the C 1s peak at 282.6 eV is detected, indicating that the oxygen may be substituted in the lattice of TiO2 as the Ti–C bond.57–59 This strongly suggests the existence of the carbon in TiO2 from the binding energies of the electrons.58 In Fig. 4c, the Ti 2p peaks of TiO2 NPs at 458.7 and 464.4 eV are assigned to Ti 2p3/2 and Ti 2p1/2,56,60 due to spin-orbital doublet splitting, suggesting an oxidation state of Ti4+. And the slight red shift of Ti 2p peaks in CT2 suggests the coupling of TiO2 and carbon.59 For the O 1s spectrum of TiO2 NPs, the peaks at 529.7 and 531.6 eV belong to lattice oxygen (Ti–O) and absorbed oxygen (O–H), respectively.61 The higher peak at 533.4eV can be defined as the C–O bond,53,61 further confirming the existence of the CDs. Compared to TiO2 NPs, the location of oxygen element in CT2 is shifted slightly toward higher binding energy, which may be due to the increase of charge density from the substitution of titanium in the TiO2 lattice of CT2 by carbon atoms.55 The above results reveal that the CDs/TiO2 composite is composed of TiO2 and CDs, not their mechanical mixture, and contains various carbon species such as lattice carbons and substitutional and interstitial carbons, and the amplified synthesis has little effect on the chemical composition and bonding configuration of the composite.
O,55,56 which provides the evidence that the carbon is incorporated into the lattice of TiO2 by substitution in the lattice of titanium sites or interstitial sites55,57 and oxidized to carbonate species during the heating treatment.54,55 And when the TiO2 NPs are modified with CDs, the C 1s peak at 282.6 eV is detected, indicating that the oxygen may be substituted in the lattice of TiO2 as the Ti–C bond.57–59 This strongly suggests the existence of the carbon in TiO2 from the binding energies of the electrons.58 In Fig. 4c, the Ti 2p peaks of TiO2 NPs at 458.7 and 464.4 eV are assigned to Ti 2p3/2 and Ti 2p1/2,56,60 due to spin-orbital doublet splitting, suggesting an oxidation state of Ti4+. And the slight red shift of Ti 2p peaks in CT2 suggests the coupling of TiO2 and carbon.59 For the O 1s spectrum of TiO2 NPs, the peaks at 529.7 and 531.6 eV belong to lattice oxygen (Ti–O) and absorbed oxygen (O–H), respectively.61 The higher peak at 533.4eV can be defined as the C–O bond,53,61 further confirming the existence of the CDs. Compared to TiO2 NPs, the location of oxygen element in CT2 is shifted slightly toward higher binding energy, which may be due to the increase of charge density from the substitution of titanium in the TiO2 lattice of CT2 by carbon atoms.55 The above results reveal that the CDs/TiO2 composite is composed of TiO2 and CDs, not their mechanical mixture, and contains various carbon species such as lattice carbons and substitutional and interstitial carbons, and the amplified synthesis has little effect on the chemical composition and bonding configuration of the composite.
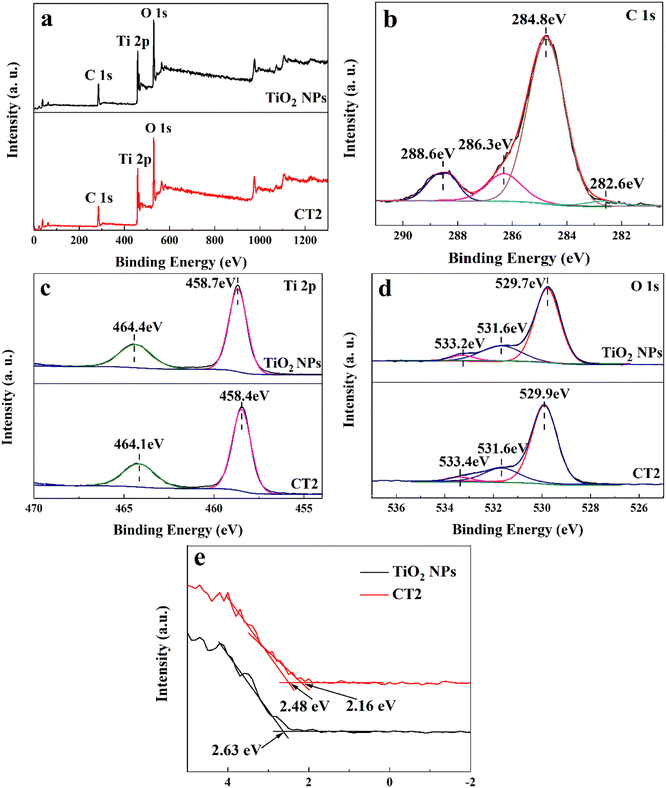 | ||
| Fig. 4 XPS survey spectra (a), the corresponding high-resolution XPS spectra (b–d) of C 1s (b), Ti 2p (c) and O 1s (d), and VB-XPS spectra (e) of TiO2 NPs and CT2. | ||
The electronic structures of TiO2 NPs and CT2 were further evaluated by VB-XPS (Fig. 4e). The binding energy of CT2 is smaller than that of TiO2 NPs and valence band (VB) tail states are observed only in CT2. This band tail phenomenon may be due to the strong electron withdrawing ability of the carboxylate groups, thereby causing additional diffusive electronic states above the VB edge and a narrowed band gap.55,62,63
3.2 Photocatalytic activity
The photocatalytic degradation of the MO solution was carried out over the CDs/TiO2 composites with a 300 W xenon lamp (λ > 420 nm). In control experiments (Fig. 5a), about 9.0% of MO over CT2 is removed without light. At an irradiation time of 120 min, the removal of MO is only 6.5% in the absence of the photocatalyst. The results of the above control experiments show that both the photocatalyst and illumination are essential for the removal of MO. When bare TiO2 NPs are used as the photocatalyst, about 12.4% of MO is removed under irradiation for 120 min. However, when CDs are loaded in TiO2 NPs, the removal efficiency of MO is surprisingly improved. And when the content of CDs increases, the removal of MO first goes up and then down. This may be attributed to the fact that the excess CDs in the composite could obstruct the reaction active sites or become a recombination centre, and instead inhibit the separation of charges.64 And the CT2 sample can remove 88.8% of MO, exhibiting the highest photocatalytic activity under irradiation of 120 min. Under the same photocatalytic conditions, 88.6% of MO over kCT2 can be removed, suggesting that the kilogram-scale synthesis of the composite will not reduce its catalytic activity. The above results indicate that the CDs/TiO2 composites can greatly degrade the MO solution irradiated with visible light, and the corresponding kinetics simulation was investigated as shown in Fig. 5b in a pseudo first-order Langmuir–Hinshelwood (L–H) mode.65,66 Apparently, the apparent first-order rate constant (Kapp) of the CDs/TiO2 composites obviously exceeds that of TiO2 NPs (Table 1). Moreover, the CT2 displays the largest Kapp of 0.0128 min−1, which is similar to that of kCT2 and 14.2 times that of TiO2 NPs.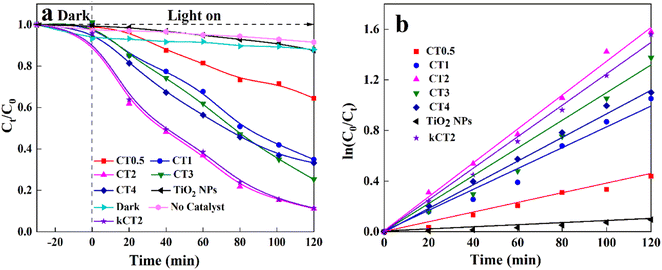 | ||
| Fig. 5 Photocatalytic activities of MO (a) and kinetic linear simulation for various photocatalysts (b). | ||
| Photocatalyst | TiO2 NPs | CT0.5 | CT1 | CT2 | CT3 | CT4 | kCT2 |
|---|---|---|---|---|---|---|---|
| K app (min−1) | 0.0009 | 0.0034 | 0.0065 | 0.0128 | 0.0096 | 0.0080 | 0.0127 |
In comparison to the as-obtained CDs/TiO2 composite, the photocatalytic performance of MO over the non-metallic coupled TiO2 photocatalysts is shown (Table S1†). Various non-metallic coupled TiO2 composites can promote the MO degradation under their own catalytic conditions. By comparison, the as-obtained CDs/TiO2 composites can exhibit satisfactory removal of MO, indicating their potential application in wastewater treatment.
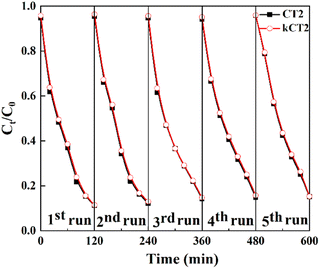
The photocatalytic stability test of the CDs/TiO2 sample is performed as shown in Fig. 6. After five consecutive runs, the MO solution can still be effectively removed over CT2 and kCT2. The photocatalytic removal of MO after five cycles still remains at 84.9% for CT2 and 84.7% for kCT2, close to 88.8 and 88.6% of the first removal rate of MO. The used kCT2 after five cycles still displays a crystal structure and morphology similar to the un-reacted one (Fig. S6†). Therefore, the CDs/TiO2 composites can act as a good and stable photocatalyst and exhibit potential to alleviate the pollution of industrial wastewater.
3.3 Photocatalytic mechanism
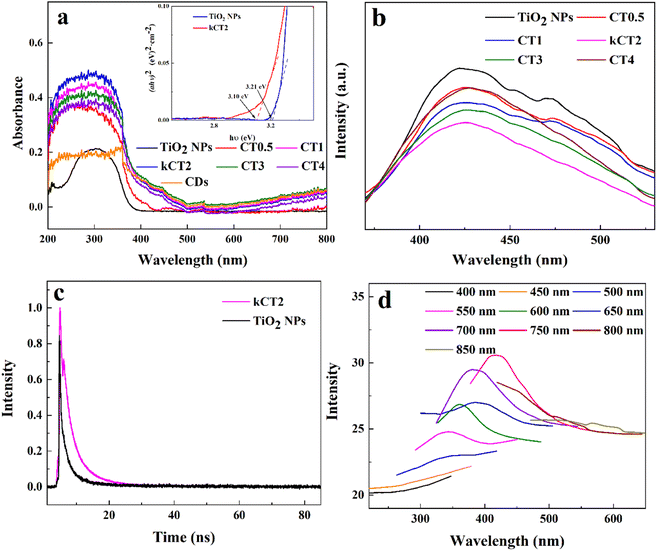
The kCT2 sample has a similar morphology, crystallinity, surface structure, chemical composition and photocatalytic performance to CT2, so kCT2 is used to make clear the photocatalytic mechanism of the MO degradation. Both the light absorption capacity and the charge separation are the key indicators for evaluating the photocatalytic performance.The light absorbance properties are usually characterized by UV-vis spectroscopy. TiO2 NPs exhibit the absorption of ultraviolet light in accordance with the intrinsic absorption properties of TiO2 (Fig. 7a).67 The CDs display significant absorption in the ultraviolet light region and the visible light region. When the CDs are introduced into TiO2 NPs, the CDs/TiO2 composites show UV-vis spectra similar to those of TiO2 NPs and CDs, but their light absorption intensity and range significantly exceed those of TiO2 NPs and CDs. Therefore, the existence of CDs can improve the visible-light photocatalysis of TiO2 NPs. Moreover, when the content of CDs increases, the absorption peak shows the intensity change of first increasing and then decreasing, and kCT2 displays the strongest light adsorption capability. This may be because TiO2 NPs are covered by too many CDs, leading to the formation of photoelectron recombination centers.68 Based on the calculation of the Kubelka–Munk formula from the Tauc plot,69 the band gap is measured to be 3.21 eV for TiO2 NPs and 3.10 eV for kCT2 (Fig. 7a inset). The introduction of CDs into TiO2 NPs decreases the band gap energy and enhances the visible-light absorption,70 possibly due to the existence of the interaction between TiO2 NPs and CDs,71 so as to promote visible-light photocatalysis.
The photoluminescence (PL) emission spectrum of the photocatalyst can be used to characterize the charge separation efficiency, and a lower PL intensity means a longer lifetime of charges.67,70 In Fig. 7b, the TiO2 NPs have a strong and broad PL response at about 425 nm, while the CDs/TiO2 composites display a very weak PL peak and kCT2 has the lowest PL intensity. This means that the CDs/TiO2 composites, especially kCT2, might have a long life of charges.70 This was further explored by time-resolved photoluminescence (TRPL) spectroscopy that can be applied to evaluate the electron transfer dynamics based on the emission lifetime (Fig. 7c).72,73 Generally speaking, a longer emission lifetime means a lower recombination of charges. Both TiO2 NPs and kCT2 exhibit an exponential decay fitted via bi-exponential function formula (1):
 | (1) |
 | (2) |
And the fitted lifetimes are listed in Table 2. The kCT2 sample shows a τave value (3.03 ns) higher than that of TiO2 NPs (2.35 ns) and its longer lifetime indicates that the charge recombination is inhibited.72
| Sample | τ 1 (ns) | τ 2 (ns) | τ ave (ns) |
|---|---|---|---|
| TiO2 NPs | 2.36 | 0.32 | 2.35 |
| kCT2 | 3.03 | 3.04 | 3.03 |
Up-conversion luminescence is considered a short wavelength emission by absorbing long wavelength light.5 The emission spectra of the gCDs were clearly detected under the excitation light of 400–850 nm (Fig. 7d). The emission of the gCDs becomes stronger with the increasing excitation of 400–750 nm and then weakens with excitation from 750 to 850 nm. It is surprisingly observed that the broad emission in the wavelength less than 400 nm can be produced at the excitation wavelength of 400–700 nm. The emission light may be further applied to excite TiO2 NPs to make more electrons jump to the conduction band (CB).32
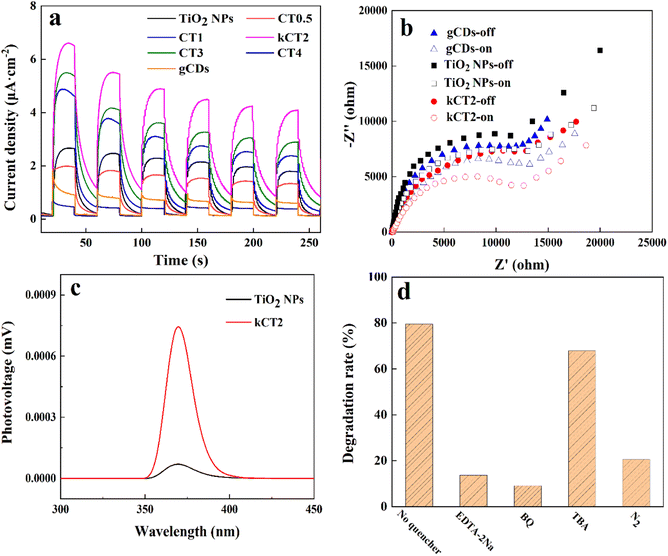
Photoelectrochemical tests were carried out to investigate the separation and transmission of charges. In Fig. 8a the transient photocurrent responses of various photocatalysts are clearly observed by switching the light source for many cycles. Compared with TiO2 NPs and gCDs, all the CDs/TiO2 composites display improved photocurrent responses when irradiated with visible light. This indicates that more electrons move to the electrode substrate to gain a higher current and enable more efficient separation of charges under irradiation.74 When the content of CDs increases, the photocurrent density rises first and then decreases, due to the fact that the excessive CDs could cover the reaction active sites and act as the recombination centers of charges.75 So the kCT2 sample displays the strongest photocurrent signal, indicating high photocatalytic activity. The electrochemical impedance spectroscopy (EIS) plots of TiO2 NPs, gCDs and kCT2 are used to study the transfer resistance and separation efficiency of charges with and without light irradiation (Fig. 8b). The arc radius of the samples is smaller under light than with no light, implying fast charge transfer under irradiation.76 And the kCT2 sample has a smaller arc radius than TiO2 NPs and gCDs in the Nyquist plot, suggesting its more efficient charge separation and transfer under irradiation similar to the PL and TRPL spectra. Furthermore, SPV experiments were carried out to understand the separation and transfer behavior of charges (Fig. 8c).77,78 In general, a stronger SPV signal means a higher charge separation efficiency. It can be observed that the SPV response in the range of 350–400 nm denotes the electron transition from the VB to the CB of TiO2 (band–band transition) under illumination.79 Compared with TiO2 NPs, the stronger SPV response for kCT2 means that more photo-excited electrons inject into the sample surface.80 Therefore, the CDs/TiO2 composite can significantly accelerate the charge separation, thereby enhancing the photocatalytic degradation of MO.
In order to ascertain the photo-degradation mechanism of MO over the CDs/TiO2 composite, the reactive groups were detected by trapping experiments (Fig. 8d). Generally speaking, the main active species such as ·OH, ·O2− and h+ are detected by TBA, BQ and EDTA-2Na, respectively.81 It is found that the presence of BQ can severely prevent the degradation of MO and only 9.2% of MO is decomposed, and it is further proved by the N2 experiment that the degradation of MO decreases rapidly due to the absence of O2. Therefore, the ·O2− is the main active group to participate in the photocatalytic reaction of MO. By using EDTA-2Na as a sacrificial agent, the MO degradation is also obviously prohibited with a MO removal of 13.8%. TBA also has an important influence on the MO removal and ·OH is involved in the photocatalytic reaction. So it is confirmed that ·O2− and h+ are the main active species and ·OH can also affect the photocatalytic degradation of MO.
As a model, NBT can be used to quantitatively analyze the ·O2− species produced during the reaction, because ·O2− can be captured by NBT.36 The decrease of the absorption peak intensity of NBT at a maximum absorption of 259 nm with extension irradiation indicates that ·O2− can be produced in the MO degradation (Fig. S7a†). The existence of ·OH in photocatalysis can be identified by reacting with TA using PL technology. The reaction product 2-TAOH of ·OH and TA has a characteristic fluorescence response at 425 nm.36 The increasing PL intensity of 2-TAOH suggests that ·OH radicals are continuously produced in the photocatalytic reaction (Fig. S7b†). The above results are well matched to the trapping experiments.
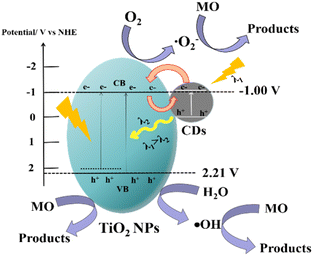
In order to investigate the possible mechanism of photocatalytic degradation of MO over the kilogram-scale CDs/TiO2 composite, it is necessary to clarify the VB and CB of TiO2 NPs. According to the Mott–Schottky (M–S) curves (Fig. S8†), the positive slope indicates the n-type semiconductor feature of TiO2 NPs.82 The flat band potential (Ef) is −0.62 V (vs. Ag/AgCl) that can be converted to the reversible hydrogen electrode (RHE) using the formula ERHE = Eθ(Ag/AgCl) + 0.059 × pH + Ef(Ag/AgCl), where Eθ(Ag/AgCl) is 0.1976 V and the pH value is 7.83–85 The Ef value of TiO2 NPs is −0.0094 V (vs. RHE) and relative to the normal hydrogen electrode (NHE) is −0.42 V (vs. NHE). Based on the VB-XPS spectrum described in Fig. 4e, the VB of TiO2 NPs is located at 2.21 V (vs. NHE). Using the formula ECB = EVB − Eg, the CB of TiO2 NPs is calculated to be −1.0 V (vs. NHE).
A possible photocatalytic mechanism of MO degradation over the kilogram-scale CDs/TiO2 composite is proposed in Fig. 9. The CDs/TiO2 samples exhibit strong light absorption and enhanced photocatalytic activity towards MO, which is attributed to the introduction of CDs into TiO2 NPs. Firstly, the electrons on CDs can be generated under irradiation due to the broad absorption band and transfer to the CB of TiO2. The TiO2 NPs modified with CDs can generate electrons by absorbing visible light due to the narrowed band gap induced by the band tail states. The photo-generated electrons on the CB of TiO2 can degrade MO molecules. Secondly, the short wavelength light that is emitted from the unique up-conversion of CDs can in turn be used to excite TiO2 NPs to gain more photo-generated electrons and holes. Finally, the CDs as electron acceptors can receive the photo-induced electrons from TiO2, which helps to block the charge recombination and makes more charge carriers available for MO degradation. At the same time, the adsorbed O2 accumulated on the CB of TiO2 and CDs is reduced to ·O2− by reacting with photo-generated electrons to degrade MO. The h+ on the VB of TiO2 could directly decompose MO molecules. Moreover, due to the more positive VB, the partial h+ can oxidize H2O to generate ·OH radicals that can degrade MO. Therefore, the CDs/TiO2 composite can gain the more photo-excited electrons and holes, and promote the transfer and separation of charges, so as to improve the photocatalytic activity.
4. Conclusions
Gram-scale CDs with a size of 2–5 nm were prepared, and the CDs/TiO2 composites and the kilogram-scale CDs/TiO2 material have been fabricated by one-step heat treatment. The CDs/TiO2 composites exhibit superior photo-degradation performance towards MO, and the removal of MO increases from 12.4% for pure TiO2 NPs to 88.8% for CT2 under visible light irradiation for 120 min. Moreover, kCT2 displays a similar photocatalytic activity towards MO to CT2 and the kilogram-scale synthesis of the CDs/TiO2 composite has little effect on its morphology, crystallinity, surface features, chemical composition and photocatalytic performance. The excellent photocatalytic properties of the kilogram-scale CDs/TiO2 composite may be due to the fact that the unique up-conversion of CDs, the existence of interaction at their interface and the narrowed band gap can broaden light absorption, excite the TiO2 NPs to produce more electrons and holes, promote charge transfer and separation, and then degrade more MO molecules. This work proposes an economic and efficient strategy for the kilogram-scale synthesis of CDs/TiO2, which exhibits their potential practical application in wastewater treatment.Author contributions
JX, JZ and FT designed the experiments, analysed the data and wrote the article. PL and PZ collected the data.Conflicts of interest
The authors declare no competing financial interest.Acknowledgements
This work was supported by the National Natural Science Foundation of China (NSFC, Grant No. 51372154 and 20901051) and by the Zhejiang Provincial Natural Science Foundation of China under Grant No. LY21B010005. The authors thank Congxiang Ma from the Department of Chemistry and Chemical Engineering, Shaoxing University for help in the synthesis of the photocatalysts.References
- I. A. Mensah, M. Sun, A. Y. Omari-Sasu, C. Gao, E. S. Obobisa and T. T. Osinubi, Environ. Sci. Pollut. Res., 2021, 28, 56865–56891 CrossRef PubMed.
- H. Wang, L. Fang, S. Hu, Y. Pei and W. Ma, New J. Chem., 2018, 42, 18335–18341 RSC.
- C. Bathula, I. Rabani, S. Sekar, H.-K. Youi, J.-Y. Choy, A. Kadam, N. K. Shretha, Y.-S. Seo and H.-S. Kim, Ceram. Int., 2021, 47, 8732–8739 CrossRef CAS.
- R. P. Barkul, R. S. Sutar, M. K. Patil and S. D. Delekar, ChemistrySelect, 2021, 6, 3360–3369 CrossRef CAS.
- K. Wang, L. Liang, Y. Zheng, H. Li, X. Niu, D. Zhang and H. Fan, New J. Chem., 2021, 45, 16168–16178 RSC.
- D. V. Mousavi, S. Ahmadipouya, A. Shokrgozar, H. Molavi, M. Rezakazemi, F. Ahmadijokani and M. Arjmand, J. Mol. Liq., 2021, 321, 114487 CrossRef CAS.
- P. Ramesh, W. L. Xu, M. Sorci, C. Trant, S. Lee, J. Kilduff, M. Yu and G. Belfort, J. Membr. Sci., 2021, 618, 118699 CrossRef CAS.
- R. Kishor, D. Purchase, G. D. Saratale, L. F. Romanholo Ferreira, C. M. Hussain, S. I. Mulla and R. N. Bharagava, J. Water Process. Eng., 2021, 43, 102300 CrossRef.
- M. Zhao, Y. Xiang, X. Jiao, B. Cao, S. Tang, Z. Zheng, X. Zhang, T. Jiao and D. Yuan, Sep. Purif. Technol., 2021, 276, 119289 CrossRef CAS.
- S. Hussain, H. Khan, N. Khan, S. Gul, F. Wahab, K. I. Khan, S. Zeb, S. Khan, A. Baddouh, S. Mehdi, A. F. Maldonado and M. Campos, Environ. Technol. Innov., 2021, 22, 101509 CrossRef CAS.
- Q. Wang, Y. Xiang, X. Li, W. Zhang, X. Huang and X. Qian, Ind. Crops. Prod., 2021, 170, 113695 CrossRef CAS.
- Y. Sun, L. Xu, P. Jin, X. Bai, X. Jin and X. Shi, Chem. Eng. J., 2021, 405, 126968 CrossRef CAS.
- M. Shams, H. Balouchi, H. Alidadi, F. Asadi, E. K. Goharshadi, S. Rezania, S. Rtimi, I. Anastopoulos, Z. Bonyadi, K. Mehranzamir and D. A. Giannakoudakis, J. Mol. Liq., 2021, 340, 116917 CrossRef CAS.
- R. Guo, D. Zeng, Y. Xie, Y. Ling, D. Zhou, L. Jiang, W. Jiao, J. Zhao and S. Li, Int. J. Hydrogen Energy, 2020, 45, 22534–22544 CrossRef CAS.
- X. Yang, Y. Wang, Z. Wang, X. Lv, H. Jia, J. Kong and M. Yu, Ceram. Int., 2016, 42, 7192–7202 CrossRef CAS.
- W. Kang, X. Jimeng and W. Xitao, Appl. Surf. Sci., 2016, 360, 270–275 CrossRef CAS.
- T. K. Jana, A. Pal, A. K. Mandal, S. Sarwar, P. Chakrabarti and K. Chatterjee, ChemistrySelect, 2017, 2, 3068–3077 CrossRef CAS.
- X. Wang, H. Fan and P. Ren, Catal. Commun., 2013, 31, 37–41 CrossRef CAS.
- J. A. Mendoza, H. K. Kim, H. K. Park and K. Y. Park, Korean J. Chem. Eng., 2012, 29, 1483–1486 CrossRef CAS.
- M. Sun, X. Ma, X. Chen, Y. Sun, X. Cui and Y. Lin, RSC Adv., 2014, 4, 1120–1127 RSC.
- X. T. Zhou, H. B. Ji and X. J. Huang, Molecules, 2012, 17, 1149–1158 CrossRef CAS PubMed.
- F. Li, F. Tian, C. Liu, Z. Wang, Z. Du, R. Li and L. Zhang, RSC Adv., 2015, 5, 8389–8396 RSC.
- S. Li, Y. Dong and M. Guo, Appl. Surf. Sci., 2012, 258, 8015–8018 CrossRef CAS.
- C. Liu, Y. Qin, W. Guo, Y. Shi, Z. Wang, Y. Yu and L. Wu, Appl. Surf. Sci., 2022, 580, 152262 CrossRef CAS.
- H. Feng, M.-H. Zhang and L. E. Yu, Appl. Catal., A, 2012, 413–414, 238–244 CrossRef CAS.
- A. Qu, H. Xie, X. Xu, Y. Zhang, S. Wen and Y. Cui, Appl. Surf. Sci., 2016, 375, 230–241 CrossRef CAS.
- Z. Ma, H. Ming, H. Huang, Y. Liu and Z. Kang, New J. Chem., 2012, 36, 861–864 RSC.
- W. Wang, L. Cheng and W. Liu, Sci. China Chem., 2014, 57, 522–539 CrossRef CAS.
- D. Bhattacharya, M. K. Mishra and G. De, J. Phys. Chem. C, 2017, 121, 28106–28116 CrossRef CAS.
- E. Amadio, S. Cailotto, C. Campalani, L. Branzi, C. Raviola, D. Ravelli, E. Cattaruzza, E. Trave, A. Benedetti, M. Selva and A. Perosa, Molecules, 2019, 25, 101 CrossRef PubMed.
- B. Zhang, H. Maimaiti, D.-D. Zhang, B. Xu and M. Wei, J. Photochem. Photobiol. A, 2017, 345, 54–62 CrossRef CAS.
- H. Zhang, H. Huang, H. Ming, H. Li, L. Zhang, Y. Liu and Z. Kang, J. Mater. Chem., 2012, 22, 10501–10506 RSC.
- L.-Y. Lin, C. Liu and T.-T. Hsieh, J. Catal., 2020, 391, 298–311 CrossRef CAS.
- J. Zhao, Y. Li and P. Na, Chin. J. Chem., 2021, 39, 1310–1318 CrossRef CAS.
- A. Sekar and R. Yadav, Optik, 2021, 242, 167311 CrossRef CAS.
- L. Ye, J. Liu, Z. Jiang, T. Peng and L. Zan, Appl. Catal., B, 2013, 142, 1–7 Search PubMed.
- S. Sharma, A. Umar, S. K. Mehta, A. O. Ibhadon and S. K. Kansal, New J. Chem., 2018, 42, 7445–7456 RSC.
- C. Xue, D. Li, Y. Li, N. Li, F. Zhang, Y. Wang, Q. Chang and S. Hu, Ceram. Int., 2019, 45, 17512–17520 CrossRef CAS.
- H. Zhang, G. Miao, X. Ma, B. Wang and H. Zheng, Mater. Lett., 2014, 121, 188–190 CrossRef CAS.
- G. Rajender, J. Kumar and P. K. Giri, Appl. Catal., B, 2018, 224, 960–972 CrossRef CAS.
- J. Liu, W. Zhu, S. Yu and X. Yan, Carbon, 2014, 79, 369–379 CrossRef CAS.
- H. Zhang, Z. Mo, H. Pei, Q. Jia, R. Wang, H. Feng, R. Guo and N. Liu, J. Mater. Sci.: Mater. Electron., 2019, 31, 1430–1441 CrossRef.
- Y. Guo, X. Kong, Z. Liang, Y. Xue, H. Cui and J. Tian, J. Colloid Interface Sci., 2020, 571, 412–418 CrossRef CAS PubMed.
- D. Yan, Y. Liu, C.-y. Liu, Z.-y. Zhang and S.-d. Nie, RSC Adv., 2016, 6, 14306–14313 RSC.
- S. Feizpoor and A. Habibi-Yangjeh, Mater. Res. Bull., 2018, 99, 93–102 CrossRef CAS.
- H. Niu, L. Liu, H. Wang, S. Zhang, Q. Ma, X. Mao, L. Wan, S. Miao and J. Xu, Electrochim. Acta, 2012, 81, 246–253 CrossRef CAS.
- H. Zhang, X. Lv, Y. Li, Y. Wang and a. J. Li, ACS Nano, 2010, 4, 380–386 CrossRef CAS PubMed.
- Z. Ai, L. Zhu, S. Lee and L. Zhang, J. Hazard. Mater., 2011, 192, 361–367 CrossRef CAS PubMed.
- Z. Liu, Z. Wang, S. Qing, N. Xue, S. Jia, L. Zhang, L. Li, N. Li, L. Shi and J. Chen, Appl. Catal., B, 2018, 232, 86–92 CrossRef CAS.
- H. Bozetine, Q. Wang, A. Barras, M. Li, T. Hadjersi, S. Szunerits and R. Boukherroub, J. Colloid Interface Sci., 2016, 465, 286–294 CrossRef CAS PubMed.
- J. Zhang, S. Yan, S. Zhao, Q. Xu and C. Li, Appl. Surf. Sci., 2013, 280, 304–311 CrossRef CAS.
- X. Zhang, Y. Sun, X. Cui and Z. Jiang, Int. J. Hydrogen Energy, 2012, 37, 811–815 CrossRef CAS.
- I. Amalraj Appavoo, J. Hu, Y. Huang, S. F. Li and S. L. Ong, Water Res., 2014, 57, 270–279 CrossRef CAS PubMed.
- J. Yu, Z. Chen, L. Zeng, Y. Ma, Z. Feng, Y. Wu, H. Lin, L. Zhao and Y. He, Sol. Energy Mater. Sol. Cells, 2018, 179, 45–56 CrossRef CAS.
- J. Jia, D. Li, J. Wan and X. Yu, J. Ind. Eng. Chem., 2016, 33, 162–169 CrossRef CAS.
- M. Mukthar Ali, J. S. Arya Nair and K. Y. Sandhya, Dyes Pigm., 2019, 163, 274–284 CrossRef CAS.
- R. Purbia, R. Borah and S. Paria, Inorg. Chem., 2017, 56, 10107–10116 CrossRef CAS PubMed.
- Y. Zhang, Z. Zhao, J. Chen, L. Cheng, J. Chang, W. Sheng, C. Hu and S. Cao, Appl. Catal., B, 2015, 165, 715–722 CrossRef CAS.
- R. Liu, H. Li, L. Duan, H. Shen, Y. Zhang and X. Zhao, Ceram. Int., 2017, 43, 8648–8654 CrossRef CAS.
- G. Li, F. Wang, P. Liu, Z. Chen, P. Lei, Z. Xu, Z. Li, Y. Ding, S. Zhang and M. Yang, Chemosphere, 2018, 197, 526–534 CrossRef CAS PubMed.
- Y. Sui, L. Wu, S. Zhong and Q. Liu, Appl. Surf. Sci., 2019, 480, 810–816 CrossRef CAS.
- G. Jia, Y. Wang, X. Cui and W. Zheng, ACS Sustain. Chem. Eng., 2018, 6, 13480–13486 CrossRef CAS.
- J. Liu, L. Han, N. An, L. Xing, H. Ma, L. Cheng, J. Yang and Q. Zhang, Appl. Catal., B, 2017, 202, 642–652 CrossRef CAS.
- H.-Y. Chen, L.-G. Qiu, J.-D. Xiao, S. Ye, X. Jiang and Y.-P. Yuan, RSC Adv., 2014, 4, 22491–22496 RSC.
- W. Z. Tang and H. An, Chemosphere, 1995, 4157–4170 CrossRef CAS.
- J. Li, D. Luo, C. Yang, S. He, S. Chen, J. Lin, L. Zhu and X. Li, J. Solid State Chem., 2013, 203, 154–159 CrossRef CAS.
- J. Li, Z. Guo, Z. Liu, M. Cui and Z. Zhu, Phys. Status Solidi A, 2015, 212, 459–466 CrossRef CAS.
- X. Li, P. Liu, Y. Mao, M. Xing and J. Zhang, Appl. Catal., B, 2015, 164, 352–359 CrossRef CAS.
- S. Sharma, S. Kumar, S. M. Arumugam and S. Elumalai, Appl. Catal., A, 2020, 602, 117730 CrossRef CAS.
- M. Sabri, A. Habibi-Yangjeh and S. Vadivel, J. Mater. Sci.: Mater. Electron., 2019, 30, 12510–12522 CrossRef CAS.
- M. A. Alcudia-Ramos, M. O. Fuentez-Torres, F. Ortiz-Chi, C. G. Espinosa-González, N. Hernández-Como, D. S. García-Zaleta, M. K. Kesarla, J. G. Torres-Torres, V. Collins-Martínez and S. Godavarthi, Ceram. Int., 2020, 46, 38–45 CrossRef CAS.
- M. S. Nasir, G. Yang, I. Ayub, X. Wang, S. Wang and W. Yan, Int. J. Hydrogen Energy, 2020, 45, 13994–14005 CrossRef CAS.
- Y. Huang, Y. Wang, Y. Bi, J. Jin, M. F. Ehsan, M. Fu and T. He, RSC Adv., 2015, 5, 33254–33261 RSC.
- P. Murugesan, S. Narayanan, M. Manickam, P. K. Murugesan and R. Subbiah, Appl. Surf. Sci., 2018, 450, 516–526 CrossRef CAS.
- D. Xu, L. Li, R. He, L. Qi, L. Zhang and B. Cheng, Appl. Surf. Sci., 2018, 434, 620–625 CrossRef CAS.
- W. Zhan, Y. Yuan, L. Sun, Y. Yuan, X. Han and Y. Zhao, Small, 2019, 15, 1901024 CrossRef PubMed.
- S. Li, L. Hou, L. Zhang, L. Chen, Y. Lin, D. Wang and T. Xie, J. Mater. Chem. A, 2015, 3, 17820–17826 RSC.
- J. Zhang, Y. Cao, P. Zhao, T. Xie, Y. Lin and Z. Mu, Colloids Surf. A: Physicochem. Eng. Asp., 2020, 601, 125019 CrossRef CAS.
- H. Li, D. Wang, H. Fan, P. Wang, T. Jiang and T. Xie, J. Colloid Interface Sci., 2011, 354, 175–180 CrossRef CAS PubMed.
- Y. Xin, Y. Lu, C. Han, L. Ge, P. Qiu, Y. Li and S. Fang, Mater. Res. Bull., 2017, 87, 123–129 CrossRef CAS.
- H. Yang, B. Xu, S. Yuan, Q. Zhang, M. Zhang and T. Ohno, Appl. Catal., B, 2019, 243, 513–521 CrossRef CAS.
- J. Pan, Z. Dong, B. Wang, Z. Jiang, C. Zhao, J. Wang, C. Song, Y. Zheng and C. Li, Appl. Catal., B, 2019, 242, 92–99 CrossRef CAS.
- R. A. Rather, M. Khan and I. M. C. Lo, J. Catal., 2018, 366, 28–36 CrossRef CAS.
- G. W. An, M. A. Mahadik, W.-S. Chae, H. G. Kim, M. Cho and J. S. Jang, Appl. Surf. Sci., 2018, 440, 688–699 CrossRef CAS.
- R. P. Patil, M. A. Mahadik, H.-S. Bae, W.-S. Chae, S. Hee Choi and J. Suk Jang, Chem. Eng. J., 2020, 402, 126153 CrossRef CAS.
Footnotes |
| † Electronic supplementary information (ESI) available. See DOI: https://doi.org/10.1039/d2na00886f |
| ‡ These authors contributed equally to this paper and should be considered as co-first authors. |
| This journal is © The Royal Society of Chemistry 2023 |

