 Open Access Article
Immunoglobulin adsorption and film formation on mechanically wrinkled and crumpled surfaces at submonolayer coverage†
Matthew T.
Gole
 a,
Mohan T.
Dronadula
b,
Narayana R.
Aluru
 b and
Catherine J.
Murphy
 *a
*a
aDepartment of Chemistry, University of Illinois Urbana-Champaign, Urbana, IL 61801, USA. E-mail: murphycj@illinois.edu
bWalker Department of Mechanical Engineering, The University of Texas at Austin, Austin, Texas 78712, USA
First published on 10th March 2023
Abstract
Understanding protein adsorption behavior on rough and wrinkled surfaces is vital to applications including biosensors and flexible biomedical devices. Despite this, there is a dearth of study on protein interaction with regularly undulating surface topographies, particularly in regions of negative curvature. Here we report nanoscale adsorption behavior of immunoglobulin M (IgM) and immunoglobulin G (IgG) on wrinkled and crumpled surfaces via atomic force microscopy (AFM). Hydrophilic plasma treated poly(dimethylsiloxane) (PDMS) wrinkles with varying dimensions exhibit higher surface coverage of IgM on wrinkle peaks over valleys. Negative curvature in the valleys is determined to reduce protein surface coverage based both on an increase in geometric hindrance on concave surfaces, and reduced binding energy as calculated in coarse-grained molecular dynamics simulations. The smaller IgG molecule in contrast shows no observable effects on coverage from this degree of curvature. The same wrinkles with an overlayer of monolayer graphene show hydrophobic spreading and network formation, and inhomogeneous coverage across wrinkle peaks and valleys attributed to filament wetting and drying effects in the valleys. Additionally, adsorption onto uniaxial buckle delaminated graphene shows that when wrinkle features are on the length scale of the protein diameter, hydrophobic deformation and spreading do not occur and both IgM and IgG molecules retain their dimensions. These results demonstrate that undulating wrinkled surfaces characteristic of flexible substrates can have significant effects on protein surface distribution with potential implications for design of materials for biological applications.
Introduction
Flexible and deformable materials are of great interest for biological applications due to their strain resistance and mechanically tunable surface properties. Soft materials including elastomers and two-dimensional (2D) materials undergo wrinkling and buckling instabilities in response to mechanical compression, granting control over the surface topography on submicron length scales.1–3 These surface structures have been utilized for biological applications, particularly tissue engineering.4,5 Surface wrinkles have been additionally shown to affect protein crystallization6 and reduction of biofilm attachment.7 One understudied aspect of deformed soft materials is protein adsorption behaviour, despite this being one of the first processes to occur when a material contacts a biological fluid.8 Knowledge of how proteins adsorb and form films on surfaces is vital to the study of material biofouling.9 Conversely, protein films can be used beneficially to reduce cytotoxicity of materials by shielding their surface properties.10,11Surface topography and chemical inhomogeneities are well known to affect protein adsorption, film formation, and spatial distribution. The effects of random surface roughness have been studied with variable results based on differing surface chemistry and protein identity.12–15 Nanofabricated arrays of pillars in black silicon have additionally been shown to affect protein spatial distribution.16 In contrast, mechanically deformed soft materials form repeating undulating curves upon deformation, without the sharp surface features of lithographically patterned surfaces. The effects of curvature on protein binding have previously been most commonly evaluated on colloidal nanoparticles, with curvature modulated through change of nanoparticle size.17–20 The effects of negative curvature are comparatively less well studied due to the difficulty in fabricating and accessing uniform concave regions on nanostructures. Existing examples include porous gold nanocages21 and carbon nanotubes,22 which have extremely high levels of curvature.21 The analogous study of undulating surface structures comparable to deformed flexible materials is similarly limited, with little focus on negative curvature regions.23,24
Surface topography also affects the wetting and drying behaviour of surfaces, and thus the resulting patterning and distribution of solids in the dried film. This has additional relevance for applications where protein solutions are dried onto a surface.25,26 Drying effects mainly manifest as large rings due to the coffee ring effect,27 nanoscale web-like networks caused by Marangoni flow,28 and densification through interparticle capillary forces.29,30 The effect is commonly observed to cause protein network formation on hydrophobic graphitic surfaces,31,32 where proteins have more freedom of migration compared to charged surfaces.33 To date, there has been little study on the effects of surface topography on how proteins form films on graphitic surfaces.
Immunoglobulins (Ig) are a class of proteins with high serum abundance and particular interest for protein adsorption studies, as their adsorption to biomedical materials can cause inappropriate complement activation and potentially negative health effects.34 IgM is a 950 kDa protein consisting of a five-armed pentamer with monomers joined by disulfide bonds. Atomic force microscopy studies have shown that it contains a raised central region on the same side as its antigen binding sites, which when under nonspecific binding conditions preferentially points upwards towards the solution.35 IgG is a monomer protein with similar charge distribution to IgM, and a molecular weight of 150 kDa. Studies to date have focused on nanoparticle curvature on the structure and activity of immunoglobulins under specific binding conditions.36–39 Thus the effect substrates with both positive and negative curvature regions have on Ig binding is unknown.
Here we report the protein adsorption behaviour of immunoglobulins IgM and IgG on periodically wrinkled and roughly crumpled surfaces. PDMS wrinkles with both a charged, plasma treated surface with and without a hydrophobic graphene overlayer are studied to evaluate protein behaviour for different surface chemistries. Rough buckle delaminated graphene crumples are also used to examine the effect of extreme roughness on protein distribution. AFM is used to map their Ig adsorption behaviour and film formation at a resolution of several nanometers. Results are reported for varying wrinkle dimensions and protein concentrations.
Experimental
Materials and instrumentation
Shape-memory polystyrene sheets were purchased from Scientific Explorer-Poof Slinky. Polydimethylsiloxane precursor (Sylgard 184 silicone elastomer kit) was purchased from the Dow Chemical Company. Monolayer graphene on copper foil was purchased from Grolltex (SC6x6). Ammonium persulfate (≥98.0%), phosphate buffered saline tablets, immunoglobulin M (∼95% in buffered aqueous solution, from human serum) and immunoglobulin G (lyophilized fibers, from human serum) were purchased from Sigma-Aldrich. Nanopure water (18 MΩ m) was obtained from a Millipore system.Oxygen plasma treatment was applied with a Diener Plasma Etch System. Atomic force microscopy was performed on Asylum Cypher and Asylum MFP3D AFMs. Contact angle measurements were performed on a Ramé-Hart Model 250 contact angle goniometer.
Fabrication of wrinkled PDMS and graphene substrates
The procedure for fabrication of conformally wrinkled graphene and PDMS substrates was adapted from our previously reported method.40 Cleaned shape-memory polystyrene sheets were treated with 150 W oxygen plasma for 5 s. Freshly mixed and vacuum degassed Sylgard 184 at a ratio of 7 parts base to 1 part curing agent was spin coated onto the sheets at 6000 rpm for 90 s. The PDMS was then cured at 80 °C for 20 h. Sheets were cut into 12 × 70 mm strips and treated with 250 W oxygen plasma for between 12–48 s depending on the desired wrinkle dimensions. For graphene substrates, the PDMS was then aged 48 h in ambient conditions, followed by wet transfer of CVD grown graphene with a 50 nm gold handle layer. The handle layer was etched with a 93% ethanol solution containing 2 mg mL−1 potassium iodide and 0.5 mg mL−1 iodine and washed 3× with 60% isopropanol. Wrinkling was performed by mounting the strips on a clean glass microscope slide, clamping the short axes to the slide to immobilize, then shrinking uniaxially at 105 °C to 90% of the original width. For experiments on fresh plasma treated PDMS, the aging and graphene transfer steps were omitted, and wrinkling was performed immediately following plasma treatment. Samples were used within 6 hours of plasma treatment to retain surface hydrophilicity.Fabrication of crumpled graphene substrates
The procedure for the fabrication of buckle delaminated crumpled graphene substrates was adapted from a previously reported method.2 Cleaned shape-memory polystyrene sheets were cut into 12 × 70 mm strips and treated with 250 W oxygen plasma for 2 s. CVD grown graphene was then applied by the same method as for PDMS substrates. Crumples were formed by 30% uniaxial shrinking of the strips as earlier described.Immunoglobulin adsorption
IgM and IgG were diluted or reconstituted, respectively, in 10 mM phosphate buffered saline (PBS), pH 7.4, to the desired concentration. For 1 minute incubation experiments, a 100 μL drop of the protein solution was dropcast onto a 3 × 12 mm strip of substrate and allowed to incubate at room temperature. For longer adsorption times, substrates were immersed in protein solution in an Eppendorf tube pre-treated with bovine serum albumin to prevent adsorption to the walls of the tube. Substrates were then rinsed 5× with 0.1 mM PBS pH 7.4 to remove excess buffer salts and unbound protein. Samples were gently blown dry with argon. Adsorption studies were conducted on average, every 2 weeks on different batches of samples for a period of three years; representative data are shown. Statistical significance is indicated in adsorption data by asterisks (* for P ≤ 0.05, ** for P ≤ 0.01, *** for P ≤ 0.001).Contact angle measurements
A 3 μL sessile drop of nanopure H2O was applied to the sample, followed by imaging and analysis in Rame-Hart software. Measurements were performed in triplicate on the same sample. Measurements were made within 3 hours of plasma treatment for wrinkled PDMS, or within 3 hours of gold handle layer etching for conformal wrinkled graphene on PDMS.Atomic force microscopy
Samples were immobilized to AFM discs with epoxy. Air tapping mode measurements were taken with Tap300Al-G tips (BudgetSensors), with a nominal spring constant 40 N m−1 at a scan rate of 2 Hz. Liquid AFM was performed on the Asylum Cypher in Fast Force Mapping mode with BioLever Mini tips (Olympus Corporation), with a nominal spring constant of 0.09 N m−1 at a set point of 250 pN and a Z rate of 299.40 Hz.Wrinkle radii of curvature were determined by fitting a quadratic function to multiple line profiles of peaks and valleys and are reported as absolute values. Protein surface coverage was quantified by analysis of AFM images in Gwyddion software. A 140 × ∼800 nm region along each peak or valley was cropped, and a second-order flattening was performed to remove the curvature of the substrate's topography. A threshold with user selected cut-off was used to separate protein from substrate and quantify the surface coverage of the protein. Standard error was calculated by averaging measurements from 3 regions on the same sample. A t test was performed to determine significance of differences in peak/valley coverage, with p ≤ 0.05 being considered significant. Fast Fourier Transform (FFT) filtering was performed in Gwyddion software.
Molecular simulations
Coarse-grained molecular dynamics (CGMD) simulations were performed to compute the adsorption energies of IgM and IgG on flat, concave, and convex silica substrates; silica serves as a prototypical well-defined polar surface that recapitulates plasma treated PDMS. The full atomistic protein structure of IgM was obtained from the authors of a previous study35 and IgG from protein data bank (1IGY). The MARTINI forcefield41,42 was used to model a coarse-grained representation of the protein. The curved substrate was generated from an experimental line profile for a representative sample and modelled with SP1 type MARTINI beads. The radii of curvature were 233 nm for the concave valley and 371 nm for the convex peak. Overall surface charge density was set to −3.2 μC cm−2. Additionally, the simulations consist of water (a polarizable model was used43), as well as 140 mM of sodium and chloride ions.The simulations were performed in the NVT ensemble at 300 K using GROMACS simulation package.44–48 A velocity rescaling thermostat was used to maintain the temperature in simulations.49 Each system was equilibrated for 1 μs to allow for the protein adsorption followed by another 200 ns simulation to compute the interaction energies.
Results and discussion
Preparation and characterization of wrinkled PDMS and graphene substrates
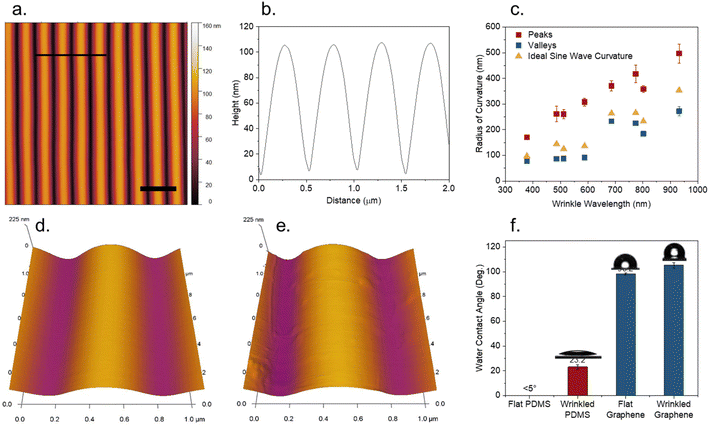
Plasma treatment of PDMS creates a rigid silica skin layer on the order of tens of nanometers thick.50 A compressive force applied to the substrate is distributed through sinusoidal surface wrinkling, with the dimensions (wavelength and amplitude) determined by the thickness of the skin layer, as well as the modulus ratio between the skin layer and PDMS substrate.1 These parameters can be controlled via the power and duration of plasma treatment time, and changing the ratio of base to curing agent in the PDMS precursor, respectively. Wrinkled PDMS substrates were fabricated with wavelengths ranging from 500–800 nm. A typical wrinkled PDMS substrate is shown in Fig. 1a. Wrinkles are highly aligned with a regular undulating structure, as seen in the line profile (Fig. 1b). However, it was observed that the curvature of the peaks and the valleys is not identical, as it would be in an ideal sinusoidal curve. The radii of curvature for wrinkle peaks were consistently greater than that of the wrinkle valleys across a wide range of wrinkle wavelengths (Fig. 1c). Peak/valley radii of curvature for samples ranged from 170/77 nm for wrinkles with a wavelength of 370 nm, to 497/272 nm for wrinkles with a wavelength of 930 nm. Asymmetric degrees of curvature were also observed when decreasing the elastic modulus by increasing the PDMS base to curing agent ratio to 15![[thin space (1/6-em)]](https://www.rsc.org/images/entities/char_2009.gif) :
:![[thin space (1/6-em)]](https://www.rsc.org/images/entities/char_2009.gif) 1, as well as varying the amount of compressive strain (Fig. S1†). Measured radii of curvature were compared to that of an ideal sine wave with the same wavelength and amplitude for each sample. The average residuals for the measured radii of curvature versus the ideal sine wave curvature was found to be 130 ± 30 nm for wrinkle peaks, and −45 ± 18 nm for wrinkle valleys, suggesting that resistance of wrinkle peaks to compression is the largest contributor to the deviation. While this asymmetry of curvature is evident in line profiles shown in many previous studies using PDMS wrinkles, to our knowledge it has not been previously identified.
1, as well as varying the amount of compressive strain (Fig. S1†). Measured radii of curvature were compared to that of an ideal sine wave with the same wavelength and amplitude for each sample. The average residuals for the measured radii of curvature versus the ideal sine wave curvature was found to be 130 ± 30 nm for wrinkle peaks, and −45 ± 18 nm for wrinkle valleys, suggesting that resistance of wrinkle peaks to compression is the largest contributor to the deviation. While this asymmetry of curvature is evident in line profiles shown in many previous studies using PDMS wrinkles, to our knowledge it has not been previously identified.
Finer detail of both PDMS and graphene coated PDMS wrinkles are shown in Fig. 1d and e. Aside from the wrinkles, the PDMS surface has no visible topographical features at nano length scale. A monolayer graphene overlayer conforms to the curvature of the surface, with slight wrinkling/buckling of the film observed. As shown in Fig. 1f, freshly plasma treated flat PDMS exhibited near-total wettability, due to the polarity and negative charge of the silica-like skin layer.51 The contact angle increased slightly to 23 ± 2° upon wrinkling. As contact angle is expected to decrease with increasing roughness for hydrophilic substrates,52 this increase is attributed to adsorption of hydrocarbons during the several hours it takes to wrinkle and transport the sample, rather than the change in topography. Flat graphene, in contrast, is highly hydrophobic, with a small increase in hydrophobicity from 98 ± 1° to 105 ± 2° after wrinkling, which could be attributed to the increased surface roughness or to similar hydrocarbon contamination.
Adsorption of immunoglobulins to wrinkled PDMS
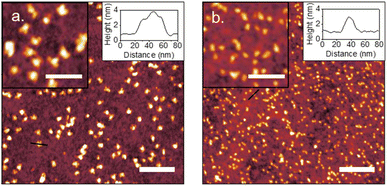
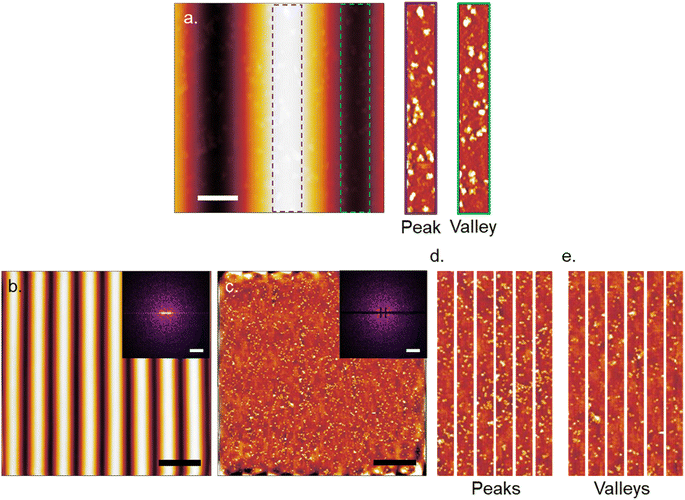
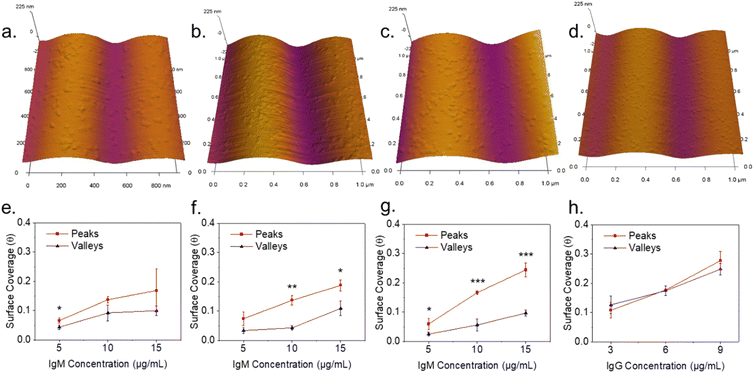
Plain plasma treated PDMS surfaces were first investigated to analyze the effects of curvature on a hydrophilic and negatively charged surface. IgM and IgG were diluted in 10 mM PBS at pH 7.4 and confirmed to be monodisperse through dynamic light scattering (Fig. S2†). IgM and IgG were then adsorbed onto PDMS surfaces through incubation of a static drop on the substrate at pH 7.4. Adsorption of immunoglobulins to flat PDMS are shown in Fig. 2a and b. The isoelectric point of the hydrophilic silica-like skin layer is presumed to be close to that of silica (∼2), which gives a negative charge at biological pH as has been determined by surface zeta potential measurements.51 The proteins are therefore likely adsorbed mainly through electrostatic stabilization. IgM is found to retain its characteristic pentamer structure, with a raised central region pointing upwards, as previously observed.35 This was previously determined to indicate that under nonspecific adsorption conditions, IgM binds with its Fab binding sites pointing upward.35 This is the opposite orientation to what occurs in antigen-specific binding, where the raised central region must be pointing downward in the direction for the protein conformation change to occur.35 The overall measured average height was 3.4 ± 0.5 nm and average width was 39 ± 5 nm. The measured height of the protein is shorter by several nanometers compared to the previously reported value, likely caused by compression from not being under cryogenic conditions.35 IgG had a measured average height of 1.9 ± 0.3 nm and average width of 25 ± 3 nm. It was crucial to perform all experiments on plasma treated PDMS the same day as the plasma treatment, as hydrocarbon adsorption quickly led to surface hydrophobicity and protein spreading (Fig. S3†).IgM adsorption on PDMS with a wrinkle wavelength of 500 nm is shown in Fig. 3a. Individual proteins are observable after cropping and flattening of the wrinkle curvature. Positive and negative surface curvature had no discernible effect on the protein orientation. Fig. 3b shows a 5 μm AFM topography scan of IgM adsorbed to wrinkled PDMS. The wrinkle topography was flattened with fast Fourier transform (FFT) filtering of frequencies along the horizontal axis (Fig. 3c). Upon isolation of regions corresponding to peaks and valleys in the unfiltered image, it was observed that IgM adsorption was greater on wrinkle peaks compared to valleys. The differential coverage was further quantified using higher resolution 1 μm scans (Fig. 4a–c). The apparent peak preference was roughly consistent for wrinkles of wavelengths ranging from 500–800 nm (Fig. 4e–g). This corresponds to radii of curvature range of 200–400 nm for peaks, and 80–200 nm for valleys. The adsorption behaviour and differential coverage of IgM was also observed in buffer, ruling out effects of sample drying (Fig. S4†). The peak coverage was greater than valley coverage by amounts ranging from 28–60%. For IgG on wrinkled PDMS, there was no significant difference between peak and valley coverage, behaving as if it were a flat surface (Fig. 4d and h).
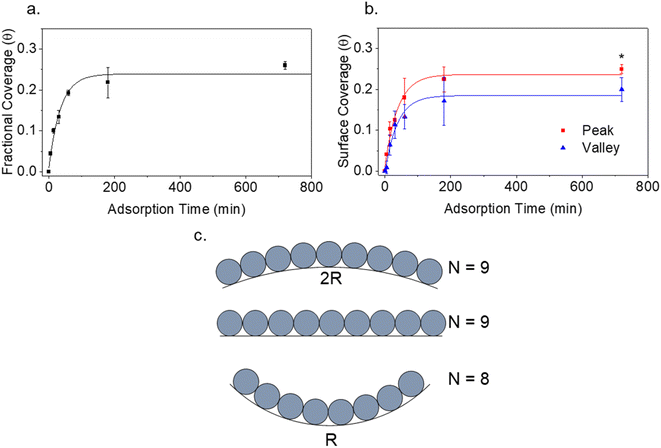
The kinetic adsorption behaviour of IgM was additionally studied (Fig. 5a and b). Data was collected from separate samples treated for the indicated adsorption times. Samples were prepared by immersion in protein solution in Eppendorf tubes to avoid changes in protein concentration due to drying of a droplet. Rates of protein adsorption were not markedly different for flat vs. wrinkled substrates. The data were fit with a Box Lucas model to estimate equilibrium IgM coverage. Fractional IgM coverage was significantly greater on wrinkle peaks (0.25 ± 0.01) versus valleys (0.20 ± 0.03) at equilibrium (p = 0.039). Full Langmuir isotherm analysis of protein adsorption has previously been demonstrated with AFM surface coverage data on flat HOPG and mica substrates,53 however, this could not be obtained on the wrinkled surfaces in our system due to the inability to differentiate protein from substrate on flattened wrinkles at high protein concentrations where fractional surface coverages were greater than ∼0.5. Phase contrast could also not be used to differentiate protein from substrate as the effects of wrinkle topography on the phase dominated the data. This could potentially be improved by further developments in chemically sensitive scanning probe techniques such as tip enhanced Raman spectroscopy.
It is well known that surface curvature can have either a positive or negative effect on protein binding, depending on protein geometry and chemistry.18 Studies overwhelmingly focus on the effects of positive curvature, while there is a comparative scarcity of research on negative curvature. Existing studies on negative curvature typically consider surfaces with curvature on the order of the size of the proteins, often finding an increase in binding energy as a result of an increase in contact points on concave surfaces.21,22 Given the small size of immunoglobulins compared to PDMS wrinkles, we considered the larger scale effects of surface geometry on the packing of proteins. The maximum packing density of objects increases with positive curvature and decreases with negative curvature. The effect this has on protein adsorption kinetics has been previously studied by Manzi et al., where Monte Carlo simulations were performed to study the adsorption of albumin molecules on black silicon pillars and holes, treating the globular proteins as hard spheres.54 A decrease in both albumin binding kinetics and the maximum adsorption capacity was found for adsorption to Gaussian holes of negative curvature compared to a flat surface.54 Both of these quantities increased for positively curved spikes and pillars.54 The change in protein kinetics was attributed to the change in curvature-dependent maximum adsorption capacity affecting the relationship in eqn (1):
 | (1) |
Protein/substrate binding energies from molecular simulations
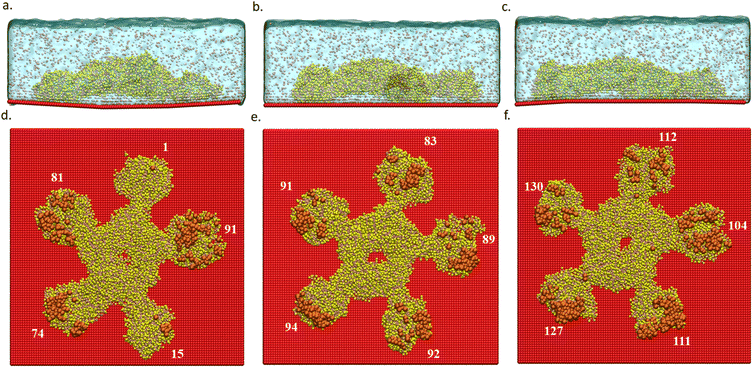
CGMD simulations were performed to study the differences in protein(IgM)/substrate binding strengths between the three curvature cases: flat, concave, and convex. Table 1 shows that the interaction energy is highest for the convex case, followed by flat and concave. To further understand the reason for the observed differences in binding energies, we examined the regions of the protein interacting with the substrate in the three cases. Fig. 6 shows us the parts of the protein which are within an interaction range of 11 Å from the substrate.| Binding energy (E) | Energy differences (|ΔE|) | Number of interacting beads | |
|---|---|---|---|
| Concave | −2134 ± 7 | 2122 | 262 |
| Flat | −4256 ± 9 | — | 449 |
| Convex | −4919 ± 7 | 663 | 585 |
In all the three cases, we observed that only the arms of the protein interact with the substrate. While all the five arms interact with the substrate in the flat and convex cases, only three arms interact in the concave case. This can be explained in terms of the substrate curvature, where there is a larger protein/substrate separation at the center of the concave region. Interestingly, in the convex case, the curvature enhances the extent of protein adsorption as the convex nature of the substrate seems to align better with the shape of the protein.
The deviation in the adsorption energy (with respect to the flat case) for the concave case is also larger compared to the convex case. This is likely due to the smaller radius of curvature in the concave case. Table 1 also reports the number of protein beads that interact with the substrate which is higher in the convex case and lower in the concave case, compared to the flat case.
Additionally, we computed the adsorption energies of the smaller IgG protein (Table S1†). Unlike the IgM case, the differences in adsorption energies of IgG between the three curvature cases were very low. This is due to the significantly smaller size of IgG compared to IgM. However, a slightly larger difference (stronger binding) was observed in the concave case, owing to the smaller radius of curvature of the concave substrate.
Adsorption of immunoglobulins to conformal wrinkled graphene
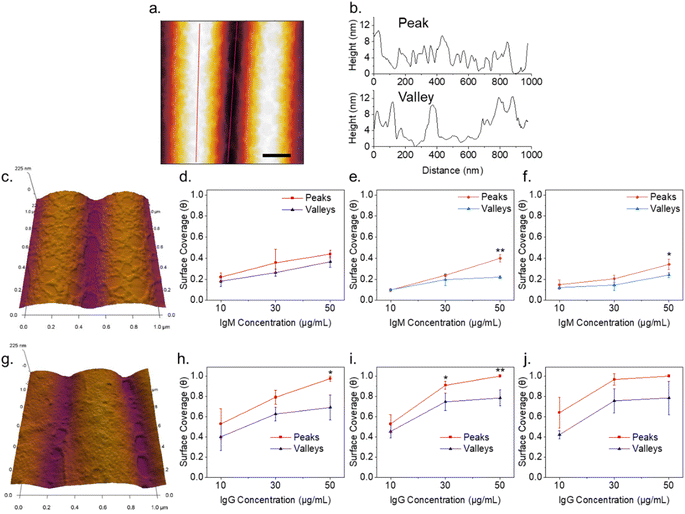
On flat graphene surfaces, immunoglobulins were observed to spread and deform (Fig. 7). In Fig. 7a, a measured protein height of 2–3 nm indicates the proteins deform greater than that on PDMS. As the concentration was increased (Fig. 7b and c), hole nucleation and network formation occurred. At 30 μg mL−1, the feature height was similar to that of 10 μg mL−1, however at 50 μg mL−1 the height of some features increases to 6–7 nm. Adsorption of proteins onto graphene and graphitic surfaces is dominated by hydrophobic interactions, rather than the electrostatics of a charged PDMS surface. This results in a higher degree of protein spreading due to deformation required to increase contact of the protein's inner hydrophobic residues with the graphene surface. Additionally, proteins are more mobile at hydrophobic surfaces.33 This has dramatic effects when a protein coated surface is dried, in contrast to that on highly charged surfaces. Drying effects due to capillary forces and Marangoni flow cause densification and nucleation of holes in the film.28,30Immunoglobulin films on the peaks of wrinkled graphene were found to behave similarly to that on flat graphene (Fig. 8a and c). Network formation and hole nucleation is clearly visible on wrinkle peaks for IgM. This also occurs for IgG, but the smaller size and faster diffusion of the protein results in near monolayer formation on peaks at higher concentrations (Fig. 8g). Protein films adopted different spatial distribution on wrinkle valleys for both IgM and IgG, where much larger hole nucleation occurred for both proteins. Line profiles across wrinkle peaks and valleys show a higher protein layer thickness of up to 10 nm at the boundary of the holes in the valleys compared to that on the peaks, as well as flat graphene (Fig. 8b). Given the consideration of capillary forces, this suggests a drying environment different than that of the wrinkle peaks. It has been previously observed that hydrophobic channels wet with filament-like elongated droplets.55 This corresponds to the elongated shape of the holes in the protein network compared to the circular ones on flat surfaces. A schematic of a proposed sequence of events is shown in Fig. 9. In the first stage of drying, the liquid level descends to the level of the protein layer. The thin liquid film then dewets due to Marangoni flow, causing network formation like on flat graphene. Portions of the valley remains filled with an oblong water droplet. During the drying of this droplet, outward convection pushes proteins to form an oblong void. While the morphology of the film was altered based on topography, the difference in surface coverage between peaks and valleys (Fig. 8d–f and h–j) was less consistent due to variability in the void formation. Liquid AFM was attempted to image the protein adsorption sans drying effects, however reliable results could not be observed due to slight delamination and bubble formation in the graphene while it was immersed in buffer.
Adsorption of immunoglobulins to crumpled graphene
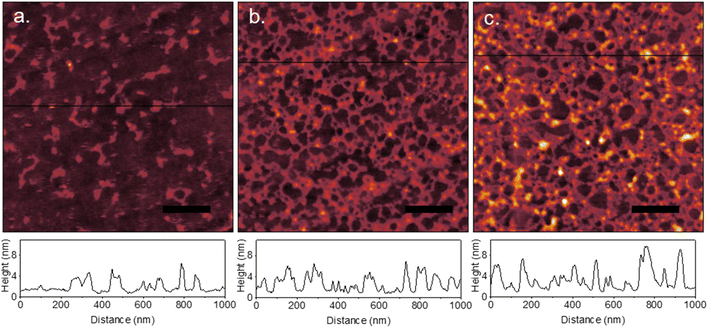
The previous cases have examined the adsorption and film formation on surfaces with topographical features many times larger than the size of individual proteins. The effect this had on film formation behaviour resulted from collective forces on large groups of proteins. To investigate the case where the substrate feature sizes are close to the size of individual proteins, crumpled graphene substrates were prepared. When graphene is adhered to a substrate that remains flat upon compression, compressive strain results in buckle delamination.2 This manifests as tightly spaced crumples with high roughness and features <100 nm in size. Uniaxial crumples were fabricated with a wavelength of 40 nm (Fig. 10a). The topography is flat along the edge of the spines as seen in the line profile. The result of IgM adsorption is shown in Fig. 10b. Individual molecules are observed to align along the spines of the crumples. The line profile distinguishes between separate molecules and confirms that there is no spreading or merging like that observed on flat/wrinkled graphene surfaces. IgG displays similar behaviour; however, multiple molecules align side-by-side along the spines due to their small size (Fig. 10c). This indicates the surface roughness is preventing the formation of a uniform thin film of water during drying that causes the network formation seen on flat and lightly wrinkled graphene. This is additionally supported by the observation that samples with slightly lower roughness can exhibit protein network formation caused by thin film formation during drying, evidenced by a curved border between regions of protein merging and network formation, and individual protein adsorption (Fig. S5†).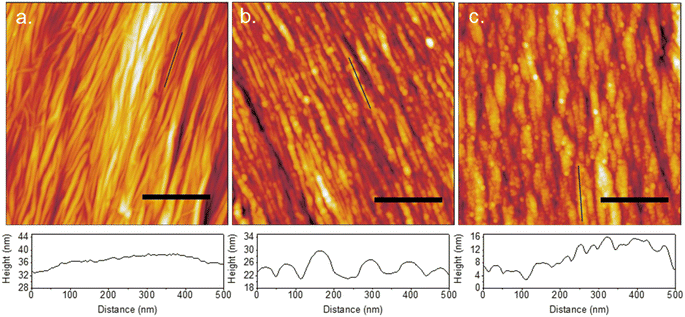 | ||
| Fig. 10 AFM topography of uniaxial crumpled graphene (a) alone, (b) with adsorbed IgM, and (c) with adsorbed IgG, with height profiles along portions of the crumple ridges shown below each AFM image. | ||
Conclusions
In summary, we have demonstrated how protein adsorption is affected by topographical features common to mechanically deformed flexible materials. Hydrophilic plasma treated PDMS wrinkles were shown to affect IgM adsorption particularly in the wrinkle valleys, with adsorption kinetics being reduced compared to that of a flat surface caused by reduced maximum packing amounts on negative curvature regions. Convex curvature showed more similar behaviour to a flat surface, due in part to the asymmetric degrees of curvature between peaks and valleys, as well as the decrease in binding energy. The smaller IgG, in contrast, was not significantly affected by the topography. For conformal graphene wrinkles, the protein behaviour was mainly a product of complex drying behaviour causing network formation on the wrinkle peaks, and capillary forces in the valleys that led to lower valley protein coverage. The case of extremely rough buckle delaminated graphene crumples showed that when the drying behaviour is suppressed through surface roughness, the proteins coat the surface more evenly and better retain molecular dimensions. These results can inform future work in biomedical devices and sensors relying on uniform protein distribution. Further study is needed to investigate any possible effects of negative curvature on specific adsorption to antigens and resulting complement activation.Conflicts of interest
There are no conflicts to declare.Acknowledgements
M. T. G., M. T. D., N. R. A., and C. J. M. acknowledge funding from the Illinois Materials Research Science and Engineering Center, which is supported by the National Science Foundation MRSEC program under NSF Award Number DMR-1720633. Measurements were carried out in part in the Materials Research Laboratory Central Research Facilities, University of Illinois. We thank Dr Kathy Walsh for valuable conversations and assistance with AFM measurements and data processing. TOC graphic was created with http://www.BioRender.com. Fig. 9 was created with Autodesk 3ds Max 2023.References
- J. Y. Chung, A. J. Nolte and C. M. Stafford, Adv. Mater., 2011, 23, 349–368 CrossRef CAS PubMed
.
- M. C. Wang, S. Chun, R. S. Han, A. Ashraf, P. Kang and S. Nam, Nano Lett., 2015, 15, 1829–1835 CrossRef CAS PubMed
.
- R. Zhao, T. Zhang, M. Diab, H. Gao and K.-S. Kim, Extreme Mech. Lett., 2015, 4, 76–82 CrossRef
.
- R. Dimmock, X. Wang, Y. Fu, A. El Haj and Y. Yang, Recent Prog. Mater., 2020, 2, 1 CrossRef
.
- J. Kim, J. Leem, H. N. Kim, P. Kang, J. Choi, M. F. Haque, D. Kang and S. Nam, Microsyst. Nanoeng., 2019, 5, 1–10 CrossRef PubMed
.
- A. Sengupta Ghatak and A. Ghatak, Langmuir, 2013, 29, 4373–4380 CrossRef CAS PubMed
.
- A. K. Epstein, D. Hong, P. Kim and J. Aizenberg, New J. Phys., 2013, 15, 095018 CrossRef CAS
.
- R. E. Baier and R. C. Dutton, J. Biomed. Mater. Res., 1969, 3, 191–206 CrossRef CAS PubMed
.
- G. Mackie, L. Gao, S. Yau, D. C. Leslie and A. Waterhouse, Trends Biotechnol., 2019, 37, 268–280 CrossRef CAS PubMed
.
- Y. Yamada, G. Fichman and J. P. Schneider, ACS Appl. Mater. Interfaces, 2021, 13, 8006–8014 CrossRef CAS PubMed
.
- W. Hu, C. Peng, M. Lv, X. Li, Y. Zhang, N. Chen, C. Fan and Q. Huang, ACS Nano, 2011, 5, 3693–3700 CrossRef CAS PubMed
.
- K. Rechendorff, M. B. Hovgaard, M. Foss, V. P. Zhdanov and F. Besenbacher, Langmuir, 2006, 22, 10885–10888 CrossRef CAS PubMed
.
- Y. Koc, A. J. de Mello, G. McHale, M. I. Newton, P. Roach and N. J. Shirtcliffe, Lab Chip, 2008, 8, 582 RSC
.
- M. Han, A. Sethuraman, R. S. Kane and G. Belfort, Langmuir, 2003, 19, 9868–9872 CrossRef CAS
.
- R. P. Richter and A. Brisson, Langmuir, 2003, 19, 1632–1640 CrossRef CAS
.
- D. H. K. Nguyen, V. T. H. Pham, M. Al Kobaisi, C. Bhadra, A. Orlowska, S. Ghanaati, B. M. Manzi, V. A. Baulin, S. Joudkazis, P. Kingshott, R. J. Crawford and E. P. Ivanova, Langmuir, 2016, 32, 10744–10751 CrossRef CAS PubMed
.
- S. M. McClain, A. M. Ojoawo, W. Lin, C. M. Rienstra and C. J. Murphy, ACS Nano, 2020, 14, 10153–10167 CrossRef CAS PubMed
.
- P. Roach, D. Farrar and C. C. Perry, J. Am. Chem. Soc., 2006, 128, 3939–3945 CrossRef CAS PubMed
.
- G. Yu and J. Zhou, Phys. Chem. Chem. Phys., 2016, 18, 23500–23507 RSC
.
- H. S. Mandal and H.-B. Kraatz, J. Am. Chem. Soc., 2007, 129, 6356–6357 CrossRef CAS PubMed
.
- X. Qian, U. Rameshbabu, J. S. Dordick and R. W. Siegel, Biomaterials, 2016, 75, 305–312 CrossRef CAS PubMed
.
- G. Raffaini and F. Ganazzoli, Langmuir, 2013, 29, 4883–4893 CrossRef CAS PubMed
.
- J. Sommerfeld, J. Richter, R. Niepelt, S. Kosan, T. F. Keller, K. D. Jandt and C. Ronning, Biointerphases, 2012, 7, 55 CrossRef CAS PubMed
.
- I. Firkowska-Boden, C. Helbing, T. J. Dauben, M. Pieper and K. D. Jandt, Langmuir, 2020, 36, 11573–11580 CrossRef CAS PubMed
.
- N. J. Andersen, T. K. Mondal, M. T. Preissler, B. M. Freed, S. Stockinger, E. Bell, C. Druschel, G. M. Buck Louis and D. A. Lawrence, J. Immunol. Methods, 2014, 404, 24–32 CrossRef CAS PubMed
.
- C. A. Henderson, H. McLiesh, W. L. Then and G. Garnier, Front. Chem., 2018, 6, 193 CrossRef PubMed
.
- R. D. Deegan, O. Bakajin, T. F. Dupont, G. Huber, S. R. Nagel and T. A. Witten, Nature, 1997, 389, 827–829 CrossRef CAS
.
- P. A. Kralchevsky and N. D. Denkov, Curr. Opin. Colloid Interface Sci., 2001, 6, 383–401 CrossRef CAS
.
- N. Denkov, O. Velev, P. Kralchevski, I. Ivanov, H. Yoshimura and K. Nagayama, Langmuir, 1992, 8, 3183–3190 CrossRef CAS
.
- P. A. Kralchevsky and K. Nagayama, Langmuir, 1994, 10, 23–36 CrossRef CAS
.
- M. Mertig, U. Thiele, J. Bradt, D. Klemm and W. Pompe, Appl. Phys. A: Mater. Sci. Process., 1998, 66, S565–S568 CrossRef CAS
.
- A. Orasanu-Gourlay and R. H. Bradley, Adsorpt. Sci. Technol., 2006, 24, 117–130 CrossRef CAS
.
- L. Shen and X.-Y. Zhu, Langmuir, 2011, 27, 7059–7064 CrossRef CAS PubMed
.
- D. B. Lyle, G. S. Bushar and J. J. Langone, J. Biomed. Mater. Res., Part A, 2010, 92, 205–213 CrossRef PubMed
.
- D. M. Czajkowsky and Z. Shao, Proc. Natl. Acad. Sci., 2009, 106, 14960–14965 CrossRef CAS PubMed
.
- M. B. Pedersen, X. Zhou, E. K. U. Larsen, U. S. Sørensen, J. Kjems, J. V. Nygaard, J. R. Nyengaard, R. L. Meyer, T. Boesen and T. Vorup-Jensen, J. Immunol., 2010, 184, 1931–1945 CrossRef CAS PubMed
.
- C. M. Zeuthen, A. Shahrokhtash, K. Fromell, K. N. Ekdahl, H. Mohammad-Beigi and D. S. Sutherland, Nano Res., 2020, 13, 1651–1658 CrossRef CAS
.
- S. Tenzer, D. Docter, S. Rosfa, A. Wlodarski, J. Kuharev, A. Rekik, S. K. Knauer, C. Bantz, T. Nawroth, C. Bier, J. Sirirattanapan, W. Mann, L. Treuel, R. Zellner, M. Maskos, H. Schild and R. H. Stauber, ACS Nano, 2011, 5, 7155–7167 CrossRef CAS PubMed
.
- D. Prozeller, C. Rosenauer, S. Morsbach and K. Landfester, Biointerphases, 2020, 15, 031009 CrossRef CAS PubMed
.
- M. T. Gole, Z. Yin, M. C. Wang, W. Lin, Z. Zhou, J. Leem, S. Takekuma, C. J. Murphy and S. Nam, Sci. Rep., 2021, 11, 12232 CrossRef CAS PubMed
.
- S. J. Marrink, H. J. Risselada, S. Yefimov, D. P. Tieleman and A. H. de Vries, J. Phys. Chem. B, 2007, 111, 7812–7824 CrossRef CAS PubMed
.
- L. Monticelli, S. K. Kandasamy, X. Periole, R. G. Larson, D. P. Tieleman and S.-J. Marrink, J. Chem. Theory Comput., 2008, 4, 819–834 CrossRef CAS PubMed
.
- S. O. Yesylevskyy, L. V. Schäfer, D. Sengupta and S. J. Marrink, PLoS Comput. Biol., 2010, 6, e1000810 CrossRef PubMed
.
- B. Hess, C. Kutzner, D. van der Spoel and E. Lindahl, J. Chem. Theory Comput., 2008, 4, 435–447 CrossRef CAS PubMed
.
- H. J. C. Berendsen, D. van der Spoel and R. van Drunen, Comput. Phys. Commun., 1995, 91, 43–56 CrossRef CAS
.
- S. Pronk, S. Páll, R. Schulz, P. Larsson, P. Bjelkmar, R. Apostolov, M. R. Shirts, J. C. Smith, P. M. Kasson, D. van der Spoel, B. Hess and E. Lindahl, Bioinformatics, 2013, 29, 845–854 CrossRef CAS PubMed
.
-
S. Páll, M. J. Abraham, C. Kutzner, B. Hess and E. Lindahl, in Solving Software Challenges for Exascale, ed. S. Markidis and E. Laure, Springer International Publishing, Cham, 2015, pp. 3–27 Search PubMed
.
- M. J. Abraham, T. Murtola, R. Schulz, S. Páll, J. C. Smith, B. Hess and E. Lindahl, SoftwareX, 2015, 1–2, 19–25 CrossRef
.
- G. Bussi, T. Zykova-Timan and M. Parrinello, J. Chem. Phys., 2009, 130, 074101 CrossRef PubMed
.
- S. Béfahy, P. Lipnik, T. Pardoen, C. Nascimento, B. Patris, P. Bertrand and S. Yunus, Langmuir, 2010, 26, 3372–3375 CrossRef PubMed
.
- Z. Liu, Y. Song and D. Li, J. Colloid Interface Sci., 2020, 578, 116–123 CrossRef CAS PubMed
.
- R. N. Wenzel, Ind. Eng. Chem., 1936, 28, 988–994 CrossRef CAS
.
- R. T. T. Gettens, Z. Bai and J. L. Gilbert, J. Biomed. Mater. Res., Part A, 2005, 72, 246–257 CrossRef PubMed
.
- B. M. Manzi, M. Werner, E. P. Ivanova, R. J. Crawford and V. A. Baulin, Sci. Rep., 2019, 9, 4694 CrossRef PubMed
.
- R. Seemann, M. Brinkmann, E. J. Kramer, F. F. Lange and R. Lipowsky, Proc. Natl. Acad. Sci., 2005, 102, 1848–1852 CrossRef CAS PubMed
.
Footnote |
| † Electronic supplementary information (ESI) available: Additional PDMS radius of curvature measurements, DLS of IgM and IgG, PDMS contact angles, liquid AFM scans, additional AFM images of IgM on crumpled graphene. See DOI: https://doi.org/10.1039/d3na00033h |
| This journal is © The Royal Society of Chemistry 2023 |

