 Open Access Article
Facile synthesis of water-soluble silver nanoclusters for the photocatalytic degradation of dyes by multivariate optimization approach†
Saif
Ullah
a,
Qinzhen
Li
a,
Rooh
Ullah
d,
Sadat
Anwar
abc,
Muhammad Fazal
Hameed
e and
Manzhou
Zhu
 *a
*a
aInstitutes of Physical Science and Information Technology, Centre for Atomic Engineering of Advanced Materials, Key Laboratory of Structure and Functional Regulation of Hybrid Materials of Ministry of Education, Department of Chemistry, Anhui Province Key Laboratory of Chemistry for Inorganic/Organic Hybrid Functionalized Materials, Anhui University, Hefei, Anhui 230601, China. E-mail: zmz@ahu.edu.cn
bInstitute of Chemical Sciences, University of Peshawar, Pakistan
cSino-Bright School, No. 8, 129 South 4th Ring, FengTai District, Beijing, 100005, China
dDepartment of Chemistry, University of Turbat, Turbat, Balochistan, Pakistan
eInstitutes of Physical Science and Information Technology, Anhui University, Hefei, Anhui 230601, China
First published on 15th May 2023
Abstract
In this study, silver nanoclusters protected by the natural tripeptide ligand (GSH@Ag NCs) were constructed for photocatalytic dye degradation. The ultrasmall GSH@Ag NCs were found to exhibit a remarkably high degradation capability. Aqueous solutions of the hazardous organic dye Erythrosine B (Ery. B) and Rhodamine B (Rh. B) were subjected to degradation in the presence of Ag NCs under solar light and white-light LED irradiation. The degradation efficiency of GSH@Ag NCs was evaluated using UV-vis spectroscopy, where Erythrosine B showed considerably high degradation of 94.6% compared to Rhodamine B, which was degraded by 85.1%, corresponding to a 20 mg L−1 degradation capacity in 30 min respectively under solar exposure. Moreover, the degradation efficacy for the above-mentioned dyes demonstrated a dwindling trend under white-light LED irradiation, attaining 78.57 and 67.923% degradation under the same experimental conditions. The astoundingly high degradation efficiency of GSH@Ag NCs under solar-light irradiation was due to the high I of 1370 W for solar light versus 0.07 W for LED light, along with the formation of hydroxyl radicals HO˙ on the catalyst surface initiating degradation due to oxidation.
1. Introduction
To access the food and clean water is crucial for survival with the steep rise in the global population. This rise is also driving industries to produce more and more synthetic products for humankind. However, different industries discharge various toxic organic contaminants, such as hazards organic dyes, heavy metals, pesticides, aerosol particles, and perilous substance, into the atmosphere.1,2 Most of these industrial effluents pollute the environment, and water pollution is among the worst. Potable water is a basic need, yet worldwide, 0.78 million people have no access to safe drinking water. According to the World Health Organization (WHO), 10–20 million people are demising every year due to polluted water.3 WHO has claimed that approximately 17 to 20% wastewater is produced by the dyeing, cosmetic, and textile industries, in which about 10–20% of dyes are mixed in water during the synthesis and processing of dyes in the cosmetic and textile industry.4,5 Dyes are highly poisonous, hazardous, and mutagenic in nature.6,7 The industrial wastewater is directly discharged to water bodies, while the water from rivers and lakes is used for irrigation, which can affect the soil fertility.8–10 Even a slight amount of dyes in water decreases the sunlight penetration, thus affecting the aquatic life.11Dyes, in particular azo dyes, which are widely used in the textile industry,12 such as rhodamine B,13 erythrosine B,14 and methyl orange.15 For the removal of these colored dyes from wastewater, physical, chemical, and biological methods are used, which include adsorption, oxidation, reduction, membrane filtration, photochemical removal, electrochemical removal, and anaerobic treatment. Meanwhile, dye pollutants are mostly stable and they are highly resilient to microorganisms. Hence, proper treatment is required to remove the dyes contained in wastewater.16–21 Recently, researchers have been focusing on nanocatalyst-based removal methods,22 with incredible progress made in the field of catalysis. The currently utilized methods for dye removal have several disadvantages, e.g., incomplete degradation of the dye due to the complicated structure, high energy use, and unsuitability for large-scale water treatment.23 However, photodegradation has been found to be an effective treatment for the degradation of dyes due to its simple and easy setup and cost-effective, facile, and environmentally friendly nature.24,25 Currently, highly efficient carbon nanotubes and carbon nanopinnacles (CNPs) are utilized for the degradation removal of dyes. The photocatalyst is essential for attaining efficient photocatalytic activity. Using these materials, an intriguing investigation has been conducted, such as (e.g., 3D/3D ReS2/ZnIn2S4–Sv heterojunction, g-C3N4, 2D/2D LaVO4/g-C3N4 (LaVO4/CN) heterostructures) due to their highly crystalline nature, excellent photocatalyst activity, and good stability.26,27
Recently, photocatalytic degradation has become considered as an easier process for the removal of dyes. Photodegradation is the most appropriate way to eliminate dyes through a degradation process. This degradation process has thus become enormously popular in the last few years compared with heterogeneous catalysis, where a semiconductor photocatalyst absorbs light to accelerate the photoreaction rate to degrade organic dyes. Zinc oxide and copper oxide are inorganic semiconductors that are commonly used in the classical methods. In the modern way taking advantage of photodegradation, organic dyes in wastewater can be removed in a few minutes in the presence of visible light, and without producing any toxic products.28–33 Consequently, photocatalytic degradation has been widely used in different fields, such as the removal of pollutants and bacteria,34 water splitting for hydrogen evolution,35 and energy conversion.36 Photocatalysis has opened new doors for the degradation of organic dyes and in the field of nanotechnology. Ag@GSH NCs are the most suitable catalyst for the degradation of rhodamine B and erythrosine B dyes. Rhodamine B is highly soluble in water and frequently present in dye wastewater, especially from the textile industry. Rhodamine B can easily accumulate in wastewater; however, it can be successfully destroyed in an oxidation system. As a result, developing a proper oxidation system to treat wastewater is important. Recently, Ag nanocomposites were used to treat rhodamine B for its decomposition in the presence of visible light. Rhodamine B has been treated with different nanocomposites in a range of studies, such as Ag/FWO/GCN and Ag/Fe3O4 nanocomposites.37,38
Highly fluorescent metal nanoclusters have great potential to be used as photocatalysts for dye degradation. In this juncture, fluorescent NCs are of particular interest. The catalytic activity mostly depends on the particle size, and the nanocluster size is considered ideal, i.e., below 2 nm. A key facet of the NCs is that they do not alter and/or sway the water quality parameter.35–37 Currently, Ag NCs and Au NCs are the most widely used for the degradation of dyes. Their rate of catalytic activity is much higher when used alone. Nanotechnology ca. bridge the fields of photocatalysis and degradation. Atomically precise noble metal nanoclusters have unique properties due to their ultrasmall size.
In the current study, we fabricated a GSH@Ag NCs catalyst for the photodegradation of dyes, and it demonstrated a remarkable performance. It is very much anticipated that NCs-based technology will eventually dominate the field of catalysis due to its facile preparation, cost-effective synthesis, and environmentally friendly nature. Here, atomically engineered ultrasmall GSH@Ag NCs were employed as a photocatalyst for the first time and exhibited a remarkably high degradation performance. Aqueous solutions of the hazardous organic dye erythrosine B (Ery. B) and rhodamine B (Rh. B) were subjected to degradation in the presence of Ag NCs under solar light and white-light LED irradiation. A multivariate optimization methodology was used to attain a better understanding of the synergistic relationship between the extraction and separation procedures. The spiking addition methodology was used to confirm the accuracy of the desired approach. The recommended technique was successfully applied to a variety of real water samples. The ultrasmall GSH@Ag NCs have great prospects for applications in catalysis, biosensors, and as antioxidants, antibacterial agents, and artifacts.
2. Experimental section
2.1 Chemical
All of the chemical reagents were utilized directly, without further purification, and all were available commercially. Silver nitrate (Ag NO3 99% purity), sodium borohydride (99% purity NaBH4), and L-glutathione (GSH) were purchased from Shanghai Aladdin Bio-Chem Technology Co., Ltd. Deionized water was provided from Wahaha Co. Ltd. Sodium hydroxide and both dyes were purchased from Shanghai Aladdin Bio-Chem Technology Co., Ltd.2.2 Synthesis of GSH@Ag NCs in water
First, L-glutathione (GSH) 20 mM was made in aqueous solution and AgNO3 (20 mM) solution in deionized water. Also, 42 mg of sodium borohydride (NaBH4), freshly prepared at 114 mM, was dissolved in 10 mL of 0.1 M NaOH solution. The GSH@Ag NCs were used in the standard synthesis. In 4.4 mL, GSH (0.375 mL in 20 mM deionized water solution) and AgNO3 (0.125 mL in 20 mM deionized water solution) were added. At room temperature, the solution was continuously stirred to form Ag(I)–GSH complexes. Afterwards, 50 L of freshly produced NaBH4 solution (114 mM) was added, drop-wise. The solution turned deep red after about a 5 min reaction; it was then left undisturbed at room temperature for 4 h to allow the deep-red Ag NCs to completely break down into colorless Ag(I)–GSH complexes. Following vigorous stirring, 50 L of NaBH4 solution (114 mM) was added to the colorless solution, and after 30 min of reaction, the solution turned dark and light brown. Finally, the solution was incubated at room temperature for 8 h without stirring to allow the GSH@Ag NCs to form. The GSH@Ag NCs were purified and stored at 4 °C for future use. Furthermore, direct UV-vis spectroscopy was utilized to confirm the absorbance peaks at 489 nm, as shown in Fig. 1A. The synthesized GSH@Ag NCs were in a brown solution.38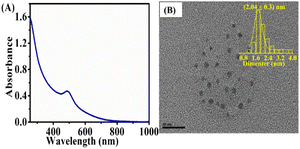 | ||
| Fig. 1 (A); UV spectroscopy and (B); TEM images of GSH@Ag NCs with the histogram of the particle size. | ||
2.3 Photocatalytic reduction
For assessing the photocatalytic reduction activity, two organic dyes were selected as typical pollutants for degradation. We evaluated the concentration of both dyes between 5 to 25 mg L−1 prepared in 30 mL of deionized water. First, 3.5 mL solution of each dye was irradiated in the presence of the synthesized GSH@Ag NCs. Next, 0.5 mL (5 mM) aqueous solution of freshly prepared NaBH4 was mixed in a quartz cuvette in the presence of GSH@Ag NCs. The solution was measured under UV-vis spectroscopy at 0 min. The maximum absorbances of erythrosine B dye at 527 nm and rhodamine B at 554 nm were measured. The photocatalytic reduction of NaBH4 solution was also measured in similar reaction conditions in the absence and presence of the GSH@Ag NCs catalyst.2.4 Photocatalytic degradation
During the photocatalytic degradation, both organic dye solutions were further exposed to solar light as well as white W-50 LED light irradiation, about 10 to 12 cm distance away in a closed reactor. The degradation reaction was started, and the solution's degradation was observed using UV-vis spectroscopy. While on the other side, both dyes were exposed to solar light, and the UV spectra were monitored over regular time intervals of 5 min. The efficiency of dye degradation was observed by the UV-vis spectra. The dye concentration in the supernatant solution was estimated by the UV-visible spectrum recorded at wavelengths ranging from 200 to 800 nm. The rate of degradation was calculated using the dye solution's decrease in absorbance. As the generation of reactive oxygen species (ROS) in the solution was responsible for the decomposition of the dye, if the dye molecules were adsorbed on the catalyst surface, they would only survive for very short intervals of time because ROS were ubiquitous in the solution, causing the dye to degrade quickly. Therefore, the dye adsorption was negligible in this process. Before exposing to irradiation, the solution was magnetically stirred in the dark for 30 min to reach absorption–desorption equilibrium. After that, the suspension was subsequently exposed to the light source and continuous stirring was carried out to maximize the possible interaction between the reaction mixture and photocatalyst. The removal percentage for both dyes' degradation was calculated using the following equation:39,40,74–77| Dye degradation % = (Ao − At/Ao) × 100% = (Co − C/Co) × 100% |
3. Results and discussion
3.1 Characterization of the GSH@Ag NCs
3.2 GSH@Ag nanocluster efficiency for xanthene dyes degradation
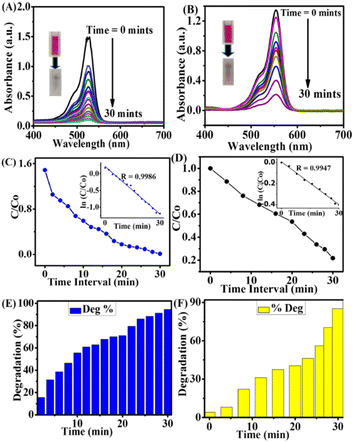
The photocatalytic dye degradation was measured for the ery. B dye as 94.60 and 85.141% for rh. B dye with a maximum time interval of 30 min and under solar light. The results were better compared to the degradation under the LED light source. The kinetics pseudo-first-order results for ery. B and rh. B dye degradation showed a good linear relationship between the ln![[thin space (1/6-em)]](https://www.rsc.org/images/entities/char_2009.gif) C/Co and the irradiation time (R = 0.9986) and (R = 0.9947), as mentioned in Fig. 2C and D. The slope of the straight line indicates the kinetic constant. The time interval versus C/Co represents the rate of degradation for both dyes, and the R value was calculated from the kinetic plot. In Fig. 2E and F, it can be seen that the photocatalytic degradation of both dyes in the presence of GSH@Ag NCs showed outstanding degradation rates. Our work presents an environmentally friendly, quite easy, safe, and economically attractive solution to dye degradation.
C/Co and the irradiation time (R = 0.9986) and (R = 0.9947), as mentioned in Fig. 2C and D. The slope of the straight line indicates the kinetic constant. The time interval versus C/Co represents the rate of degradation for both dyes, and the R value was calculated from the kinetic plot. In Fig. 2E and F, it can be seen that the photocatalytic degradation of both dyes in the presence of GSH@Ag NCs showed outstanding degradation rates. Our work presents an environmentally friendly, quite easy, safe, and economically attractive solution to dye degradation.
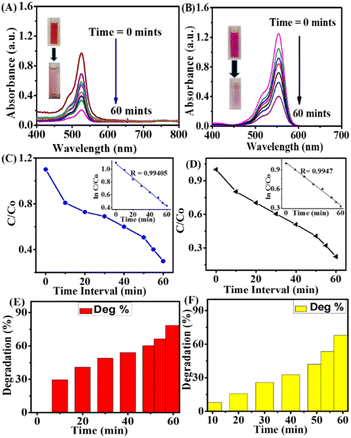
Under the same conditions, the photocatalytic degradation of both organic dyes was also investigated under white-light LED irradiation to introduce a new source for degradation, as shown in Fig. 3A–F.
The photocatalytic dye degradation of ery. B and rh. B shown the absorbance peaks at 530 and 554 nm, which represent clear evidence of a decrease in the UV spectra in the presence of GSH@Ag NCs under white-light LED irradiation, as observed in Fig. 3A and B. The photocatalytic efficiency was measured by UV-vis spectroscopy, and the rate of degradation of ery. B dye was 78.57% and it was 67.923% for rh. B. The first-order kinetics and the relationship between ln![[thin space (1/6-em)]](https://www.rsc.org/images/entities/char_2009.gif) C/Co and the irradiation time were calculated as R = 0.99405 and R = 0.9947 for the two dyes, as displayed in Fig. 3C and D. The rate of photocatalytic dye degradation percentage activity versus time-interval is illustrated for both dyes in Fig. 3E and F.
C/Co and the irradiation time were calculated as R = 0.99405 and R = 0.9947 for the two dyes, as displayed in Fig. 3C and D. The rate of photocatalytic dye degradation percentage activity versus time-interval is illustrated for both dyes in Fig. 3E and F.
A comparison of the xanthene dye degradation methods is summarized in Table 1. The rate of dye degradation was quite satisfactory in the presence of GSH@Ag NCs. In comparison to previously reported nanomaterials, the catalyst prepared by incorporating the organic semiconductor in silver nanoclusters demonstrates an efficient photocatalytic property using two light sources (solar light and LED white-light) that are inexpensive and energy efficient. They also demonstrated a high catalytic reduction efficiency for xanthene dye degradation. Power density is the amount of power per time rate of energy transfer per unit volume. The power density refer to a volume, and so it is often called the volume power density, expressed as W m−2 (SI unit). Solar light = 1353 W m−2, LED light = 75 to 110 lm per Watt.
| Catalyst based-nanomaterials | Visible light-source | Pollutants | Deg. % | Time (min) | Ref. |
|---|---|---|---|---|---|
| TiO2 QDs | 300 W xenon lamp | Methyl orange | N/A | P25 (0.025) | 41 |
| TiO2–Au NCs@β-CD | UV | Methyl orange | 98% | 40 | 42 |
| CuWO4 | Xenon lamp | Methylene blue | 80% | 30 | 43 |
| TiO2/GSH–AgNC | 200 W quartz | Rhodamine B | 60% | 380 | 44 |
| PTCA/capt-AgNC | 50 W LED | Malachite green | 80% | 52 | 45 |
| H3PMO12O40/polymer | LED@375 | Erythrosine B | 81% | 120 | 46 |
| MoS2-rGO-Fe2O3 | 500 W LED | MB | 36% | 80 | 47 |
| TiO2-rGO | Visible | RhB | 81% | 320 | 69 |
| g-C3N4 | Visible | RhB | — | 30 | 70 |
| Znln2S4 | Visible | CR | — | 300 | 71 |
| CdS/ZnS | Visible | MB | 70% | 360 | 72 |
| La-doped Bi2O3 | Visible | CF | 89% | 120 | 73 |
| Ag NCs | Solar light | Erythrosine B | 94.6% | 30 | This work |
| Rhodamine B | 84.1% | 30 | |||
| Ag NCs | 50 W LED | Erythrosine B | 78.6% | 60 | This work |
| Rhodamine B | 67.9% | 60 |
3.3 Dosage evaluation of the photocatalytic efficiency
Currently, new nanomaterials are being developed as effective photocatalysts that can work under visible light rather than ultraviolet light. Efficient photocatalytic reactions have been demonstrated to contribute significantly to the treatment of environmental pollution. Transition metal oxides, nitrides, sulfides, and other photocatalysts have received a lot of interest from researchers. In recent years, TiO2, CdS, ZnIn2S4, g-C3N4, and bismuth oxide have been seen as the most appealing photocatalysts due to their outstanding characteristics, such as strong redox ability, relative nontoxicity, high efficiency, good stability, and low cost.
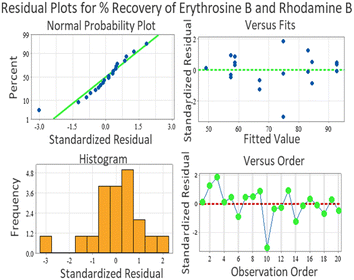
Several residual plots were used to test the proposed model. In a number probability plot, it should generally form a straight line to indicate a normal distribution. In the case of departure points in the plot, the assumption may be invalid. If we look at the normal probability plot and the large sized blue points, they show a row of six at the same value, as shown in Fig. 6. Notice that this occurred in another place on the chart where two were at the same value. This graph suggested an increase in the linear relationship among the samples. Hence, the values which are closed to the horizontal line can be predicted well, while those which are above the line are unpredictable, and those below the line tend to be overpredicted.
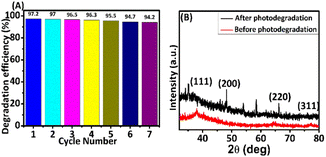 | ||
| Fig. 6 (A) Stability of Ag@GSH NCs for the degradation of dye at comparable rates for a consecutive 7 cycles; (B) XRD patterns of a dry sample of Ag@GSH NCs material. | ||
In the residual versus fitted values, the plot should express a random pattern of residuals on both sides of zero (Fig. 6). If the point lines are far from majority of points, they may be outliers. If the spread pattern of the residual value tends to increase as the fitted value increases, this could be the constant variance assumption. Versus fits values performed in x axis. When the variance is constant and a non-linear relationship arises, the residual is determined or explained in respect to the fitted values (this supports the claim that the residual ensure variance). As the residuals, which are around the 0 line, ‘bounce randomly’, they clearly present the assumption of a linear and practical relationship. The residuals formed in the horizontal band around the zero line reflect the error term of the variance, and the fundamental random stand out of residuals expressing no outliers.
A histogram was utilized to determine whether the variance was normally distributed, as shown in Fig. 6. A symmetric bell-shaped histogram was found evenly distributed around the zero, indicating the normality assumption was likely to be true. The histogram graph also shows that the histogram matched a normal distribution, and the residuals were normally distributed. This describes the overall characteristics of the residual's value, speed, and shape. The sided tail may show a skewed distribution. Further, no bars in the histogram are far from other, which showed a lack of outliers.
3.4 Stability and XRD patterns of Ag@GSH NCs
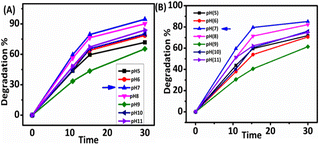
The photocatalyst's regeneration of its stability for long-term dye degradation are essential for successful industrial applications. The good stability of Ag@GSH NCs was investigated by performing the decomposition processes seven times, as shown in Fig. 6. After seven cycles, the composite's deterioration efficiency for the dye could be reduced by 3%, and the variation of degradation ratio reached more than 94% in each cycle. Therefore, the Ag@GSH NCs exhibited significant catalytic activity at pH 7 and excellent stability for long-time use in the degradation process.51 After the confirmation of the Ag@GSH NCs stability even further, the XRD spectral pattern of Ag@GSH NCs were studied after and before the degradation process. The crystalline phase structure of Ag@GSH NCs were acquired via XRD patterns, and are provided in Fig. 6A. The existence of different peaks 2θ = 38.2°, 47.8°, 64.5°, and 77.4° were noted, conforming to the (111), (200), (220), and (311) Millar index of Ag. The peaks that correspond to the (111) plane and the (200) plane had an intensity ratio of 0.40 and 0.24, respectively.52 It must be noted that the intensity ratio in this investigation was 2.41 against 0.61, which is greater than the typical value. This finding demonstrated that the (111) facets predominated in the Ag nanoclusters.533.5 Structural properties of Ag@GSH NCs
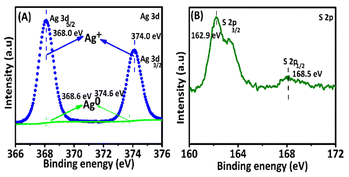
X-Ray photoelectron spectroscopy (XPS) was used for assessing the chemical compositions to classify the elements present in the as-prepared Ag NCs. The full-scan spectra exposed that Ti, O, and Ag elements were present, and also S was present in the Ag NCs as shown (Fig. 7). The related high-resolution XPS spectra of the Ag NCs were used for an extensive investigation of the Ag 3d peaks. Ag was present on the surface of Ag NCs in the form of Ag+, as evidenced by the presence of two separate peaks with centers at 368 and 374 eV binding energies, corresponding to Ag 3d5/2 and Ag 3d3/2 of Ag NCs, respectively. The positive charge of Ag arose from the intact thiolate ligands of silver nanoclusters and the presence of thiolate ligands. The S signals of Ag NCs in the XPS spectrum (Fig. 7B) further determined the presence of mercator ligands.54 The peaks centered at 162.9 eV corresponded well with the thiolates species, indicating the production of an S–Ag bond. Another signal at 168.5 eV could be attributed to sulfonates produced by X-ray beam driven thiolates oxidation.55 It should be noted that two peaks in Fig. 7A. Centered at 368 and 374 eV binding energies could be assigned to Ag0, showing that the core of the silver clusters was not coupled to thiolates, which may contribute to their photocatalytic activity.56Next, scanning electron microscopy (SEM) was applied to examine the morphology of Ag@GSH NCs. The SEM image of Ag@GSH NCs showed their morphological structure. Further, energy-dispersive X-ray spectroscopy (EDS) has been proved to be a useful technique for determining the chemical composition of nanocomposites.78 We thus used SEM and EDS mapping to investigate the microstructures and element distribution of the Ag@GSH NCs, as shown in Fig. 8A and B. The sample was composed of Ag and S elements. The results confirmed the fundamental composition of the synthesized material would be efficient for photocatalytic degradation.
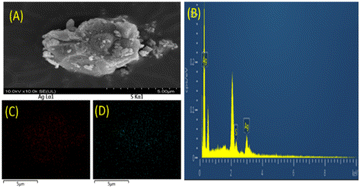 | ||
| Fig. 8 (A) SEM images of the sample Ag@GSH NCs, (B) EDS spectrum, (C and D) overlay of the elemental mapping images of the synthesized Ag@GSH NCs. | ||
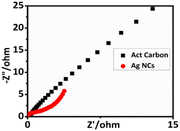
Electrochemical impedance spectroscopy (EIS) was used to investigate the charge transport and separation. The Ag NCs sample's charge-transfer efficiency inside the structure was demonstrated by the decreased radius in the EIS Nyquist plot. It was confirmed that the lowest interfacial charge-transfer resistance resulted in the maximum efficiency, as shown in Fig. 9. The Ag NCs had the lowest electron-transfer resistance, according to EIS, which also confirmed that their photocurrent density was much higher.57
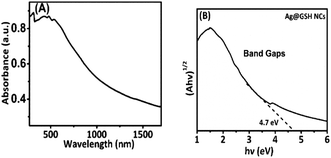
The optical properties of the Ag@GSH NCs were examined by UV-vis-diffuse reflectance absorption spectroscopy (DRS). Fig. 10A depicts the UV absorption edges of Ag@GSH NCs with a band edge at 372 nm. However, the Ag@GSH NCs demonstrated greater absorption in the visible range from 450 to 550 nm, and the strength of absorption in the visible area exclusively depended on Ag absorption. The optical band gap energy of Ag@GSH NCs was 4.7 eV, as shown in Fig. 10B. As a result, we suggest that the Ag@GSH NCs possessed higher absorption visible-light performances and could show excellent photocatalytic efficiency in the visible range. The adsorption light performance of the obtained materials was thus exhibited, and good responses to visible light were found due to the ultrasmall size of the Ag@GSH NCs, which exhibited the strongest adsorption capabilities.58
3.6 Photocatalytic dye degradation mechanism
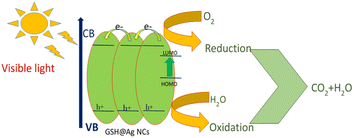
We propose a possible degradation mechanism based on the transfer of electrons between the synthesized GSH@Ag NCs and dye molecules. Recently, for the first time, we investigated the photocatalytic degradation of xanthene dyes (Ery. B and Rh. B) by using synthesized water-soluble GSH@Ag NCs nanoclusters, which demonstrated a successful degradation capability. Different roles played by the transfer of electrons and dye molecules are found on the surface of the Ag nanoclusters. Sodium borohydride (NaBH4) was used as a strong reductant molecule and was absorbed on the surface of the Ag nanoclusters and dye molecules. This action hindered the activity of the Ag nanoclusters with a lower activation energy.59,62–64 At that moment, the dye molecules were rebuilt, and as a result, CO2 and H2O will be produced. When they gain electrons, the decomposition of xanthene dyes starts due to an oxidation reduction reaction. The as-fabricated GSH@Ag NCs and NaBH4 were together used for the photodegradation of xanthene dye.60,61 As shown in Scheme 1, for both dyes under visible light, different mechanisms are proposed. For one, we suggest a well-known mechanism based on visible light.65–68 The proposed mechanisms are shown below:| Xanthene dyes + hν + xanthene dyes* |
| GSH@Ag NCs + hν → (e−) + h+ (e−CB + h+VB) |
| (O2)ads + (e−CB) → (O2˙−)ads |
The photodegraded holes can be oxidized with water to produce OH˙.
| Ag + OH + hν+ → Ag + OH˙ |
| Ag + H2O + h+VB → Ag + OH˙ + H+ |
| Xanthene dyes + h+ → xanthene dyes or degradation products (oxidation reaction) |
The oxidation of O2 and OH radical could start a series of oxidation dyes degradation reactions for the absorbance of dye molecules.
3.7 Mineralization reaction in erythrosine B dye degradation
In photocatalytic dye degradation, the mineralization plays an important role in the decomposition process. The breakdown of erythrosine dye following the mineralization leads to the formation of H2O and CO2, which decreases the GSH@Ag NCs during the photocatalytic process. Erythrosine dye was degraded 94.60% in 30 min under solar-light irradiation, while for comparison, the GSH@Ag NCs with white-light LED irradiation showed a slightly lower rate of degradation (78.57 = %) in 30 min. This was due to the formation of a more stable intermediate toward photo-oxidation, as shown in Fig. S1.†3.8 Mechanism reaction in rhodamine B dye degradation
GSH@Ag NCs were successfully used for the degradation of rhodamine B in a discoloration pathway to reduce the dyes during photocatalytic processes. The photodegradation of rhodamine B under solar-light irradiation showed the possible reaction. The breakdown of rhodamine dye followed the mineralization of dyes leading to CO2, H2O, NO3, and NH4+, which decreased the GSH@Ag NCs during the photocatalytic process, as mentioned in Fig. S2.† We propose that after the photoillumination of the semiconductor, electrons were created in the conduction band (CB) while holes were generated in the valence band (VB). A reaction between the photogenerated electrons and oxygen (O2) molecules occurred with the creation of superoxide anion radicals (˙O2−). Finally, active species, such as hydroxyl radicals (˙OH), could be generated. The pollutant was oxidized by the radicals to CO2, H2O, and some low molecular weight products (Fig. 11).684. Conclusion
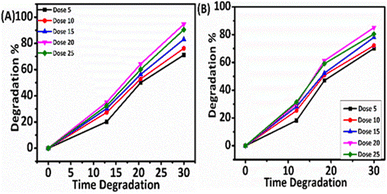
In summary, we devoloped a novel methodology to synthesize a sample and water-soluble thiol-protected GSH@Ag NCs through a one-pot synthesis, highly efficiently, and activated these for use in the photocatalytic degradation of dye pollutants. Visible-light photodegradation is one of the cheapest and straightforward ways to remove xanthene dyes (Erythrosine B and Rhodamine B) from wastewater. The unique properties of the ultrasmall GSH@Ag NCs, such as facileness for use with good solubility in aqueous medium and more active sites due to their ultrasmall size, leads to their strong photocatalytic activity. We proposed the visible-light catalytic degradation of xanthene dyes under two different light sources (solar light and white LED light). A more efficient performance and shorter time duration was observed in the photodegradation under solar light as compared to the LED white-light. Under the solar light, the rate of degradation was investigated with different concentrations, and the highest rate of degradation was observed at 20 mg at pH 7.0, which showed best dye degradation capability. Further, this synthetic approach can be used in large-scale industrial wastewater purification. Atomically precise and ultrasmall size GSH@Ag NCs could offer high-efficiency performances in many fields, including bio-medical, antimicrobial, antioxidant, tumor targeting, cancer treatment, and bio-sensing theranostics.Conflicts of interest
There are no conflicts to declare.Acknowledgements
We acknowledge financial support from the National Natural Science Foundation of China (21631001, 21871001), the Ministry of Education, and the University Synergy Innovation Program of Anhui Province (GXXT-2020-053), and the 211 Project of Anhui University.References
- S. Samuchiwal, D. Gola and A. Malik, J. Hazard. Mater., 2021, 402, 123835 CrossRef CAS PubMed.
- M. Bansal, P. K. Patnala and T. Dugmore, Curr. Res. Green Sustainable Chem., 2020, 3, 3100036 Search PubMed.
- M. T. Amin, A. A. Alazba and U. Manzoor, Adv. Mater. Sci. Eng., 2014, 24, 825910 Search PubMed.
- M. S. Anantha, S. Olivera, C. Hu, B. K. Jayanna, N. Reddy, K. Venkatesh, H. B. Muralidhara and R. Naidu, Environ. Technol. Innov., 2020, 10, 100612 CrossRef.
- M. R. Al-Mamun, S. Kader, M. S. Islam and M. Z. H. Khan, J. Environ. Chem. Eng., 2019, 7, 103248 CrossRef CAS.
- S. Samuchiwal, D. Gola and A. Malik, J. Hazard. Mater., 2021, 402, 123835 CrossRef CAS PubMed.
- A. V. Samrot, H. H. Ali, J. Selvarani, E. Faradjeva, P. Raji and P. Prakash, Curr. Res. Green Sustainable Chem., 2021, 4, 100066 CrossRef CAS.
- D. Gola, A. Bhattacharya, P. Dey, A. Malik and S. Z. Ahammad, J. Health Pollut., 2020, 10, 200610 CrossRef PubMed.
- D. Gola, A. Malik, Z. A. Shaikh and T. R. Sreekrishnan, Environ. Processes, 2016, 3, 40710 Search PubMed.
- S. Khan and A. Malik, Environ. Sci. Pollut. Res., 2018, 25, 4446 CrossRef CAS PubMed.
- B. Fatima, S. I. Siddiqui, R. Ahmed and S. A. Chaudhry, Water Resour. Ind., 2019, 22, 100119 CrossRef.
- F. H. AlHamedi, M. A. Rauf and S. S. Ashraf, Desalination, 2009, 239, 159 CrossRef CAS.
- S. Su, W. Guo, Y. Leng, C. Yi and Z. Ma, J. Hazard. Mater., 2013, 244, 736 CrossRef PubMed.
- M. Khan, A. Khan, H. Khan, N. Ali, S. Sartaj, S. Malik, N. Ali, H. Khan, S. Shah and M. Bilal, Int. J. Biol. Macromol., 2021, 182, 866 CrossRef CAS PubMed.
- A. Safavi and S. Momeni, J. Hazard. Mater., 2012, 201, 125 CrossRef PubMed.
- T. Robinson, G. McMullan, R. Marchant and P. Nigam, Bioresour. Technol., 2001, 77, 247 CrossRef CAS PubMed.
- C. Wang, A. Yediler, D. Lienert, Z. Wang and A. Kettrup, Chemosphere, 2003, 52, 1225 CrossRef CAS PubMed.
- R. Maas and S. Chaudhari, Process Biochem., 2005, 40, 699 CrossRef CAS.
- V. K. Gupta, R. Jain, A. Mittal, M. Mathur and S. Sikarwar, J. Colloid Interface Sci., 2007, 309, 464 CrossRef CAS PubMed.
- S. H. Lin and C. F. Peng, Water Res., 1994, 28, 277 CrossRef CAS.
- M. Chander and D. Arora, Dyes Pigments, 2007, 72, 192 CrossRef CAS.
- Y. H. Shih, C. P. Tso and L. Y. Tung, Environ. Eng. Manag. J., 2010, 20, 137 CAS.
- N. P. Moraes de, F. N. Silva, M. L. C. P. Silva da, T. M. B. Campos, G. P. Thim and L. A. Rodrigues, Mater. Chem. Phys., 2018, 214, 95 CrossRef.
- S. Asadzadeh-Khaneghah and A. Habibi -Yangjeh, J. Clean. Prod., 2020, 276, 124319 CrossRef CAS.
- A. Habibi-Yangjeh, S. Asadzadeh-Khaneghah, S. Feizpoor and A. Rouhi, J. Colloid Interface Sci., 2020, 580, 503 CrossRef CAS PubMed.
- C. Fang, Z. Hao, Y. Wang, Y. Huang, D. Huang and X. Liu, J. Clean. Prod., 2023, 405, 136912 CrossRef CAS.
- X. Liu, W. Hou, Y. Huang, H. Zhao, Z. Song and Y. Huang, J. Chem. Eng., 2022, 433, 133822 CrossRef CAS.
- K. Nakata and A. Fujishima, J. Photochem. Photobiol., C, 2012, 13, 169 CrossRef CAS.
- K. Lee, C. W Lai, K. S. Ngai and J. C Juan, Water Res., 2016, 88, 428 CrossRef CAS PubMed.
- N. Ferraz, F. C. mF Marcos, A. E. Nogueira, A. S. Martins, M. R. V. Lanza, E. M. Assaf and Y. J. O Asencios, Mater. Chem. Phys., 2017, 198, 331 CrossRef CAS.
- D. Barreca, P. Fornasiero, A. Gasparotto, V. Gombac, C. Maccato, T. Montini and E. Tondello, ChemSusChem, 2009, 2, 230 CrossRef CAS PubMed.
- M. Pirhashemi, A. Habibi-Yangjeh and R. S. Pouran, J. Ind. Eng. Chem., 2018, 62, 1 CrossRef CAS.
- M. Shekofteh-Gohari, A. Habibi-Yangjeh, M. Abitorabi and A. Rouhi, Crit. Rev. Environ. Sci. Technol., 2018, 48, 806 CrossRef CAS.
- D. Chatterjee and S. Dasgupta, J. Photochem. Photobiol. C Photochem. Rev., 2005, 6, 186 CrossRef CAS.
- K. Maeda and K. Domen, J. Phys. Chem. Lett., 2010, 1, 2655 CrossRef CAS.
- J. Luo, S. Zhang, M. Sun, L. Yang, S. Luo and J. C. Crittenden, ACS Nano, 2019, 13, 9811 CrossRef CAS PubMed.
- J. Hu, C. Chen, H. Yang, F. Yang, J. Qu, X. Yang, W. Sun, L. Dai and C. M. Li, Appl. Catal., B, 2022, 317, 121723 CrossRef CAS.
- J. Hu, X. Li, J. Qu, X. Yang, Y. Cai, T. Yang, F. Yang and C. M. Li, J. Chem. Eng., 2023, 453, 139957 CrossRef CAS.
- J. Zheng, J. T. Petty and R. M. Dickson, J. Am. Chem. Soc., 2003, 125, 7780 CrossRef CAS PubMed.
- L. Shang, S. J. Dong and G. U. Nienhaus, Nano Today, 2011, 6, 401 CrossRef CAS.
- T. Vosch, Y. Antoku, J. C Hsiang, C. I. Richards, J. I. Gonzalez and R. M. Dickson, Proc. Natl. Acad. Sci. U. S. A., 2007, 104, 12616 CrossRef CAS PubMed.
- X. Yuan, Y. Tay, X. Dou, Z. Luo, D. T. Leong and J. Xie, Anal. Chem., 2013, 85, 1913 CrossRef CAS PubMed.
- M. Mathur, D. Gola, R. Panja, A. Malik and S. Z Ahammad, Environ. Sci. Pollut. Res., 2018, 25, 345 CrossRef CAS PubMed.
- L. Zhang, P. Liu and Z. X. Su, Polym. Degrad. Stab., 2006, 91, 2213 CrossRef CAS.
- Q. Deng, W. Zhang, T. Lan, J. Xie, W. Xie, Z. Liu and M. Wei, Eur. J. Inorg. Chem., 2018, 13, 1506 CrossRef.
- H. Zhu, N. Goswami, Q. Yao, T. Chen, Y. Liu, Q. Xu and J. Xie, J. Mater. Chem. A, 2018, 6, 1102 RSC.
- X. Xie, M. Liu, C. Wang, L. Chen, J. Xu, Y. Cheng, H. Dong, F. Lu, W.-H. Wang, H. Liu and W. Wang, RSC Adv., 2016, 6, 953 RSC.
- A. Kahtani and A. Abdullah, J. Biomater. Nanobiotechnol., 2017, 8, 66 CrossRef.
- W. Cui, W. An, L. Liu, J. Hu and Y. Liang, Appl. Surf. Sci., 2014, 319, 305 CrossRef.
- S. Abbasi and M. Hasanpour, J. Mater. Sci. Mater. Electron., 2017, 28, 1314 Search PubMed.
- R. Jasrotia, V. Ankit, V. Ritesh, A. Jahangeer, K. Sachin, G. K. Godara, M. Amir, A. Tokeer and K. Susheel, J. Water Proc. Eng., 2022, 48, 102865 CrossRef.
- T. You, S. Sun, X. Song and S. Xu, Cryst. Res. Technol., 2009, 44, 860 CrossRef.
- B. Adhikari and B. Arindam, Chem. Mater., 2010, 15, 4371 Search PubMed.
- H. Chen, Z. Li and Z. Qin, ACS Appl. Nano Mater., 2019, 2, 3006 Search PubMed.
- S. Pethkar, M. Aslam, I. Mulla, P. Ganeshan and K. Vijayamohanan, J. Mater. Chem., 2001, 11, 1714 RSC.
- H. Qian, M. Zhu, Z. Wu and R. Jin, Acc. Chem. Res., 2012, 45, 1479 CrossRef PubMed.
- L. Peng, B. Yucui, S. Xiaoqing, Y. Hong-Chang, C. Haijun and L. Zhongjun, Chin. J. Chem., 2020, 31, 2875 Search PubMed.
- A. Dasari and G. Veerabhadram, Mater. Today Commun., 2019, 19, 169 Search PubMed.
- T. Goswami, M. Singh, K. M. Reddy and A. K. Mishra, ChemistrySelect, 2018, 3, 10892 CrossRef CAS.
- T. Goswami, A. Bheemaraju, A. K. Sharma and S. Bhandari, Colloid Polym. Sci., 2021, 299, 925 CrossRef CAS.
- M. Ghali, M. Benltifa, C. Brahmi, L. Elbassi, F. Dumur, C. Simonnet-Jégat and J. Lalevée, Eur. Polym. J., 2021, 159, 110743 CrossRef CAS.
- L. Chen, F. He, N. Zhao and R. Guo, Appl. Surf. Sci., 2017, 420, 669 CrossRef CAS.
- S. Kalele, A. C. Deshpande, S. B. Singh and S. K. Kulkarni, Bull. Mater. Sci., 2008, 31, 541 CrossRef CAS.
- N. Gupta, H. P. Singh and R. K. Sharma, J. Mol. Catal. Chem., 2011, 335, 248 CrossRef CAS.
- Z. Yu, F. Li and L. Sun, Energy Environ. Sci., 2015, 8, 760 RSC.
- W. Taixing, L. Guangming, Z. Jincai, H. Hisao and S. Nick, J. Phys. Chem. B, 1999, 103, 48627 Search PubMed.
- M. Hasnat, I. A. Siddiquey and S. M. Saiful, Indian J. Chem., 2002, 42, 18657 Search PubMed.
- K. Wannakan, K. Khansamrit, T. Senasu, T. Chankhanittha and S. Nanan, Antibiotics, 2022, 11, 1590 CrossRef CAS PubMed.
- J. J. Zhang, X. Liu, T. Ye, G. P. Zheng, X. C. Zheng, P. Liu and X. X. Guan, J. Alloys Compd., 2017, 698, 827 CrossRef.
- G. Dong and L. Zhang, J. Mater. Chem., 2012, 22, 1166 Search PubMed.
- Z. Chen, D. Li, W. Zhang, Y. Shao, T. Chen, M. Sun and X. Fu, J. Phys. Chem. C, 2009, 113, 4440 Search PubMed.
- N. Soltani, E. Saion, W. M. M. Yunus, M. Erfani, M. Navasery, G. Bahmanrokh and K. Rezaee, Appl. Surf. Sci., 2014, 290, 447 CrossRef.
- S. D. Khairnar, A. N. Kulkarni, S. G. Shinde, S. D. Marathe, Y. V. Marathe, S. D. Dhole and V. S. Shrivastava, J. Photochem. Photobiol., 2022, 6, 100030 CrossRef.
- E. Parvizi, R. Tayebee, E. Koushki, M. F. Abdizadeh, B. Maleki, P. Audebert and L. Galmiche, RSC Adv., 2019, 9, 23831 RSC.
- T. Goswami, A. Bheemaraju, A. K. Sharma and S. Bhandari, Colloid Polym. Sci., 2021, 299, 936 CrossRef.
- T. Goswami, M. Singh, K. M. Reddy and A. K. Mishra, ChemistrySelect, 2018, 3, 10899 CrossRef.
- D. Gola, N. Bhatt, M. Bajpai, A. Singh, A. Arya, N. Chauhan and Y. Agrawal, Curr. Res. Green Sustainable Chem., 2021, 4, 100132 CrossRef CAS.
- Y. Xiao, X. Tao, G. Qiu, S. Dai, P. Gao and B. Li, J. Colloid Interface Sci., 2019, 550, 109 CrossRef PubMed.
Footnote |
| † Electronic supplementary information (ESI) available. See DOI: https://doi.org/10.1039/d3na00227f |
| This journal is © The Royal Society of Chemistry 2023 |

