Fabrication of honeycomb-structured composite material of Pr2O3, Co3O4, and graphene on nickel foam for high-stability supercapacitors†
Yulin
Xin
,
Shixiang
Lu
 *,
Wenguo
Xu
* and
Shasha
Wang
School of Chemistry and Chemical Engineering, Beijing Institute of Technology, Beijing 100081, China. E-mail: shixianglu@bit.edu.cn; xuwg60@bit.edu.cn
First published on 2nd December 2022
Abstract
Hydrothermal synthesis and annealing process were used to create a honeycomb-structured composite electrode material on nickel foam substrate that contained praseodymium oxide (Pr2O3), cobalt oxide (Co3O4), and reduced graphene oxide (rGO) (named as Pr2O3/Co3O4/rGO/NF). The Pr2O3/Co3O4/rGO/NF (PCGN) composite electrode material was created without the need for a binder and can be employed right away to create a supercapacitor. This honeycomb composite is further grown by the mesh structure of Pr2O3 and Co3O4, which has good electrical conductivity. This nanomorphology not only improves the specific surface area of the material but also facilitates the improvement of electron transfer efficiency. The synthesized electrode material has excellent electrochemical properties due to its special morphology and excellent conductivity, and its performance is better than that of praseodymium oxide and cobalt oxide alone, with a specific capacitance of 3316 F g−1 in the three-electrode system at a current density of 1 A g−1. After forming a symmetrical supercapacitor device, the energy density is 74.8 W h kg−1 and the power density is 300 W kg−1 at 0.5 A g−1. The capacitance retention is 82% even after 35![[thin space (1/6-em)]](https://www.rsc.org/images/entities/char_2009.gif) 000 cycles at 2 A g−1.
000 cycles at 2 A g−1.
1. Introduction
Energy is an important component that drives the operation and development of society. Clean and sustainable energy sources should be utilized immediately to take the place of fossil fuels due to the current energy crisis and environmental damage brought on by the overuse of these fuels. And the development of new and efficient energy storage devices has become the key to the problem.1–3 Due to their high power density, high energy density, and extended cycle life, supercapacitors are becoming a hot topic in academia. Supercapacitors (SCs) are used in a variety of industries, like aerospace, wearable technology, electric automobiles, and other areas. Supercapacitors are primarily split into three groups based on how energy is stored: double-layer supercapacitors (EDLC), pseudocapacitors, and hybrid supercapacitors.4–6 Double-layer supercapacitors are mainly used for energy storage by using the high specific surface area of carbon-based materials.7 In contrast to double-layer supercapacitors, the principal method of energy storage in pseudocapacitors is a quick and reversible Faraday reaction on the surface of electrode materials.8,9 As a result, it is more capacitive and has a higher energy density than a double-layer supercapacitor.Metal oxides, particularly transition metal oxides such as MnO2,10,11 RuO2,12 Co3O4,13–16 and others, are good electrode materials for pseudocapacitors due to their high theoretical specific capacitance and abundance. As a transition metal oxide Co3O4, has a very optimal theoretical specific capacitance as well as the benefits of environmental protection and low cost, making it an excellent material for supercapacitors.14,16–18 Li et al. claim that they created Co3O4/MnO2/Co(OH)2 composite electrodes using a straightforward hydrothermal process along with the proper heat treatment and electrodeposition and that these electrodes had a high specific capacitance of 3022.2 F g−1 at a current density of 10 A g−1.18 Mn@Co3O4-MSs modified electrodes were created by Chen et al. using solvothermal reaction and annealing treatment, and they displayed a high specific capacitance of 773 F g−1 at 1 A g−1.19 Co3O4/NiO/Mn2O3 has a significant surface area (123.9 m2 g−1) and high specific capacitance of 3652 mF cm2 at 1 mA cm2 current density.11 With its simple aggregation, poor conductivity, and significant volume change during charging and discharging, Co3O4 has a limited range of applications. Currently, adding other compounds can help to solve the issues of low multiplicity and poor conductivity, and materials based on carbon are a great choice. Graphene conductor is one of the carbon-based materials that are particularly well suited for combining with the Co3O4 phase because it has excellent electrical performance, a large specific surface area, and good flexibility.20,21 For instance, the RGO/Co3O4 composite demonstrated excellent electrochemical cycling stability with capacitance retention of more than 122% after 5000 continuous charge and discharge cycles and displayed a high specific capacitance of 331 F g−1 at a current density of 5 A g−1.22 By using a straightforward hydrothermal process, Liu et al. created GO(rGO)/Co3O4 composites.23 The addition of rGO increased the electrode material's specific surface area and conductivity, and the composite electrode demonstrated a capacitance of 263.0 F g−1 in a two-electrode supercapacitor at a current density of 0.2 A g−1. A multi-composite material also performs better than a single metal material when compared to it because of the synergistic impact between the many materials, which not only helps to compensate for the shortcomings of a single material but also promises to enhance performance even further.11,13,15,18 The specific capacitance values of Co3O4–Ni3S4–rGO electrodes were 899 F g−1 at a current density of 0.5 A g−1;13 rGO/Co3O4@Fe2O3 hybrid network as electrodes revealed a high capacitance of 784 F g−1 at 1 A g−1;15 NiO/Co3O4/NCDs nanosheets as electrodes exhibited a high specific capacity of 976.3 C g−1 (1775 F g−1) at 1 A g−1.17 Overall, creating composite nanomaterials by mixing graphene with the oxides of other metals is a good solution to address current issues of Co3O4.
Rare earth elements are abundant in the crust of the earth and have a distinct 4f electronic structure, which allows them to exhibit outstanding electrochemical capabilities through a multi-energy leap.24–26 In addition, the use of rare earth aids in modifying and enhancing the morphological structure and improving electrode performance.27–30 They receive a lot of attention in the field of energy storage because of all their distinctive qualities. La–Co LDHs as the working electrode had a high specific capacitance of 2162 C g−1 at a high current density of 10 A g−1;31 MnO2/La2O3 composites synthesized by the hydrothermal method had a specific capacitance of 245.4 F g−1 at 0.3 A g−1,28 which was 1.5 times higher than MnO2; MnO2/CeO2 has a specific capacitance of 274.3 F g−1 at a current density of 0.5 A g−1 which is much higher than MnO2 (190.2 F g−1) and CeO2 (66.2 F g−1).29 Due to their incomplete 4f shells, rare earths operate as transient electron carriers and can speed up redox reactions when combined with cobalt trioxide. The structural flaws that result from compounding together can be seen by scanning electron microscopy (SEM).27 Therefore, composing with rare earth elements effectively increases specific capacitance and cycle life and optimizing electrodes by producing oxygen vacancies, reducing charge transfer resistance, facilitating easier electrolyte ion diffusion, accelerating oxygen ion migration, controlling morphology and grain size.28,30 Praseodymium, which is a rare earth with a high content and also has a distinctive 4f electron energy level structure, it has been widely employed in many industries and is a suitable material for supercapacitors,32 certain studies like Pr6O11@NiCo2O4 have a capacitance of 1635 F g−1 at a current density of 0.5 mA cm−2;33 NiFeCoPrO–Au/NF electrode exhibits a capacitance of 1792 F g−1 at a current density of 10 A g−1;34 PANI–Pr2O3–NiO–Co3O4 has a capacitance of 905 F g−1 at current density 1 A g−1 all confirm that.35,36
In this study, a nickel foam substrate was used to create a thin-layered PCGN electrode material with good multiplicative performance through a straightforward hydrothermal reaction with the coexistence of nanosheet layers and nanowires. This experiment's synthesis method is very simple, and the composites are grown directly on NF without the use of conductive agents, surfactants, or adhesives to connect, which reduces damage to the three-dimensional skeleton of nickel foam,35 avoids clogging and damage to the active material, ensures higher conductivity, and reduces contact resistance between the electroactive material and NF. As a result of the aqueous symmetric supercapacitor (SSC) device made of two PCGN electrodes, which has 300 W kg−1 power density and 74.8 W h kg−1 excellent energy density as well as remarkable stability even after 35![[thin space (1/6-em)]](https://www.rsc.org/images/entities/char_2009.gif) 000 cycles. It brings hope for the preparation of environmentally friendly and inexpensive storage devices.
000 cycles. It brings hope for the preparation of environmentally friendly and inexpensive storage devices.
2. Experiment
2.1. Materials and reagents
Shanghai Aladdin Biochemical Technology Co. Ltd supplied urea (CH4N2O) and cobalt acetate tetrahydrate (C4H6CoO4·4H2O). Saen Chemical Technology Shanghai Co., Ltd supplied praseodymium acetate pentahydrate (CH3CO2)3Pr·4H2O). Pristine graphite powder, hydrogen peroxide (H2O2, 30 wt%), potassium permanganate (KMnO4), hydrogen chloride (HCl, 36–38 wt%), sulfuric acid (H2SO4, 95–98 wt%), potassium hydroxide (KOH), sodium nitrate (NaNO3), acetone (CH3COCH3, 99.5 wt%) and ethanol (C2H5OH, 99.5 wt%) was provided by The Beijing Fine Chemical Co. Ltd. Purchased the nickel foam (NF) from Kunshan Toll Hui Electronics Technology Co. Ltd. All of the compounds were analytical grade, and they were used just as they were received with no additional purification.2.2. Material preparation and processing
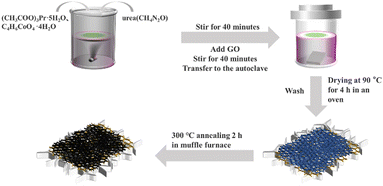
Finally, the Pr2O3/Co3O4/rGO/NF precursor was placed in a crucible and annealed at 300 °C for 2 h. On nickel foam, the average amount of Pr2O3/Co3O4/rGO growth was 1.5 ± 0.07 mg cm−2. The preparation process of Pr2O3/Co3O4/NF, Pr2O3/rGO/NF, Co3O4/rGO/NF and rGO/NF is shown in Fig. S1–S4 (ESI†).
2.3. Characterization techniques
X-ray electron spectrometer (XPS, model PHI 5300, Physical Electronics, USA) and Bruker D8 Advance X-ray powder diffractometer equipped with Cu Kα radiation (λ = 0.15418 nm) in the range of 2θ = 10°–80° (XRD), to analyze the composition and crystal structure of the material. A Leica DMLM microscope, a Renishaw InVia confocal Raman spectrometer, and an argon ion laser (514.5 nm, model Stellar-REN, Modu-Laser) as the excitation source was used to collect Raman spectra. The surface morphology and structure of the sample electrodes were examined using scanning electron microscopy (SEM, Quanta 600, FEI) with an energy dispersive spectrometer (EDS, Oxford, Gemini 300), transmission electron microscopy (TEM, JEM-2100, JEOL), and high-resolution transmission electron microscopy (HRTEM) to analyze. The surface area was determined by N2 adsorption and desorption tests using Brunauer–Emmett–Teller (BET) apparatus, and the pore size distribution was computed by the Barret–Joyner–Halenda (BJH) method.2.4. Electrochemical testing
A three-electrode system in an electrochemical workstation (CHI 760E, CH Instruments) was used to measure the electrochemical properties of the electrode materials. The saturated calomel electrode served as the reference electrode, the platinum electrode served as the counter electrode, and the prepared electrode served as the working electrode. All electrochemical tests were performed in an aqueous electrolyte of 6 mol L−1 KOH.Eqn (1) gives the mass-specific capacitance measured in the three-electrode system.
 | (1) |
 | (2) |
 | (3) |
![[thin space (1/6-em)]](https://www.rsc.org/images/entities/char_2009.gif) 000 stability tests showed that the composite electrode has high electrochemical performance and cycling stability.
000 stability tests showed that the composite electrode has high electrochemical performance and cycling stability.
3. Results and discussion
3.1. Composition and structure
Fig. 2a displays the results of an X-ray diffraction (XRD) analysis used to confirm the crystal structure of Pr2O3/Co3O4/rGO/NF. According to the PDF standard card (JCPDS No. 22-0880), the diffraction peaks of 2θ at 33.7° and 39.1° correspond to the crystallographic planes of Pr2O3 (3 1 1), (−1 1 3) and belongs to the monoclinic phase.37 Also, a comparison of the standard card (JCPDS No. 42-1467) demonstrates that the Co3O4 (1 1 1) and (5 1 1) crystal faces are represented by the diffraction peaks of 2θ at 19° and 59.4°, and belongs to the cubic phase.38 According to the PDF standard card (JCPDS No. 04-0850), the broad diffraction peak of 2θ at 20° corresponds to the (0 0 2) crystal face of rGO.39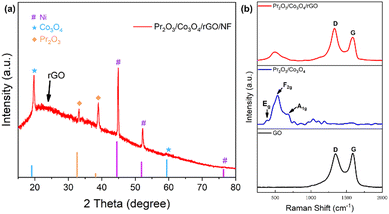 | ||
| Fig. 2 (a) XRD pattern of the Pr2O3/Co3O4/rGO/NF, (b) Raman spectra of Pr2O3/Co3O4/rGO/NF, Pr2O3/Co3O4/NF and GO. | ||
The diffraction peaks of 2θ at 44.5°, 51.8°, and 76.4° correspond to the (1 1 1), (2 0 0), and (2 2 0) crystallographic planes of singlet Ni. Since no additional impurity peaks were discovered in the samples, it is presumed that Pr2O3/Co3O4/rGO/NF was successfully prepared by the experimental scheme.
Further study of whether graphene has been successfully loaded on the electrode material has been carried out by using Raman spectroscopy for Pr2O3/Co3O4/rGO/NF, Pr2O3/Co3O4/NF, and rGO. All three samples were tested. It can be seen from Fig. 2b that Pr2O3/Co3O4/rGO/NF and rGO both exhibit more pronounced D-band and G-band characteristics of graphene, which are located at 1330 cm−1 and 1586 cm−1. The D-band is generated by the stretching vibration of graphene sp3 hybridization and the G-band is caused by the stretching vibration of sp2 hybridization.39 The regularity of the graphene structure can be examined by calculating the intensity ratio of the D-band and G-band. Calculations indicated that rGO has ID/IG ratio of 0.97, whereas Pr2O3/Co3O4/rGO/NF has its ID/IG ratio of 1.38. According to earlier research, the rise in the ID/IG value is a clear indication that the sp2 hybridization structure has been disturbed. Therefore, it can be concluded that a portion of the sp2 heterostructure in rGO is disrupted as a result of the heightened electronic interaction between Pr2O3, Co3O4, and rGO. The characteristic peaks associated with rGO are not present in the sample Pr2O3/Co3O4. Meanwhile, the characteristic peaks at 534 cm−1 and 662 cm−1 in Pr2O3/Co3O4 can be attributed to F2g and A1g of Co3O4,40,41 and the characteristic peak at 385 cm−1 is mainly owing to Eg of Pr2O3.37,42 The study can demonstrate both the successful synthesis of ternary composite samples and the presence of rGO in Pr2O3/Co3O4/rGO/NF samples.
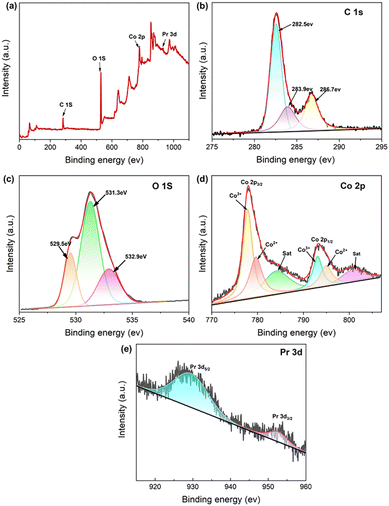
In addition, XPS analysis of Pr2O3/Co3O4/rGO/NF was also performed (Fig. 3a–e). The existence of the four elements Pr, Co, C, and O in the manufactured material is indicated by the scan region in Fig. 3a from 0 to 1100 V. The high-resolution spectra of C 1s are shown in Fig. 3b, with the peaks at 282.6 eV, 283.9 eV, and 286.7 eV, which correspond to C![[double bond, length as m-dash]](https://www.rsc.org/images/entities/char_e001.gif) C, C–C, and O–C
C, C–C, and O–C![[double bond, length as m-dash]](https://www.rsc.org/images/entities/char_e001.gif) C. Three peaks in the O 1s spectra, with energies of 529.5 eV, 531.3 eV, and 532.9 eV, seen in Fig. 3c. Where 529.5 eV corresponds to the bonds in metal oxides, 531.3 eV corresponds to the hydroxide oxygen-containing bonds, and 532.9 eV corresponds to physisorbed oxygen.43 It can be seen that some oxygen elements in PCGN exist as metal oxides. In Fig. 3d, the results of Co 2P tests show that Co has two valence states. The peak of Co 2p3/2 spin orbitals is 778.1 eV and the peak of Co 2p1/2 spin orbitals is 794.1 eV, and there are two weak satellite peaks located at 784.1 eV and 800.7 eV near both of them, the difference in binding energy between Co 2p1/2 and Co 2p3/2 is about 16 eV, indicating the existence of the interconversion of Co2+ and Co3+ during the redox reaction.44
C. Three peaks in the O 1s spectra, with energies of 529.5 eV, 531.3 eV, and 532.9 eV, seen in Fig. 3c. Where 529.5 eV corresponds to the bonds in metal oxides, 531.3 eV corresponds to the hydroxide oxygen-containing bonds, and 532.9 eV corresponds to physisorbed oxygen.43 It can be seen that some oxygen elements in PCGN exist as metal oxides. In Fig. 3d, the results of Co 2P tests show that Co has two valence states. The peak of Co 2p3/2 spin orbitals is 778.1 eV and the peak of Co 2p1/2 spin orbitals is 794.1 eV, and there are two weak satellite peaks located at 784.1 eV and 800.7 eV near both of them, the difference in binding energy between Co 2p1/2 and Co 2p3/2 is about 16 eV, indicating the existence of the interconversion of Co2+ and Co3+ during the redox reaction.44
According to previous studies, when rGO is present a weakly oscillating satellite peak of about 784.1 eV is caused by a strong interaction between Co3O4 and rGO via Co–O.45 Further analysis using the Gaussian fitting approach reveals that the characteristic peaks of Co3+ contain 777.9 eV and 793.1 eV, while the characteristic peaks of Co2+ contain 779.6 eV and 794.9 eV, confirming the presence of Co(II)/Co(III) in the sample.46 Finally, it can be seen from Fig. 3e Pr 3d3/2 binding energies (BEs) of Pr2O3 range from 929.5 to 952.6 eV.47 The outcomes are in line with that the Pr 3d5/2 and the claimed binding energy, proving that Pr2O3 was loaded onto nickel foam satisfactorily.
They were put through energy dispersive spectrometry (EDS) examinations in Fig. S5 and S6 (ESI†). As seen in the picture, Co, C, O, Pr, and Ni are evenly distributed throughout the Pr2O3/Co3O4/rGO/NF electrode sheet. This further verifies the existence of Pr elements on the Pr2O3/Co3O4/rGO/NF nanoflake.
Then, SEM and TEM tests were carried out to further determine the morphology and dimensions of the electrode material.
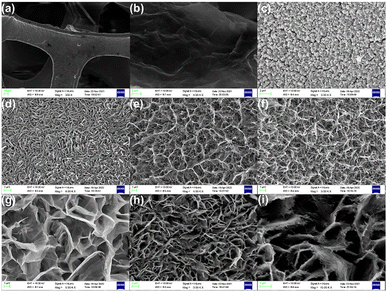
A scanning electron microscope (SEM) are displayed in Fig. 4. NF, rGO/NF, Pr2O3/NF, Pr2O3/rGO/NF, Co3O4/NF, Co3O4/rGO/NF, Pr2O3/Co3O4/NF, and Pr2O3/Co3O4/rGO/NF, are all depicted in Fig. 4a–i, with Fig. 4i displaying a detail magnification of Fig. 4h. It can be seen that the treated NF shown in 4a and b has a three-dimensional skeleton structure with a smooth surface, while the rGO grown on the NF shows a muslin shape with a folded surface. The nanosheet structure of Pr2O3 is tightly stacked; the nanowire structure of Co3O4 is disordered and the specific surface area is limited; both structures are not conducive to the entry and action of electrolyte, which limits the material's electrochemical performance.48Fig. 4d–f show that the dispersion of Pr2O3 nanosheets was helped by the addition of rGO. On the other hand, the nanowire morphology formed by Co3O4 on NF after the addition of rGO was more dispersed compared. This suggests that rGO can assist the electrode material in dispersing and changing shape, which helps in increasing the specific surface area. In Fig. 4g, SEM images of Pr2O3/Co3O4/NF are a honeycomb morphology generated by the co-growing of Pr2O3 and Co3O4. On nickel foam, the honeycomb shape exhibits a high growth density and a large specific surface area.49Fig. 4h and i show a honeycomb architecture in the Pr2O3/Co3O4/rGO on NF. The co-growing of Pr2O3 and Co3O4 after the addition of graphene leads to a mesh-like structure that is different from the nanosheets alone, as illustrated when the morphology is magnified.49,50 The overall specific surface area of the honeycomb shape is further increased due to the appearance of the mesh-like structure. This intertwining of mesh-like structures into a honeycomb-like morphology not only helps to increase the active specific surface area and ion transport channels of the material and improve the ion transport and electrolyte transport efficiency, but it also allows the electrode material to have sufficient expansion/contraction area during charging and discharging.51 This enhances the electrochemical performance of the active electrode material. However, rGO cannot be seen clearly in the materials, which may be because it combines with Pr2O3 and Co3O4 to form a mesh structure that makes it difficult to distinguish between them.
Pr2O3/Co3O4/rGO TEM images are displayed in Fig. 5a. The thin sheet shape of PCGN can be seen in the figures, which is in line with the SEM images that were captured. This morphology aids in increasing the electrode's conductivity and contact area with the electrolyte, and it is assumed that a comparable morphology aids in the electrode's energy storage and conversion rate. HRTEM imaging was used to further evaluate the composition of the PCGN, and Fig. 5c and d make it abundantly evident that the material has good textural qualities. Among these, the lattice spacings of 0.2303 nm and 0.2739 nm, which correspond to the (−1 1 3) and (3 1 1) crystal planes of Pr2O3, are depicted in Fig. 5c and d. The lattice spacing of 0.1556 nm in Fig. 5c corresponds to the (5 1 0) crystal planes of Co3O4. The results of TEM are in agreement with those of XRD, Raman spectroscopy, and XPS, all of which demonstrate that the electrode material is composed of Pr2O3, Co3O4, and rGO.
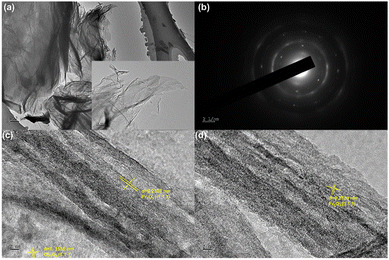 | ||
| Fig. 5 (a) TEM, (b) SEAD pattern of Pr2O3/Co3O4/rGO/NF, (c and d) HRTEM images, the inset of (a) is the magnified view of nanostructures. | ||
The nitrogen adsorption–desorption isotherms can be used to calculate the precise surface area and pore size of electrode material. It can be seen from the trends of the adsorption curves and the wedge-shaped openings created by the adsorption–desorption curves in Fig. 6a and b that the electrode materials exhibit a strong H3-type hysteresis line at high relative pressures, indicating that the isotherms have a typical type IV behavior.52Fig. 6a shows the adsorption–desorption curve of Pr2O3/Co3O4/rGO. The sample Pr2O3/Co3O4/rGO has adsorption pores that are primarily concentrated between 6 nm and 16 nm, as can be observed by combining the pore size distribution map with the data report. The BET model estimates that the electrode material has a specific surface area of 83.85 m2 g−1, while the specific surface area of Pr2O3/Co3O4 is about 69.77 m2 g−1. Combined with SEM and TEM images, it can be seen that the specific surface area of the electrode material itself is larger, and the addition of GO makes Pr2O3 and Co3O4 more uniformly dispersed and changes their morphological structure, which not only provides a large number of channels for a charge but also helps the rapid transfer of electrons, so that the electrode can be more fully in contact with the electrolyte, which in turn makes the electrode showed better electrochemical performance.
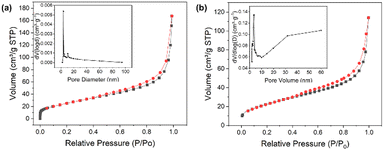 | ||
| Fig. 6 Nitrogen adsorption and desorption isotherm of (a) Pr2O3/Co3O4/rGO and (b) Pr2O3/Co3O4 with the pore size distribution in the insets respectively. | ||
3.2. Electrochemical testing and analysis
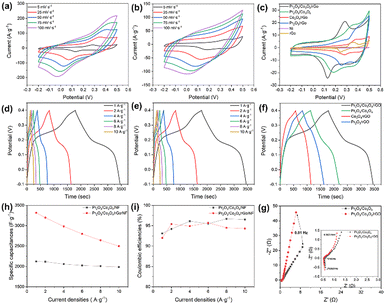
To investigate the electrode performance of the developed electrode materials, cyclic voltammetry (CV), galvanostatic charging and discharging (GCD), and electrochemical impedance spectroscopy (EIS) tests were performed using 6 mol L−1 KOH as the electrolyte in a three-electrode system. Results as shown in Fig. 7a–g.All sample's CV curves had the potential windows between −0.2 and 0.5 V; the scan rate was 5–100 mV s−1. Fig. 7a depicts the CV curves of the target electrode, and the overall shape of all curves showed evident redox peaks, showing that the specific capacitance of the electrode was primarily caused by pseudocapacitance behavior. The oxidation peak potential moves to a higher level as the scan rate rises, while the reduction peak potential moves to a lower level.19 All of these changes are accompanied by an increase in the peak current of the CV curves. This may be due to the fact that an increase in scan rate causes a rise in electrode surface current, which causes the active material's reaction to be incomplete and the reaction's reversibility to diminish.18 The fact that the shape of the CV curve is mostly unaffected by changes in scan rates. This shows the Pr2O3/Co3O4/rGO/NF electrode has good reversible and stable.
The possible charge storage mechanisms of Pr2O3 and Co3O4 in alkaline electrolytes are as follows.31,33
| Co3O4 + OH− + H2O ⇌ 3CoOOH + e− |
| CoOOH + OH− ⇌ CoO2 + H2O + e− |
| Pr2O3 + H2O ⇌ 2PrOOH |
| PrOOH + 2OH− ⇌ PrO(OH)3+ + 3e− |
The GCD curves for the electrode materials are shown in Fig. 7d, a voltage window of −0.1 V to 0.4 V was used with current densities ranging from 1 A g−1 to 10 A g−1. The Pr2O3/Co3O4/rGO/NF electrodes can be seen to have unique plateau areas during charging and discharging at various current densities, which is a feature of pseudocapacitor supercapacitors and is consistent with the CV curves. The duration of the plateau grows with decreasing current density, and its presence shows the occurrence of redox processes during charging and discharging. The charging and discharging time are the longest at the current density of 1 A g−1 in the diagram, and according to the formula for calculating specific capacitance, that specific capacitance is 3316 F g−1. For the current densities of 2, 4, 6, 8, and 10 A g−1, the corresponding specific capacitances are 3197 F g−1, 2981 F g−1, 2798 F g−1, 2614 F g−1, and 2498 F g−1. It has been discovered that as the current density increases, the specific capacitance of the Pr2O3/Co3O4/rGO/NF electrode dramatically decreases. The primary reason is that when the current density is low, the active material can be fully redoxed, resulting in a higher capacitance; as the current density increases, however, the rate of redox reaction increases, while the movement of ions is constrained by the diffusion rate; as a result, the redox reaction on the electrode can only be carried out on the electrode surface, and the specific capacitance decreases.
Fig. 7f shows the CGD curves of several electrodes at 1 A g−1, and it is clear that the Pr2O3/Co3O4/rGO/NF electrode has a considerably higher specific capacitance than the other sand is 1.5 times higher than that of the Pr2O3/Co3O4/NF electrode (2120 F g−1), indicating that the addition of graphene and other metal oxides facilitates the improvement of the electrode performance.
The coulombic efficiency (η) of the electrode can be calculated by the following equation.
 | (4) |
Electrochemical impedance spectroscopy (EIS) studies were carried out to further understand the performance of the Pr2O3/Co3O4/rGO/NF electrode. In the EIS test, the stabilization potentials of Pr2O3/Co3O4/NF and Pr2O3/Co3O4/rGO/NF were 0.007 V and −0.038 V, respectively. When comparing the Pr2O3/Co3O4/rGO/NF and Pr2O3/Co3O4/NF Nyquist plots, it can be seen that both images can be split into two categories: the high-frequency region and the low-frequency region. The initial impedance (Rs) is where the curve in the high-frequency region meets the horizontal axis; the charge transfer resistance (Rct) is where the arc diameter is in the high-frequency region, and the slope of the line in the low-frequency region is a crucial parameter for calculating the Warburg impedance resulting from proton diffusion.18
In Fig. 7g, it can be shown that the Pr2O3/Co3O4/NF electrode's semicircular arc direction in the high-frequency area is significantly bigger than that of the Pr2O3/Co3O4/rGO/NF electrode, indicating that the resistance of Pr2O3/Co3O4/rGO/NF is lower than that of Pr2O3/Co3O4/NF. Pr2O3/Co3O4/rGO/NF has a slope that is steeper than Pr2O3/Co3O4/NF in the low-frequency region, which suggests that the it has a lower Warburg impedance resistance and has a faster ion diffusion rate as well as lower electrolyte diffusion resistance. This may be related to the honeycomb structure of the Pr2O3/Co3O4/rGO/NF electrode The combination of rGO can significantly increase electrical conductivity, according to all the studies above.
Two identical electrodes were employed as the cathode and anode, respectively, and a sheet of filter paper was used as the septum to create a supercapacitor by utilizing the high capacitance and strong multiplication capability of Pr2O3/Co3O4/rGO/NF electrodes. Electrochemical studies were also carried out using 6 mol L−1 KOH as the electrolyte to gauge the performance of the symmetric supercapacitor.
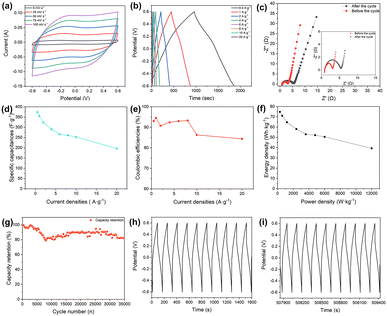
According to Fig. 8a–g, the supercapacitor (SC) device's test parameters were that scan rate of 5–100 mV s−1, and a voltage window between −0.6 V and 0.6 V for the CV curve; a voltage window of −0.6 V to 0.6 V, and a current density of 0.5–20 A g−1 for the GCD curve; and parameters for the EIS that ranged from 100 kHz to 0.01 Hz. The performance of the composed SC is depicted in Fig. 8a–g. In Fig. 8a the CV plot of assembled SC device is nearly rectangular and devoid of redox peaks, showing good multiplicity performance and optimum capacitance performance.28 The triangular shape of the GCD curve in Fig. 8b, which is symmetrical, shows that the device has good capacitive performance. From Fig. 8d, it was determined that the specific capacitance values of SC devices were 373.9, 355, 323.3, 290.3, 266, 260.7, 252.5, and 196.7 F g−1 for 0.5–20 A g−1.
It is evident that as the scan rate is increased, the specific capacitance of the SC likewise drops. Only the outer surface of the electrode can be employed for charge storage since the diffusion rate limits the passage of ions at higher scan rates.
In addition, it is necessary to verify the supercapacitor's cycle stability since the amount of time it is used is a crucial factor in determining how well it performs. The initial 10 cycles and the last 10 cycles’ photos do not differ significantly, as seen in Fig. 8h and i. The capacitance retention of the device diminishes as the number of charge/discharge cycles rises. The supercapacitor's specific capacitance retention rate is still above 82% after 35![[thin space (1/6-em)]](https://www.rsc.org/images/entities/char_2009.gif) 000 cycles of charging and discharging at a current density of 2 A g−1, demonstrating the constructed supercapacitor's strong cycling stability. The material is not completely activated at the start of the cycle, but after repeated charge and discharge cycles, a slight rise in specific capacitance occurs, which may be caused by the electrodes becoming activated throughout the constant charging and discharging process, exposing additional active sites.53,54 But the active electrode material undergoes volume expansion and is partially detached during prolonged cyclic charging and discharging; this causes an increase in resistance and a slight decrease in capacitor retention.55 This is why the curve falls, then rises, then falls again.
000 cycles of charging and discharging at a current density of 2 A g−1, demonstrating the constructed supercapacitor's strong cycling stability. The material is not completely activated at the start of the cycle, but after repeated charge and discharge cycles, a slight rise in specific capacitance occurs, which may be caused by the electrodes becoming activated throughout the constant charging and discharging process, exposing additional active sites.53,54 But the active electrode material undergoes volume expansion and is partially detached during prolonged cyclic charging and discharging; this causes an increase in resistance and a slight decrease in capacitor retention.55 This is why the curve falls, then rises, then falls again.
In Fig. 8c, the Nyquist plot for the SC device during the loop test is displayed. Rs does not significantly alter as the number of cycles rises. Rct rises after 35![[thin space (1/6-em)]](https://www.rsc.org/images/entities/char_2009.gif) 000 cycles, which may be a result of longer charging and discharging times that cause some active electrode materials to shed, while electrode material volume expansion impedes electrolyte diffusion and raises resistance.17 The resistance change is comparatively minor after the number of cycles, which shows that the SC device has strong stability.
000 cycles, which may be a result of longer charging and discharging times that cause some active electrode materials to shed, while electrode material volume expansion impedes electrolyte diffusion and raises resistance.17 The resistance change is comparatively minor after the number of cycles, which shows that the SC device has strong stability.
Meanwhile, it is calculated that when the power density of SC is, its energy density is, and the energy density and power density values obtained from this experiment are compared with the recently reported related studies, and the energy density and power density of the symmetric supercapacitor are found to be excellent.
Using the equation, it is determined that SC has an energy density of 74.8 W h kg−1 at a power density of 300 W kg−1. Even at a power density of 12![[thin space (1/6-em)]](https://www.rsc.org/images/entities/char_2009.gif) 000 W kg−1, SC also has an energy density of 39.3 W h kg−1. When comparing the results of our experiment's energy and power density measurements to those of recently published research in the same field, it is found that the symmetric super symmetrical supercapacitor has good stability (Table 1).
000 W kg−1, SC also has an energy density of 39.3 W h kg−1. When comparing the results of our experiment's energy and power density measurements to those of recently published research in the same field, it is found that the symmetric super symmetrical supercapacitor has good stability (Table 1).
| Electrode materials | Specific capacitance | Cycling performance | Energy density at power density | Ref. |
|---|---|---|---|---|
| Co3O4 nanoball/carbon aerogel | 350 F g−1 at 1 A g−1 | 210% (6000 cycles) | 23.82 W h kg−1 at 95.96 W kg−1 | 56 |
| Co3O4/rGO | 865 F g−1 at 1 A g−1 | 93.2% (5000 cycles) | No data | 16 |
| CuO/Co3O4 | 806.25 F g−1 at 2 A g−1 | 99.75% (2000 cycles) | 71.66 W h kg−1 at 800 W kg−1 | 57 |
| Co3O4/CeO2 | 1037.5 F g−1 at 2.08 A g−1 | 94.4% (5000 cycles) | No data | 58 |
| Co3O4/MnO2/Co(OH)2 | 3022.2 F g−1 at 10 A g−1 | 87.9% (5000 cycles) | 11.4 W h kg−1 at 666.7 W kg−1 | 18 |
| Pr-doped Co3O4 composites | 1625 F g−1 at 2 A g−1 | 98% (5000 cycles) | 42.3 W h kg−1 at 240 W kg−1 | 32 |
| NiFeCoPrO–Au/NF | 1792 F g−1 at 10 A g−1 | 99.5% (30![[thin space (1/6-em)]](https://www.rsc.org/images/entities/char_2009.gif) 000 cycles) 000 cycles) |
20.94 W h kg−1 at 589 W kg−1 | 34 |
| Pr6O11@NiCo2O4 | 1635 F g−1 at 0.5 mA cm−2 | 82% (1000 cycles) | 6.6 W h kg−1 at 150 W kg−1 | 33 |
| PANI–Pr2O3–NiO–Co3O4 | 905 F g−1 at 1 A g−1 | No data | 87.99 W h kg−1 at 2.6 kW kg−1 | 35 |
| Pr2O3/Co3O4/rGO/NF | 3197 F g−1 at 1 A g−1 | 91.8% (5000 cycles) | 74.8 W h kg−1 at 300 W kg−1 | This work |
82% (35![[thin space (1/6-em)]](https://www.rsc.org/images/entities/char_2009.gif) 000 cycles) 000 cycles) |
4. Conclusions
In conclusion, using a straightforward hydrothermal method to load Pr2O3, Co3O4, and graphene onto nickel foam and annealing the materials, we successfully created honeycomb-structured Pr2O3/Co3O4/rGO/NF electrode materials. According to an XRD test, Pr2O3 is in the monoclinic phase while Co3O4 is in the cubic phase. According to the study, the composite of Pr2O3, Co3O4 and rGO has superior electrochemical characteristics, and the inclusion of graphene can significantly reduce the build-up issue and increase electrical conductivity. Ion diffusion is enhanced by the material's honeycomb structure, which also offers enough room for expansion and contraction. The developed composite electrode material exhibits an exceptional specific capacitance of 3316 F g−1 at a current density of 1 A g−1. Furthermore, a symmetrical supercapacitor made of Pr2O3/Co3O4/rGO/NF performs admirably, with a specific capacitance of 373.9 F g−1 at 0.5 A g−1 and an energy density of 74.8 W h kg−1 at a power density of 300 W kg−1. In terms of stability, the current density of 2 A g−1 retains 82% of its charge after 35![[thin space (1/6-em)]](https://www.rsc.org/images/entities/char_2009.gif) 000 cycles. This research sheds new light on the selection of supercapacitor materials.
000 cycles. This research sheds new light on the selection of supercapacitor materials.
Conflicts of interest
There are no conflicts to declare.Acknowledgements
We gratefully acknowledge the National Natural Science Foundation of China (No. 21271027) for their support to this work.References
- J. R. Miller and P. Simon, Science, 2008, 321, 651–652 CrossRef CAS PubMed.
- M. Ren, J. Di and W. Chen, Batteries Supercaps, 2021, 4, 1279–1290 CrossRef CAS.
- Y. Zhou, P. Jin, Y. Zhou and Y. Zhu, Sci. Rep., 2018, 8, 9005 CrossRef PubMed.
- V. Augustyn, P. Simon and B. Dunn, Energy Environ. Sci., 2014, 7, 1597–1614 RSC.
- Y. Jiang and J. Liu, Energy Environ. Mater., 2019, 2, 30–37 CrossRef.
- Y. Wang, Y. Song and Y. Xia, Chem. Soc. Rev., 2016, 45, 5925–5950 RSC.
- N.-S. Choi, Z. Chen, S. A. Freunberger, X. Ji, Y.-K. Sun, K. Amine, G. Yushin, L. F. Nazar, J. Cho and P. G. Bruce, Angew. Chem., Int. Ed., 2012, 51, 9994–10024 CrossRef CAS.
- R. Kötz and M. Carlen, Electrochim. Acta, 2000, 45, 2483–2498 CrossRef.
- P. Simon and Y. Gogotsi, Nat. Mater., 2008, 7, 845–854 CrossRef CAS PubMed.
- B. Liu, Y. Liu, H. Chen, M. Yang and H. Li, ACS Sustainable Chem. Eng., 2019, 7, 3101–3110 CrossRef CAS.
- S. Li, Y. Duan, Y. Teng, N. Fan and Y. Huo, Appl. Surf. Sci., 2019, 478, 247–254 CrossRef CAS.
- Y. Wang, D. Gu, J. Guo, M. Xu, H. Sun, J. Li, L. Wang and L. Shen, ChemElectroChem, 2020, 7, 928–936 CrossRef CAS.
- M. B. Askari, S. M. Rozati, P. Salarizadeh and S. Azizi, Ceram. Int., 2022, 48, 16123–16130 CrossRef CAS.
- R. Zou, B. Wang, L. Zhu, L. Yan, F. Shi, Y. Sun, B. Shao, S. Zhang and W. Sun, Diamond Relat. Mater., 2022, 126, 109060 CrossRef CAS.
- Y. Wang, J. Zhou, Z. Zhou, H. Lv, B. Gu, K. Wang, Z. Chen, X. Yan, J. Zhang, W.-W. Liu and Y.-L. Chueh, Nanoscale, 2021, 13, 15431–15444 RSC.
- M. Aadil, M. F. Warsi, P. O. Agboola, M. F. Aly Aboud and I. Shakir, Ceram. Int., 2021, 47, 9008–9016 CrossRef CAS.
- Z. Ji, K. Liu, N. Li, H. Zhang, W. Dai, X. Shen, G. Zhu, L. Kong and A. Yuan, J. Colloid Interface Sci., 2020, 579, 282–289 CrossRef CAS PubMed.
- X. Li, R. Miao, B. Tao, F. Miao, Y. Zang and P. K. Chu, Solid State Sci., 2019, 95, 105941 CrossRef CAS.
- H. Chen, J. Wang, F. Liao, X. Han, Y. Zhang, C. Xu and L. Gao, Ceram. Int., 2019, 45, 11876–11882 CrossRef CAS.
- W. Gu and G. Yushin, Wiley Interdiscip. Rev.: Energy Environ., 2014, 3, 424–473 CAS.
- G. Xiong, C. Meng, R. G. Reifenberger, P. P. Irazoqui and T. S. Fisher, Electroanalysis, 2014, 26, 30–51 CrossRef CAS.
- Q. Li, X. Hu, Q. Yang, Z. Yan, L. Kang, Z. Lei, Z. Yang and Z. Liu, Electrochim. Acta, 2014, 119, 184–191 CrossRef CAS.
- G.-J. Liu, L.-Q. Fan, F.-D. Yu, J.-H. Wu, L. Liu, Z.-Y. Qiu and Q. Liu, J. Mater. Sci., 2013, 48, 8463–8470 CrossRef CAS.
- S. Arunachalam, B. Kirubasankar, D. Pan, H. Liu, C. Yan, Z. Guo and S. Angaiah, Green Energy Environ., 2020, 5, 259–273 CrossRef.
- H. Zhao, J. Xia, D. Yin, M. Luo, C. Yan and Y. Du, Coord. Chem. Rev., 2019, 390, 32–49 CrossRef CAS.
- H. Huang and J.-J. Zhu, Analyst, 2019, 144, 6789–6811 RSC.
- J. Theerthagiri, G. Durai, T. Tatarchuk, M. Sumathi, P. Kuppusami, J. Qin and M. Y. Choi, Ionics, 2020, 26, 2051–2061 CrossRef CAS.
- Y. Li, B. Guan, A. Maclennan, Y. Hu, D. Li, J. Zhao, Y. Wang and H. Zhang, Electrochim. Acta, 2017, 241, 395–405 CrossRef CAS.
- H. Zhang, J. Gu, J. Tong, Y. Hu, B. Guan, B. Hu, J. Zhao and C. Wang, Chem. Eng. J., 2016, 286, 139–149 CrossRef CAS.
- M. Majumder, R. B. Choudhary, A. K. Thakur and I. Karbhal, RSC Adv., 2017, 7, 20037–20048 RSC.
- D. B. Bailmare, P. Tripathi, A. D. Deshmukh and B. K. Gupta, Sci. Rep., 2022, 12, 3084 CrossRef CAS.
- D. Yang, M. Xu, X. Liang, J. Wang, W. Fang, C. Zhu and F. Wang, Electrochim. Acta, 2022, 406, 139815 CrossRef CAS.
- N. Chen, A. Younis, S. Huang, D. Chu and S. Li, J. Alloys Compd., 2019, 783, 772–778 CrossRef CAS.
- D. Zhang, L. Peng, Z. Yang, Y. Yang and H. Li, Inorg. Chem., 2019, 58, 15841–15852 CrossRef CAS.
- M. Naveed Ur Rehman, T. Munawar, M. S. Nadeem, F. Mukhtar, A. Maqbool, M. Riaz, S. Manzoor, M. N. Ashiq and F. Iqbal, Ceram. Int., 2021, 47, 18497–18509 CrossRef CAS.
- K. T. Kubra, A. Javaid, B. Patil, R. Sharif, A. Salman, S. Shahzadi, S. Siddique and S. Ghani, Ceram. Int., 2019, 45, 6819–6827 CrossRef CAS.
- T. Munawar, S. Yasmeen, M. Hasan, K. Mahmood, A. Hussain, A. Ali, M. I. Arshad and F. Iqbal, Ceram. Int., 2020, 46, 11101–11114 CrossRef CAS.
- Y. Li, W. Qiu, F. Qin, H. Fang, V. G. Hadjiev, D. Litvinov and J. Bao, J. Phys. Chem. C, 2016, 120, 4511–4516 CrossRef CAS.
- D. Mandal, P. Routh and A. K. Nandi, ChemistrySelect, 2017, 2, 3163–3171 CrossRef CAS.
- B. Xiao, K. Zhao, L. Zhang, T. Cai, X. Zhang, Z. Wang, J. Yuan, L. Yang, P. Gao and D. He, Catal. Commun., 2018, 116, 1–4 CrossRef CAS.
- J. Li, G. Lu, G. Wu, D. Mao, Y. Guo, Y. Wang and Y. Guo, Catal. Sci. Technol., 2014, 4, 1268–1275 RSC.
- J. E. Slimak, A. Sethi, T. Kolodiazhnyi and S. L. Cooper, Phys. Rev. Res., 2020, 2, 043169 CrossRef CAS.
- H. Al Kutubi, L. Rassaei, W. Olthuis, G. W. Nelson, J. S. Foord, P. Holdway, M. Carta, R. Malpass-Evans, N. B. McKeown, S. C. Tsang, R. Castaing, T. R. Forder, M. D. Jones, D. He and F. Marken, RSC Adv., 2015, 5, 73323–73326 RSC.
- S. Xiong, C. Yuan, X. Zhang, B. Xi and Y. Qian, Chemistry, 2009, 15, 5320–5326 CrossRef CAS PubMed.
- X. Ren, H. Fan, J. Ma, C. Wang, M. Zhang and N. Zhao, Appl. Surf. Sci., 2018, 441, 194–203 CrossRef CAS.
- S. Zhou, Z. Ye, S. Hu, C. Hao, X. Wang, C. Huang and F. Wu, Nanoscale, 2018, 10, 15771–15781 RSC.
- H. Ogasawara, A. Kotani, R. Potze, G. A. Sawatzky and B. T. Thole, Phys. Rev. B: Condens. Matter Mater. Phys., 1991, 44, 5465–5469 CrossRef CAS PubMed.
- H. Zhang, Z. Mo, R. Guo, N. Liu, M. Yan, R. Wang, H. Feng and X. Wei, J. Mater. Res., 2019, 34, 1200–1209 CrossRef CAS.
- W. Jia, J. Li, Z. Lu, Y. Juan and Y. Jiang, Materials, 2018, 11, 1560–1580 CrossRef.
- J. Mei, W. Fu, Z. Zhang, X. Jiang, H. Bu, C. Jiang, E. Xie and W. Han, Energy, 2017, 139, 1153–1158 CrossRef CAS.
- O. Moradlou, H. Ansarinejad, M. Hosseinzadeh and H. Kazemi, J. Alloys Compd., 2018, 755, 231–241 CrossRef CAS.
- C.-B. Wang, C.-W. Tang, S.-J. Gau and S.-H. Chien, Catal. Lett., 2005, 101, 59–63 CrossRef CAS.
- L. Sun, Z. Xie, A. Wu, C. Tian, D. Wang, Y. Gu, Y. Gao and H. Fu, J. Mater. Chem. A, 2021, 9, 26226–26235 RSC.
- Q. Cheng, J. Tang, J. Ma, H. Zhang, N. Shinya and L.-C. Qin, Phys. Chem. Chem. Phys., 2011, 13, 17615–17624 RSC.
- L. Zhang, K. N. Hui, K. San Hui and H. Lee, J. Power Sources, 2016, 318, 76–85 CrossRef CAS.
- M. Zomorodian Esfahani, A. Aghaei, M. Khosravi, N. Bagheri, Z. Khakpour and M. Javaheri, New J. Chem., 2017, 41, 11731–11741 RSC.
- H.-J. Kim, S. Y. Kim, L. J. Lim, A. E. Reddy and C. V. V. M. Gopi, New J. Chem., 2017, 41, 5493–5497 RSC.
- J. Cui, X. Zhang, L. Tong, J. Luo, Y. Wang, Y. Zhang, K. Xie and Y. Wu, J. Mater. Chem. A, 2015, 3, 10425–10431 RSC.
Footnote |
| † Electronic supplementary information (ESI) available. See DOI: https://doi.org/10.1039/d2nj05192c |
| This journal is © The Royal Society of Chemistry and the Centre National de la Recherche Scientifique 2023 |

