Nanoscopic evaluation on mitochondrial ultrastructures by regulating reactive oxygen species productivity within terpyridyl Zn(II) complexes with different alkyl chain lengths†
Liping
Su‡
a,
Jinghong
Xian‡
b,
Shiqin
Fu
a,
Yuhan
Zhu
c,
Hongzhi
Cao
c,
Zhihui
Feng
c,
Yupeng
Tian
 c and
Xiaohe
Tian
 *abc
*abc
aFunctional and Molecular Imaging Key Laboratory of Sichuan Province, Huaxi MR Research Centre (HMRRC), Department of Radiology, West China Hospital of Sichuan University, Chengdu, 610000, China
bDepartment of Clinical Research Management, West China Hospital, Sichuan University, Chengdu, 610041, China
cDepartment of Chemistry, Key Laboratory of Functional Inorganic Material Chemistry of Anhui Province, Hefei 230039, China
First published on 6th December 2022
Abstract
Mitochondria targeting complexes are widely utilized as photosensitizers in photodynamic therapy. However, the mechanisms by which they regulate reactive oxygen species (ROS) production at the molecular level and their influence on intracellular mitochondrial signaling and ultrastructures remain rarely studied. Herein, we present two terpyridyl Zn(II) complexes with different side alkyl chain lengths (Zn–2C and Zn–6C) that lead to low and high ROS productivities in vitro, respectively. Both complexes could enter live cells effectively with minimal dark toxicity and accumulate preferably in the mitochondria. We also demonstrated that Zn–6C, with more efficient ROS productivity, could significantly downregulate the caspase signaling pathway but showed no evident influence on mitochondrial membrane proteins. We also highlighted and compared the mitochondrial ultrastructural variations during such a process by stimulated emission depletion (STED) super-resolution nanoscopy.
Introduction
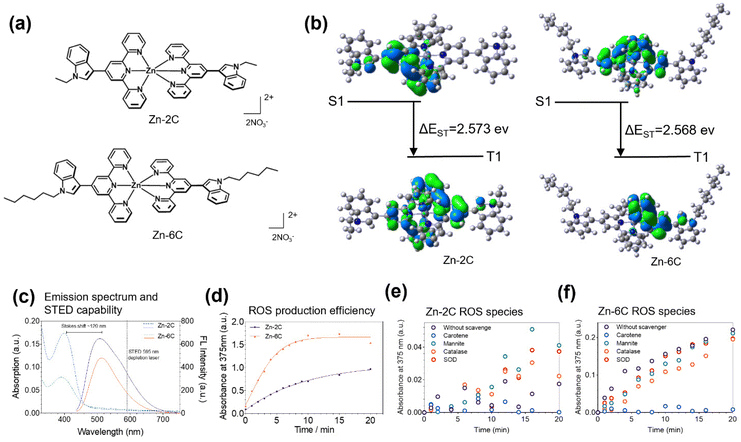
One of the most critical functions of mitochondria is to provide energy to the body by generating adenine nucleoside triphosphate (ATP).1 Mitochondria utilize more than 90% of the oxygen entering the body through respiration. Under physiological conditions, a small amount of ROS is generated intracellularly, particularly within the mitochondria, to maintain vital functions of the body.2 In addition, ROS also regulate redox-sensitive protein kinases in signal transduction pathways.3 Studies have shown that mitochondria produce 0.1–2% reactive oxygen species in the process of oxygen utilization under physiological conditions, but the generation of ROS will increase under disease or ageing conditions.4 Excessive ROS production would result in an imbalance of antioxidant defense and the formation of oxidative stress, leading to lipid peroxidation damage.5 Therefore, it is critical to understand the effects of ROS fluctuations on the mitochondrial signaling pathway and their impact on mitochondrial morphology variation.2,6,7 However, rationally designed photosensitizers (PSs) with tunable ROS production efficiency and good fluorescence signals for intracellular visualization have rarely been reported.8,9The main strategies in constructing effective photosensitizers (PSs) to increase the generation rate of ROS rely on improving the intersystem crossing (ISC) ability: adjusting the electron cloud distribution of the HOMO and LUMO orbits of PSS to reduce the energy gap between the S1 state and the T1 state (ΔEST).10–12 Compared with the heavy atom strategy (halogens, Ru(II), Pt(II), and Ir(III)), PSs by adjusted ΔEST have less dark toxicity. Based on these considerations, two novel double D–A configuration Zn(II) complexes (Zn–nC: Zn–2C and Zn–6C, Fig. 1a) were designed and synthesized: (1) indole scaffolds are electron-rich aromatic heterocycles and their derivatives can be used as strong electron donors; terpyridine groups have electron-withdrawing ability and act as acceptors, while leading to interesting photophysical properties due to their high binding affinity for transition metal ions;13,14 (2) the Zn(II) complex with a double D–A configuration has a large Stokes shift and high photostability;15,16 (3) different lengths of hydrophobic alkyl chains can optimize the luminescence of complexes and improve their biocompatibility; in addition, PSs with tunable ΔEST values can be obtained by adjusting the length of alkyl chains;16 and (4) from the perspective of molecular structures, D–A configurations are conducive to intramolecular charge transfer (ICT) (conducive to the effective separation of HOMO–LUMO orbitals and promoting the reduction of ΔEST),17,18 also introducing alkyl chains with different lengths into the electron donor group to adjust the ICT. Studies have shown that a longer alkyl chain can result in more fluffy packing and increase the contact opportunity of molecules with oxygen, thus further promoting ROS production.19,20
Results and discussion
Zinc complexes Zn–nC (Zn–2C and Zn–6C, Fig. 1a) were synthesized (Schemes S1 and S2†) according to the above considerations and characterized using 1H NMR spectroscopy, 13C NMR spectroscopy and MS (Fig. S1–S14†). To study the electronic transition behavior of Zn–2C and Zn–6C, density functional theory (DFT) calculations were performed using Gaussian 09 software (Fig. 1b). A decreased ΔEST favors ISC to improve the ROS generation efficiency. Therefore, the capacity for the ROS generation of Zn–6C was theoretically higher than that of Zn–2C. Their photophysical properties and suitability under STED nanoscopy were also evaluated. As shown in Fig. 1c, Zn–nC complexes have similar excitation and emission wavelengths at ∼410 nm and 530 nm, respectively. It is noteworthy that these complexes possess a large Stokes shift up to 120 nm, leaving a red-emission tail from 600 nm to 700 nm. Such optical properties provide the possibility to use a STED depletion laser for resolution enhancement in live-cell imaging experiments.21,22According to our design approach, Zn–nC complexes are expected to produce varied singlet oxygen species (ROS) under laser irradiation. To explore the potential use of Zn–nC complexes as intracellular ROS generators, 3,3′,5,5′-tetramethy benzidine (TMB) was added as a chromogenic agent to quantify their ROS production efficiency.23,24 As shown in Fig. 1d, under 365 nm (0.2 mW cm−2) laser irradiation, Zn–6C showed a greater ROS production rate compared with Zn–2C and approached saturation at 8 min, while Zn–2C showed a slower but steady trend during the monitored 20 min. These results suggested that the alkyl chain length from Zn–2C and Zn–6C might significantly improve the ROS production efficiency, consistent with the theoretical calculation data in Fig. 1b.
In addition, we also investigated which ROS species Zn–nC could produce. Herein, carotene, mannitol, catalase and superoxide dismutase (SOD) were introduced to quench the possible production of 1O2, ˙OH, H2O2 and O2˙−, respectively (Fig. 1e and f).25,26 It is shown that carotene could significantly prevent TMB oxidation, demonstrating that 1O2 was the major photogenerated ROS.
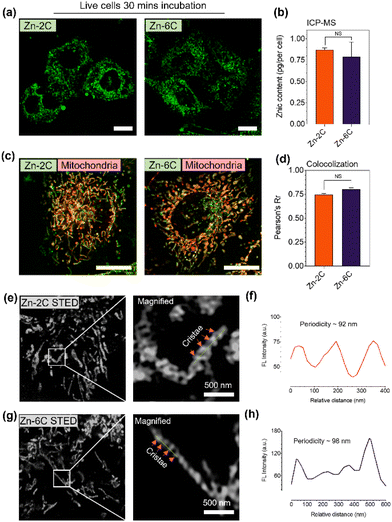
The intracellular distribution of Zn–nC complexes was subsequently carried out using HeLa cells via confocal laser scanning microscopy. Both the complexes were incubated with live cells at 1 μM for 15 min. As shown in Fig. S15,† Zn–nC did not show obvious cytotoxicity to HeLa cells under dark conditions. However, a dose-dependent cytotoxicity was observed under light irradiation (375 nm, 0.2 mW cm−2), and Zn–6C was more cytotoxic compared with Zn–2C. Further cell viability was also investigated via live/dead assays with calcein-AM and propidium iodide (PI) double staining (Fig. S16†). It can also be seen that Zn–6C, which produced more ROS, exhibited a greater effect on cell death. These results demonstrated that Zn–6C could significantly reduce HeLa cells through the PDT pathway. Fig. 2a shows that Zn–nC could rapidly penetrate the cell membrane during such an incubation period and distribute within the cytosolic region with a fibril pattern. To evaluate the difference in cellular uptake towards Zn–2C and Zn–6C, inductively coupled plasma mass spectrometry (ICP-MS) experiments were performed which demonstrated that the zinc content of the cytosolic fraction showed no significant difference between Zn–2C and Zn–6C treated cells (Fig. 2b).
Further colocalization studies were also performed to determine the precise subcellular target for Zn–nC complexes. Herein, live HeLa cells were incubated with 1 μM Zn–nC for 15 min, and then co-stained with a commercial mitochondrial marker and a lysosomal marker: MitoTracker Red and LysoTracker Green, respectively. Fig. 2c and d suggest that the Zn–nC complexes had a high affinity to accumulate in mitochondria with a high Pearson's coefficient, but not with other bounded organelles such as lysosomes (Fig. S17†).
Subsequently, a photobleaching experiment suggested that the Zn–2C and Zn–6C complexes possessed superior photostability compared with mitochondrial commercial dyes (MTDR) (Fig. S18†). Due to the superior photostability of Zn–nC complexes under both confocal microscopy and STED nanoscopy, we next attempted to capture the mitochondrial ultrastructures under STED using Zn–nC-labelled live cells. The STED imaging in Fig. S19† indicates that Zn–nC coincides well with MTDR and has high co-localization coefficients of 0.95 and 0.92. As shown in Fig. 2e and g, single-cell super-resolution micrographs were successfully obtained, while the magnified images clearly show the cristae ultrastructures. The intensity plot profile in Fig. 2f and h also suggests that the cristae periodicity labelled with Zn–nC has a regular distance at ∼90–100 nm. The above results strongly suggest that the Zn–nC complexes are capable of targeting live-cell mitochondria located in the cristae structure. Since both the Zn–nC complexes share the same intracellular target with similar accumulated contents, this provided us a valuable tool to study mitochondrial physiological and ultrastructural variations under ROS stimulation.
It is widely accepted that mitochondria are the primary site of ROS production and the most ROS-sensitive organelles. The ROS produced within mitochondria participates in cell signal transduction and induce apoptosis, which is a common pathogenesis of tumors and many other diseases. However, the relationship between ROS levels and mitochondrial damage has not been fully understood.
For these reasons, we used Zn–2C and Zn–6C incubated with live HeLa cells and exposed to laser irradiation for 5 min to produce varied ROS levels in situ to understand the impact on the mitochondrial correlated singling pathway and ultrastructures. Prior to these experiments, the intracellular ROS generation was evaluated in HeLa cells using a 2′,7′-dichlorodihydrofluorescein diacetate (DCFH-DA) probe, and confirmed that Zn–6C indeed produced more ROS in HeLa cells (Fig. S20†).
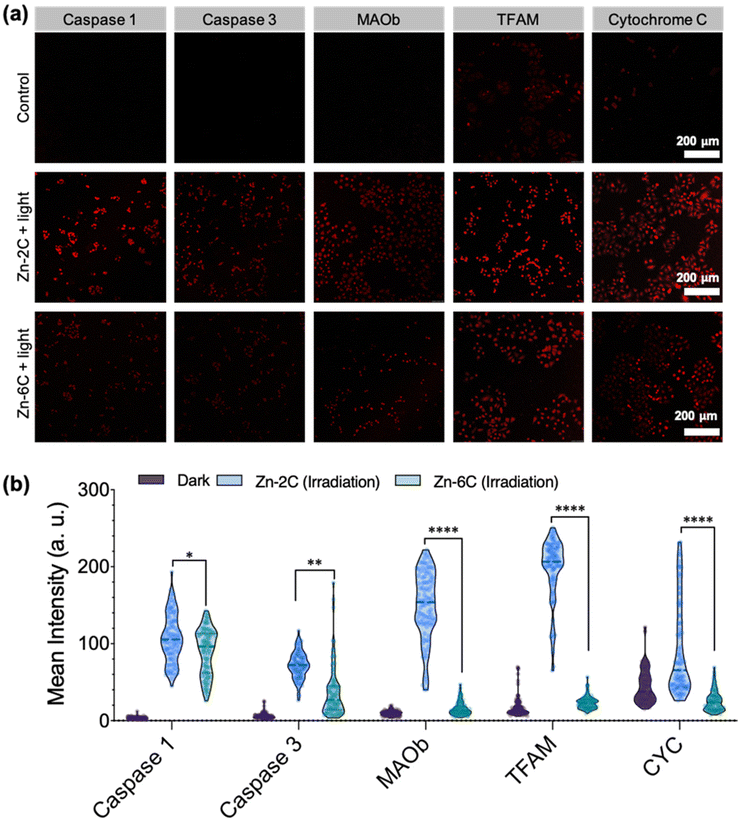
Subsequently, the treated cells were immunofluorescently labelled with caspase 1/3 (apoptosis-related protein), MAO-B (oxidative deamination protein), TFAM (mitochondrial DNA protein) and cytochrome c (respiration chain protein). Fig. 3a and Fig. S21† show representative confocal micrographs after the treatment; their quantitative data (from 100 cells) are shown in Fig. 3b. It is demonstrated that under both circumstances (Zn–2C and Zn–6C ROS generation), the above-mentioned cell signaling and apoptotic related proteins were upregulated to a certain degree. It is also interesting to note that despite Zn–2C generating lower amounts of ROS compared with Zn–6C as previously demonstrated (Fig. 1d), all the proteins monitored, including apoptotic-related caspase 1 and caspase 3, were significantly upregulated. Compared with the mild ROS effect (Zn–2C treated), robust mitochondrial internal ROS (Zn–6C treated) showed less influence on oxidative deamination, mtDNA formation, or respiration. In order to explore the reasons behind these differences, herein apoptotic cells and necrotic cells were analyzed by double staining with annexin V-FITC/PI according to the apoptotic assay kit. From Fig. S22,† moderate intracellular ROS induced by the Zn–2C complex mainly cause the early apoptosis of cells, resulting in the upregulation of the five proteins. Although the Zn–6C complex might mainly cause cell necrosis and late apoptosis quickly due to rapid and excessive intracellular ROS generation, these dead and severely damaged cells lost the normal physiological, biochemical and metabolic functions, leading to only slight upregulation of these proteins.27,28 Nonetheless, for the current study, we showed that different mitochondrial internal ROS levels could distinctly impact signal transduction and apoptosis, which is worth investigation in future work.
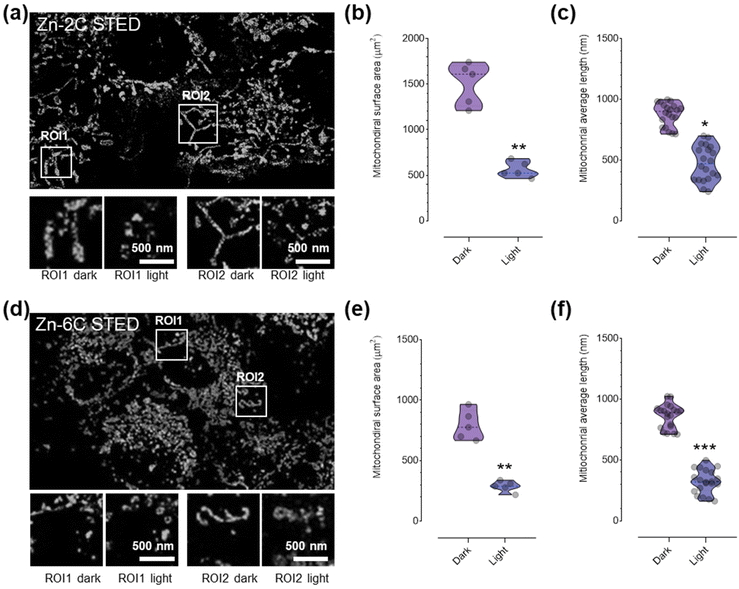
Finally, we analyzed the impact of ROS produced by the complex within the mitochondrial space on its ultrastructures under STED nanoscopy. The cell was subsequently exposed to laser irradiation to trigger ROS production from the complexes, and the same regions (regions of interest, ROI1 and ROI2) were captured and quantitatively measured. It is shown that the mitochondria showed considerable swelling and segmentation after ROS stimulation. The quantitative analysis (Fig. 4b, c, e and f) suggested that the mitochondrial surface area and the average length were significantly reduced. It is noteworthy that the Zn–6C complex with more ROS generation ability induced much significant mitochondrial morphology variation, in agreement with the previous cytotoxicity assay.
Conclusions
In summary, we have rationally designed two zinc complexes with varying alkyl chain lengths, which possess different ROS generation abilities under laser irradiation. Furthermore, live cell studies showed that these complexes could accumulate within the mitochondria with similar contents; super-resolution STED nanoscopy suggested that both the complexes could precisely label mitochondrial cristae ultrastructures. Interestingly, it is demonstrated that compared to the Zn–6C complex, the Zn–2C complex with moderate ROS production efficiency could considerably impact mitochondrial signal transduction and influence apoptotic pathways. This leads to significant ultrastructural variation, including mitochondrial cristae enlargement and length segmentations.Author contributions
Liping Su, Jinghong Xian and Shiqin Fu designed the research, analyzed the data and wrote the original draft. Yuhan Zhu and Hongzhi Cao helped in photophysical property research. Zhihui Feng guided the synthesis and theoretical calculations of the compounds. Yupeng Tian designed the chemical structures. Xiaohe Tian helped in designing the experiments and corrected the manuscript. All authors provided critical feedback.Conflicts of interest
The authors declare no conflict of interest.Acknowledgements
This work was supported by grants from the National Natural Science Foundation of China (32171361, 21871003 and 81621003) and the 1.3.5 project for disciplines of excellence, West China Hospital, Sichuan University (ZYGD22009).References
- C. M. Gustafsson, M. Falkenberg and N. G. Larsson, Annu. Rev. Biochem., 2016, 85, 133–160 CrossRef PubMed.
- D. B. Zorov, M. Juhaszova and S. J. Sollott, Physiol. Rev., 2014, 94, 909–950 CrossRef PubMed.
- C. R. Reczek and N. S. Chandel, Curr. Opin. Cell Biol., 2015, 33, 8–13 CrossRef PubMed.
- M. P. Murphy, Biochem. J., 2009, 417, 1–13 CrossRef PubMed.
- J. N. Peoples, A. Saraf, N. Ghazal, T. T. Pham and J. Q. Kwong, Exp. Mol. Med., 2019, 51, 1–13 CrossRef PubMed.
- G. S. Shadel and T. L. Horvath, Cell, 2015, 163, 560–569 CrossRef CAS PubMed.
- K. C. Yan, A. C. Sedgwick, Y. Zang, G. R. Chen, X. P. He, J. Li, J. Yoon and T. D. James, Small Methods, 2019, 3, 1900013 CrossRef.
- W. T. Dou, H. H. Han, A. C. Sedgwick, G. B. Zhu, Y. Zang, X. R. Yang, J. Yoon, T. D. James, J. Li and X. P. He, Sci. Bull., 2022, 67, 853–878 CrossRef.
- Z. H. Yu, X. S. Li, F. G. Xu, X. L. Hu, J. T. Yan, N. Kwon, G. R. Chen, T. T. Tang, X. J. Dong, Y. Y. Mai, D. J. Chen, J. Yoon, X. P. He and H. Tian, Angew. Chem., Int. Ed., 2020, 59, 3658–3664 CrossRef PubMed.
- M. L. Liu, Y. C. Chen, Y. Guo, H. Yuan, T. X. Cui, S. K. Yao, S. X. Jin, H. H. Fan, C. J. Wang, R. Xie, W. J. He and Z. J. Guo, Nat. Commun., 2022, 13, 2179 CrossRef.
- Y. F. Xiao, W. C. Chen, J. X. Chen, G. Lu, S. Tian, X. Cui, Z. Zhang, H. Chen, Y. Wan, S. Li and C. S. Lee, ACS Appl. Mater. Interfaces, 2022, 14, 5112–5121 CrossRef PubMed.
- Z. M. Yang, Z. J. Zhang, Y. Q. Sun, Z. Q. Lei, D. Wang, H. C. Ma and B. Z. Tang, Biomaterials, 2021, 275, 120934 CrossRef CAS PubMed.
- Y. Han, W. Dong, Q. Q. Guo, X. F. Li and L. J. Huang, Eur. J. Med. Chem., 2020, 203, 112506 CrossRef.
- X. H. Tian, Q. Zhang, M. Z. Zhang, K. Uvdal, Q. Wang, J. Y. Chen, W. Du, B. Huang, J. Y. Wu and Y. P. Tian, Chem. Sci., 2017, 8, 142–149 RSC.
- B. Ni, H. Z. Cao, C. K. Zhang, S. L. Li, Q. Zhang, X. H. Tian, D. D. Li, J. Y. Wu and Y. P. Tian, Inorg. Chem., 2020, 59, 13671–13678 CrossRef PubMed.
- S. Yamane, K. Tanabe, Y. Sagara and T. Kato, Top. Curr. Chem., 2012, 318, 395–405 CrossRef.
- H. Z. Cao, B. Fang, J. J. Liu, Y. Shen, J. Shen, P. Xiang, Q. Zhou, S. C. De Souza, D. D. Li, Y. P. Tian, L. Luo, Z. P. Zhang and X. H. Tian, Adv. Healthc. Mater., 2021, 10, 2001489 CrossRef.
- W. H. Xu, M. M. S. Lee, Z. H. Zhang, H. H. Y. Sung, I. D. Williams, R. T. K. Kwok, J. W. Y. Lam, D. Wang and B. Z. Tang, Chem. Sci., 2019, 10, 3494–3501 RSC.
- F. Meng, Spectrochim. Acta, Part A, 2021, 248, 119233 CrossRef PubMed.
- S. L. Song, Y. Zhao, M. M. Kang, Z. J. Zhang, Q. Wu, S. Fu, Y. M. Li, H. F. Wen, D. Wang and B. Z. Tang, Adv. Funct. Mater., 2021, 31, 2107545 CrossRef.
- Z. W. Man, H. T. Cui, Z. Lv, Z. Z. Xu, Z. Y. Wu, Y. S. Wu, Q. Liao, M. H. Liu, P. Xi, L. M. Zheng and H. B. Fu, Nano Lett., 2021, 21, 3487–3494 CrossRef.
- F. F. Zhu, Z. H. Yang, F. Wang, D. D. Li, H. Z. Cao, Y. P. Tian and X. H. Tian, Sens. Actuators, B, 2020, 305, 127492 CrossRef.
- X. Sun, X. Luo, X. D. Zhang, J. F. Xie, S. Jin, H. Wang, X. S. Zheng, X. J. Wu and Y. Xie, J. Am. Chem. Soc., 2019, 141, 3797–3801 CrossRef.
- R. Long, K. K. Mao, X. D. Ye, W. S. Yan, Y. B. Huang, J. Y. Wang, Y. Fu, X. S. Wang, X. J. Wu, Y. Xie and Y. J. Xiong, J. Am. Chem. Soc., 2013, 135, 3200–3207 CrossRef PubMed.
- X. Liu, L. Yan, H. Ren, Y. Cai, C. Liu, L. Zeng, J. Guo and A. Liu, Biosens. Bioelectron., 2020, 165, 112342 CrossRef.
- A. A. Abdelwahab, W. C. Koh, H. B. Noh and Y. B. Shim, Biosens. Bioelectron., 2010, 26, 1080–1086 CrossRef.
- J. Zhang, D. Duan, Z. L. Song, T. Liu, Y. Hou and J. Fang, Med. Res. Rev., 2021, 41, 342–394 CrossRef PubMed.
- A. Samoylenko, J. Al Hossain, D. Mennerich, S. Kellokumpu, J. K. Hiltunen and T. Kietzmann, Antioxid. Redox Signaling, 2013, 19, 2157–2196 CrossRef.
Footnotes |
| † Electronic supplementary information (ESI) available. See DOI: https://doi.org/10.1039/d2nr04088c |
| ‡ These authors contributed equally to this work. |
| This journal is © The Royal Society of Chemistry 2023 |


