Molecular engineering with triptycene groups endows homoleptic Ir(III) complexes with enhanced electroluminescence properties†
Zheng-Yu
Tao‡
a,
Ze-Hui
Pan‡
b,
Ying-Jie
Wang‡
a,
Jialing
Zhang
a,
Qing-Song
Wang
a,
Qian-Feng
Zhang
a,
Bi-Hai
Tong
 *a,
Man-Keung
Fung
 *b and
Hui
Kong
*a
aKey Laboratory of Metallurgical Emission Reduction & Resources Recycling, Ministry of Education, Institute of Molecular Engineering and Applied Chemistry, School of Metallurgy Engineering, Anhui University of Technology, Maanshan, 243002, Anhui, China. E-mail: tongbihai@ahut.edu.cn; konghui@ahut.edu.cn
bJiangsu Key Laboratory for Carbon-Based Functional Materials & Devices, Institute of Functional Nano & Soft Materials (FUNSOM) & Collaborative Innovation Center of Suzhou Nano Science and Technology, Soochow University, Suzhou 215123, P. R. China. E-mail: mkfung@suda.edu.cn
First published on 23rd September 2022
Abstract
Emitters with suppressed intermolecular interactions are desired for high efficiency OLEDs. Herein, five phosphorescent homoleptic Ir(III) complexes with a triptycene skeleton were successfully synthesized. Benefitting from the unique rigid and bulky triptycene skeleton, these complexes exhibit excellent thermal and photophysical properties. Their crystal structures indicated that the π–π stacking interactions can be completely eliminated by reasonable combination of the triptycene skeleton and steric hindrance groups. These complexes show significantly good to excellent quantum yields (73.7%–88.9%) and thermal stability (Td = 364–451 °C). A highly efficient OLED with an external quantum efficiency of up to 27.5% is developed with very low efficiency roll-off and is the most efficient OLED based on phthalazine iridium complexes.
Introduction
Iridium(III) complexes are widely used as emitters in organic light-emitting diodes (OLEDs) due to their high efficiency, easily tunable emission wavelength and high thermal stability.1–4 Unfortunately, the serious quenching of luminescence caused by intermolecular interactions of Ir(III) complexes will deteriorate the device performance including efficiency, lifetime and reproducibility. Therefore, the development of concentration-insensitive iridium complex emitters has always been the pursuit of researchers.5–9 The introduction of sterically hindered spacers into the complexes has been proved to be an effective method to reduce the concentration quenching. For example, Xie et al. reported an OLED containing a pinene-based iridium complex with the optimal doping concentration of up to 26 wt%.5 Liu et al. developed a series of N-heterocyclic carbene-based iridium complexes with bipolar properties.6 Non-doped OLEDs containing a yellow complex (ppy)2Ir(dipig) exhibited a maximum external quantum efficiency (EQEmax) of 18.0%. Our group reported non-doped OLEDs containing a green bicyclo [2.2.2] oct-2-ene based Ir(III) complex with an EQEmax of 15.2%.7 Yang et al. reported OLEDs containing a dendritic complex R1 (30 wt%) with an EQEmax of 15.3%.8 Ding et al. reported non-doped OLEDs containing a dendritic complex of D-(PPQ)2Ir(acac) with an EQEmax of 11.1%.9Triptycene derivatives possess a unique Y-shaped 3D configuration and homoconjugated structures with a low degree of conjugation have attracted increasing attention for functional materials, owing to their rigid and bulky structure which can suppress π–π stacking and endow materials with enhanced thermal stability, solubility, film-forming ability, and porosity.10–15 Recently, we reported the OLED application of triptycene-based luminescent complexes for the first time.15 A series of benzothiazole and benzoimidazole based Ir(III) complexes with triptycene groups were synthesized. Compared with the electroluminescent (EL) devices of parent complexes, the devices containing these complexes exhibited a 31% performance improvement. However, in these complexes, heterocycles were constructed at the 1-position of triptycene, and iridium atoms formed C–Ir bonds with carbon atoms at the 2-position of triptycene. In these complexes, there was a large intramolecular repulsion between the triptycene group and adjacent groups in the same ligand due to the huge steric hindrance. Coupled with the electron rich properties of triptycene groups, the synthesis yields of these complexes were relatively lower than those of the parent complexes. Although these results showed the great potential of triptycene groups in improving the photoelectric properties of iridium complexes, molecular design is still needed to achieve the perfect combination of them.
Tris-cyclometalated iridium(III) complexes exhibited very high stability and luminous efficiencies due to the existence of strong C–Ir bonds.16 The enhanced and increased C–Ir bonds are beneficial for increasing the heavy atom effect. Among these complexes, tris-cyclometalated iridium(III) complexes based on phenylphthalazine derivatives have some unique properties. These complexes can be synthesized directly with IrCl3 in one step by improving the activities of ligands, such as the solubility of the ligands and the acidity of hydrogen atoms on the cyclometalated benzene ring.16a However, these complexes were easy to aggregate because there were a lot of intermolecular π⋯π interactions in their crystal caused by the phthalazine rings. Although the EQEmax of these OLEDs based on them reached 21.2%, the optimal doping concentration was only 1% and the efficiency roll-off was large.
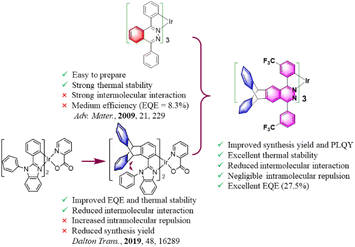
With this consideration, we hope to increase the steric density and carrier transport performance of phenylphthalazine-based complexes as much as possible without affecting the ligand coordination activity, so as to reduce the interaction between the complex molecules and improve the electroluminescence performance of these complexes. In this study (Fig. 1), we fused the triptycene groups with the phthalazine/pyridazine rings to reduce the interaction between the phthalazine/pyridazine rings. The electron-withdrawing CF3 groups were attached to the cyclometalated benzene rings to increase the ligand reactivity and the electron-transporting ability of the complexes and decrease the molecular stacking of the complexes. Diphenylamine groups were used to tune the carrier transport performance and steric hindrance density of the complexes. Rigid alkyl groups were also further introduced into the periphery of the triptycene groups to increase the steric hindrance effect. The results show that when the triptycene group was fused with pyridazine, there were still intermolecular π⋯π interactions between the molecules of the complex, and the deformation of the coordination core was large due to the existence of intramolecular repulsion. In contrast, when the triptycene group was fused with phthalazine, no intermolecular π⋯π interactions were found in the crystals of the product, and the deformation of the coordination core was small. Under the fine molecular structure optimization, the best OLED device efficiency of the as prepared complexes was much higher than that of the phthalazine-based complexes reported in the literature.
Results and discussion
Synthesis and characterization
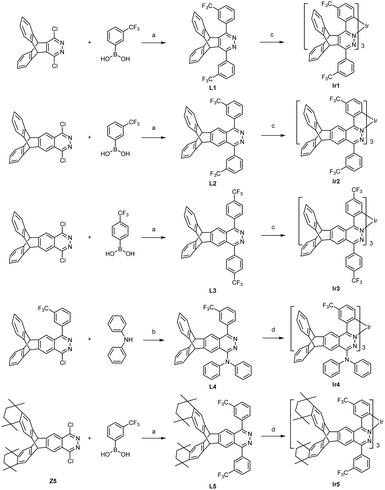
The synthesis routes are shown in Scheme 1. The ligands L1–L3 and L5 were conveniently prepared in medium yields (46–74%) from dichloropyridazine derivatives and trifluoromethylphenylboronic acids by the Suzuki coupling reaction. The intermediate Z5 of ligand L5 was synthesized in five steps, i.e. oxidation, amidation, Friedel–Crafts alkylation, hydrazine cyclization and halogenation, from 2,3-dimethyltriptycene (Scheme S1†). We developed a direct double Friedel–Crafts annulation route of triptycene derivatives that provides Z3 in good yield (60%) to avoid the generation of by-products in the process of the Diels–Alder cycloaddition between octamethyloctahydropentacene and phenylalkyne.19 Alkylation reduces the activity of carbonyl in intermediate Z3, and increasing the concentration of hydrazine hydrate can promote the hydrazine cyclization reaction. The ligand L4 was prepared in high yield (77%) by the direct nucleophilic substitution reaction using n-BuLi as the base. Two methods were used to synthesize these target iridium complexes. Complexes Ir1–Ir3 were synthesized with moderate yields (21–31%) from the one-pot reaction between IrCl3 and the corresponding ligands due to their high reactivity. Complexes Ir4–Ir5 were synthesized by the high temperature reaction between Ir(acac)3 and the corresponding ligands with improved yields (36–46%). 1H, 19F NMR and HRMS spectra confirmed the structures of these tris-cyclometalated iridium(III) complexes. The 1H NMR signals of the three ligands in one complex are the same, indicating that these complexes show a facile configuration.Single crystals of Ir1–Ir3 were grown from n-hexane/dichloromethane solution and characterized using X-ray crystallography. As shown in Fig. 2, complexes Ir1–Ir3 exhibit only a facile configuration with a distorted octahedral geometry around the Ir atoms, which is consistent with the NMR results. The Ir–C bond lengths are between 2.002 and 2.038 Å. The Ir–N bond lengths are between 2.077 and 2.113 Å. In general, all the bond (Ir–C, Ir–N, C–C, C–F, C–N and N–N) lengths and angles are within normal ranges and similar to those of other similarly constituted complexes.16 In complex Ir2, all the Ir–C bond lengths are the same, and so do the Ir–N bond lengths. However, there is a slight difference in the length of the Ir–C bond or Ir–C bond in complexes Ir1 or Ir3. Therefore, complex Ir2 has the highest symmetry. The range of dihedral angles between the cyclometalated benzene and pyridazine rings of each ligand in these complexes is 8.4–25.2°, indicating that they are almost coplanar. The planes of the remaining phenyl pendants with CF3 groups are intersected with those of the adjacent pyridazine rings with average dihedral angles of 48.9, 39.7 and 53.2° for complexes Ir1, Ir2 and Ir3, respectively. The average dihedral angles of their corresponding parent complexes are 16.0, 50.3 and 50.9°, respectively.7,16a The results show that the steric triptycene groups twist the aryl pendants out of the pyridazine plane and minimize the extension in π-conjugation, but it has little effect on phenylphthalazine and even reduces this dihedral angle of complex Ir2 as explained below. In complex Ir1, the steric CF3 groups on phenyl pendants point to the inner side of the molecule and increase the torsion of phenyl pendants. In contrast, the CF3 groups on phenyl pendants point to the outside of complex Ir2 and reduce the torsion of phenyl pendants and intermolecular interactions. Because the CF3 groups in complex Ir3 can cause the largest intramolecular repulsion, its distortion is the largest. The dihedral angles between the planes of the two peripheral benzene rings on the triptycene skeleton are 119.2, 120.5 and 124.2° for Ir1, Ir2 and Ir3, respectively, which are very close to the ideal 120°.
 | ||
| Fig. 2 Molecular structures of Ir1–Ir3 with thermal ellipsoids shown at the 25% probability level. Hydrogen atoms are omitted for clarity. CCDC 2132294† (Ir1), 2132295 (Ir2), and 2132297 (Ir3). | ||
The crystal packing of Ir1 is mainly stabilized by intermolecular π⋯π interactions and hydrogen bonding. A face-to-face π⋯π stacking is formed between the benzene rings of the triptycene skeleton of adjacent molecules with a centroid distance of 3.74 Å. The intermolecular hydrogen bonding is the C–H⋯F type and the distance of H⋯F is 2.54 Å. In addition, abundant edge-to-face C–H⋯π and C–F⋯π weak intermolecular interactions are also observed in this crystal. In contrast, the crystal packing of Ir2 is only stabilized by the intermolecular van der Waals force. This is very beneficial to reduce the quenching concentration of luminescence. The crystal packing of Ir3 is mainly stabilized by edge-to-face C–H⋯π and C–F⋯π weak intermolecular interactions. These results show that the triptycene-derived phthalazine ligands can reduce the intermolecular interaction of iridium(III) complexes more effectively than the triptycene-derived pyridazine ligands.
Thermal and photophysical properties
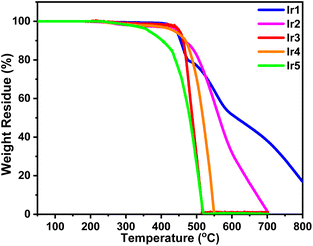
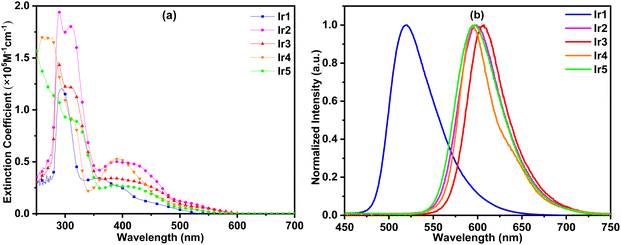
The thermal properties of these complexes were studied by thermogravimetry analysis (TGA). As shown in Fig. 3, these complexes exhibited excellent thermal stability except for complex Ir5. The decomposition temperatures (Td, 5% weight loss) of complexes Ir1–Ir4 slightly changed in the range of 437–451 °C. It should be noted that the Td values of complexes Ir1–Ir3 were obviously increased by 114, 51 and 99 °C, respectively, compared with those of their corresponding parent complexes.7,16a This result shows that triptycene groups have significant advantages in improving the thermal stability of iridium complexes which makes them competent for the evaporation process and prolongs the lifetime of devices. As one of the exceptions, too many electron donor alkyl groups reduce the thermal stability of the complex Ir5 and its Td was reduced to 364 °C.In order to study the photophysical properties of these new complexes, their UV–vis absorption and photoluminescence (PL) spectra were obtained. As shown in Fig. 4(a), the strongest absorption bands of these complexes appear below 350 nm, which could be assigned to the ligand-centered (LC) π–π* transitions of organic ligands. The relatively weak absorption bands and tails above 350 nm could be ascribed to the singlet and triplet metal-to-ligand charge transfer (1MLCT/3MLCT) transitions.16
Under UV light excitation, all these complexes exhibited intensive emission in CH2Cl2. As shown in Fig. 4(b), complex Ir1 exhibited green emission with a peak at 521 nm. Complexes Ir2–Ir5 gave out orange-yellow light with peaks between 595 and 608 nm. Because the conjugation of phthalazine is larger than that of pyridazine, their spectra had a significant red shift relative to complex Ir1. The emission peaks of complexes Ir2 and Ir3 centered at 597 and 608 nm, respectively. Complex Ir2 has a shorter emission wavelength than Ir3 because of the strong hypsochromic effect of the CF3 group at the 3-position of the cyclometalated benzene ring (see below). The electron donating diphenylamine groups in complex Ir4 make the emission peak (595 nm) of Ir4 close to that of Ir2. The emission peaks of complexes Ir5 and Ir2 are very close, which indicates that alkyl groups have little effect on the optical energy gaps. In the rigid environment of polymethyl methacrylate (PMMA) films, the emission peaks of complexes Ir1, Ir2 and Ir3 had a 6 nm blue shift compared with that in CH2Cl2. The blue shift of complex Ir5 was 10 nm. Interestingly, the luminescence peak positions of complex Ir4 in CH2Cl2 and the film were the same. This may be because the steric hindrance of the diphenylamine groups in complex Ir4 is greater than that of phenyl pendants in other complexes, and the rotational vibration of diphenylamine groups is restricted.
In PMMA films, these complexes exhibited high PL quantum yields (QYs) between 73.7% and 88.9% (Table 1). Their phosphorescence lifetimes were in the range of 1.13–2.13 μs, which are within the typical phosphorescence lifetime. The QYs of complexes Ir1, Ir2 and Ir3 are 28%, 6% and 30% higher than their parent complexes,7,16a respectively, illustrating the effectiveness of triptycene modification to improve the luminous efficiency. From these data, it can be inferred that the radiative decay rates (kr) of complexes Ir1, Ir2, Ir3 and Ir5 are very close, and in the range of 5.85 × 10⁵–6.50 × 10⁵ s−1. However the kr value of complex Ir4 is only 3.60 × 10⁵ s−1, which is significantly lower than those of other complexes. Their nonradiative decay rates (knr) were in the range of 0.79 × 10⁵–2.33 × 10⁵ s−1. Complex Ir5 with the highest quantum efficiency (88.9%) has the minimum knr value of 0.79 × 10⁵ s−1, indicating that the introduction of rigid alkyl steric groups reduces the interaction between the complex and the media, and the probability of a non-radiative transition is reduced. Complex Ir3 with the lowest quantum efficiency (73.7%) has the maximum knr value of 2.33 × 10⁵ s−1, which may be related to the small steric hindrance of 4-CF3 substituents and the large intramolecular repulsion as shown in its single crystal structure.
| Sample |
λ
em![[thin space (1/6-em)]](https://www.rsc.org/images/entities/char_2009.gif) a (nm) a (nm) |
Φ (%) |
τ
obs![[thin space (1/6-em)]](https://www.rsc.org/images/entities/char_2009.gif) b (μs) b (μs) |
k
r![[thin space (1/6-em)]](https://www.rsc.org/images/entities/char_2009.gif) b (× 105 s−1) b (× 105 s−1) |
k
nr![[thin space (1/6-em)]](https://www.rsc.org/images/entities/char_2009.gif) b (× 105 s−1) b (× 105 s−1) |
E
ox1/2![[thin space (1/6-em)]](https://www.rsc.org/images/entities/char_2009.gif) c (V) c (V) |
HOMOd (eV) | LUMOe (eV) | E optg (eV) |
T
d![[thin space (1/6-em)]](https://www.rsc.org/images/entities/char_2009.gif) f (°C) f (°C) |
|---|---|---|---|---|---|---|---|---|---|---|
| a PL spectra were recorded in CH2Cl2 and PMMA films at a conc. of 1 wt% (in brackets) at r.t. b Quantum yields and lifetimes were recorded in PMMA films at a conc. of 1 wt% at r.t. kr = Φ/τobs and knr = 1/τobs − kr. c E ox1/2 refers to [(Epa + Epc)/2], where Epc and Epa are the cathodic and anodic peak potentials referenced to the Fc+/Fc couple in CH2Cl2. d HOMO = −4.8 − Eox1/2. e LUMO = HOMO + Eoptg. Eoptg was estimated from the absorption edge. f Decomposition temperature of 5% weight loss to the initial weight in TGA analyses. | ||||||||||
| Ir1 | 521 (515) | 82.3 | 1.29 | 6.36 | 1.37 | 0.68 | −5.48 | −3.18 | 2.30 | 443 |
| Ir2 | 597 (591) | 86.5 | 1.48 | 5.85 | 0.91 | 0.55 | −5.35 | −3.27 | 2.07 | 445 |
| Ir3 | 608 (602) | 73.7 | 1.13 | 6.50 | 2.33 | 0.51 | −5.31 | −3.27 | 2.04 | 451 |
| Ir4 | 595 (595) | 76.6 | 2.13 | 3.60 | 1.10 | 0.49 | −5.29 | −3.23 | 2.06 | 437 |
| Ir5 | 598 (588) | 88.9 | 1.40 | 6.35 | 0.79 | 0.50 | −5.30 | −3.15 | 2.15 | 364 |
Electrochemical properties and theoretical calculation
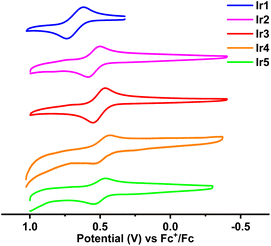
The frontier molecular orbital energy levels of these complexes are very important for the analysis of their photophysical properties and the design of their OLED structure. To determine their highest occupied molecular orbital (HOMO) energy levels, the electrochemical properties of these complexes were analyzed by cyclic voltammetry (CV). As shown in Fig. 5, these complexes exhibited reversible oxidation waves in CH2Cl2 solutions with half wave potentials (Eox1/2, vs. Fc+/Fc) in the range of 0.49–0.68 V. Consequently, the calculated HOMO energy levels of these complexes were between −5.48 eV and −5.29 eV. Because the conjugation of complex Ir1 is the smallest in these complexes, its HOMO energy level (−5.48 eV) is the lowest. The 4-CF3 substituent has less effect on the HOMO than the 3-CF3 substituent (see below), so complex Ir3 (−5.31 eV) has a higher HOMO energy level than complex Ir2 (−5.35 eV). Compared with complex Ir2, the electron donating diphenylamine groups and alkyl groups push up the HOMO energy levels of complexes Ir4 (−5.29 eV) and Ir5 (−5.30 eV), respectively. According to the HOMO energy levels and the calculated energy gaps (Eoptg) from the absorption edge, the lowest unoccupied molecular orbital (LUMO) energy levels were calculated between −3.15 eV and −3.27 eV.In order to analyze the orbital distribution of these complexes, density functional theory (DFT) calculations were carried out. Although there were some differences in the concrete values, the calculated optical energy gaps (Eoptg) of these complexes were consistent with the experimental values, which showed the reliability of the calculation results. The frontier molecular orbital distributions of complexes Ir1, Ir2, Ir3 and Ir5 are similar (Fig. 6). The HOMO orbitals are mostly located on the d orbitals of the Ir atoms (51.8%–53.6%) together with the cyclometalated phenyl moieties (32.1%–34.7%) with a small number of heterocycle moieties (9.5%–14.1%). Their LUMOs are mainly located on the heterocycle moieties (63.0%–71.4%), with a small number of cyclometalated phenyl moieties (16.0%–18.9%) and phenyl pendants with CF3 groups (6.4%–15.2%). The frontier orbital distribution on the two peripheral benzene rings of the triptycene scaffold is negligible. The electron donating bridgehead carbons on the triptycene groups slightly push up the frontier orbital energy levels, especially the LUMO energy level. This leads to an increase of Eoptg relative to their parent complexes.7,16a From complex Ir1 to complex Ir2, the increased heterocyclic conjugation stabilizes the LUMO energy level and reduces the Eoptg. On the cyclometalated phenyl moieties, the HOMO orbitals are mostly located on the C1, C3 and C5 atoms, while the LUMO orbitals are located on the C2, C4 and C6 atoms. As a result, the 3-CF3 substituent pulls down the HOMO levels and increases the Eoptg, while the 4-CF3 substituent pulls down the LUMO levels and reduces the Eoptg. For complex Ir5, the electron donating alkyl groups on the triptycene groups slightly push up the LUMO energy level and increase its Eoptg. Interestingly, the HOMO distribution of complex Ir4 is different from those of other complexes. The contribution of Ir atoms and cyclometalated phenyl moieties is obviously reduced to 30.8% and 19.5%, respectively, while the electron donating diphenylamine group accounts for the largest proportion (up to 35.7%), especially on its nitrogen atoms. This will lead to the intra/inter-ligand charge transfer becoming the main contribution of charge transfer. That is to say, the charge transfer between the metal and the ligand is reduced, and the heavy atom effect is reduced.
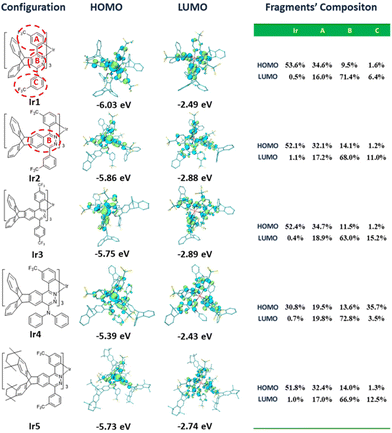 | ||
| Fig. 6 Contour plots of the HOMOs and LUMOs as well as their energy gaps. All the H atoms are omitted for clarity. | ||
Electrophosphorescence properties
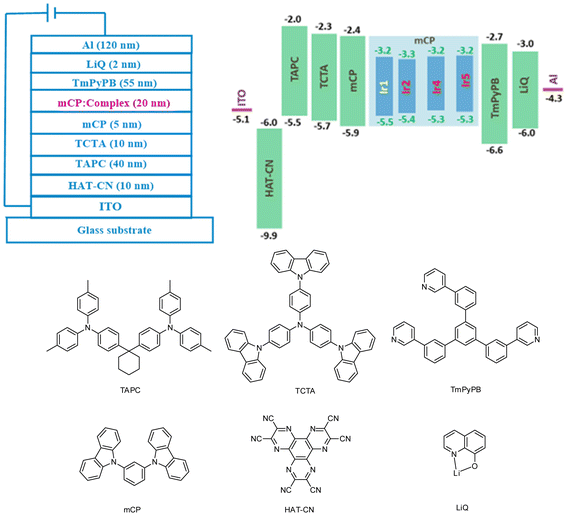
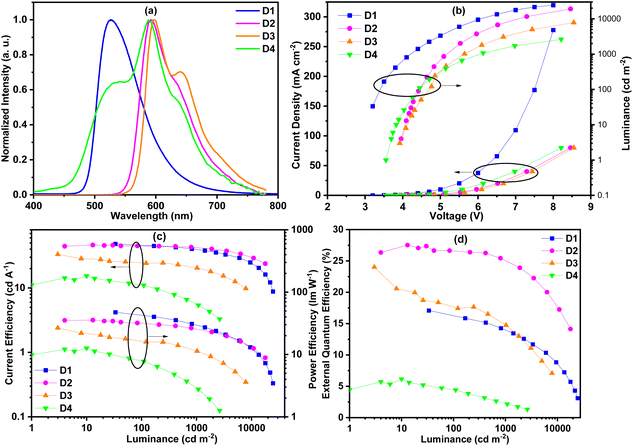
In order to evaluate the EL performances of complexes Ir1 (D1), Ir2 (D2), Ir4 (D3) and Ir5 (D4), vacuum-deposited OLED devices were fabricated with the configuration of ITO/HAT-CN (10 nm)/TAPC (40 nm)/TCTA (10 nm)/mCP (5 nm)/mCP: complex (15 wt% for complex Ir1 and 3 wt% for other complexes) (20 nm)/TmPyPB (55 nm)/LiQ (2 nm)/Al (120 nm) (Fig. 7). In these devices, 8-hydroxyquinolinolato-lithium (LiQ) and 1,4,5,8,9,11-hexaazatriphenylene-hexacarbonitrile (HAT-CN) served as the electron-injection and hole-injection materials, respectively. Di-[4-(N,N-ditolyl-amino)-phenyl] cyclohexane (TAPC) served as the hole-transport material. 1,3,5-Tri [(3-pyridyl)-phen-3-yl]benzene (TmPyPB) and N,N,N-tris(4-(9-carbazolyl)phenyl)amine (TCTA) were used as the electron-transport/hole-blocking and hole-transport/electron-blocking materials, respectively. 1,3-Bis(9H-carbazol-9-yl)benzene (mCP) was adopted as the host material. The HOMO/LUMO levels of these complexes are within that of mCP, which is favorable for the effective energy transfer from the host to these complex phosphors. The optimum doping concentration of green emitting complex Ir1 is 15 wt%, and that of other orange emitting complexes is 3 wt%. The chemical structures and frontier orbital energy levels of the materials are also shown in Fig. 6.As shown in Fig. 8(a), these complexes showed similar EL spectra to their PL spectra except for complex Ir5. Compared with its PL spectrum, the EL spectrum of complex Ir5 had a new obvious shoulder peak at around 520 nm. According to literature reports, the exciplex of mCP/TmPyPB emitted light at around 465 nm.20 Therefore, we speculate that this shoulder peak did not come from the emission of the exciplex, but may be produced by new substances produced by the partial decomposition of complex Ir5 in the process of device preparation. This is consistent with the poor thermal stability of complex Ir5. The shoulder peaks in the EL spectra are more obvious than those in their PL spectra. This is attributed to spin–orbit coupling enhanced 3π–π* intraligand charge transfer (ILCT), which typically gives highly structured emissions. The probability of ILCT transitions in complex Ir4 is higher than that in other complexes; as a result, the shoulder peak of complex Ir4 is stronger than those of other complexes. No emission of the host material was observed in all the EL spectra, indicating the efficient energy transfer from the host to phosphors. As shown in Fig. 8(b), the turn-on voltages of these devices were between 3.1 V and 4.0 V. Device D1 exhibited the highest maximum luminance of 24![[thin space (1/6-em)]](https://www.rsc.org/images/entities/char_2009.gif) 510 cd m−2 due to its significantly shorter emission wavelength. The highest maximum luminance values of devices D2, D3 and D4 were 19
510 cd m−2 due to its significantly shorter emission wavelength. The highest maximum luminance values of devices D2, D3 and D4 were 19![[thin space (1/6-em)]](https://www.rsc.org/images/entities/char_2009.gif) 067, 7860 and 2637 cd m−2, respectively. The maximum brightness markedly decreases from device D2 to D4 in turn, indicating that the performance of these devices decreases gradually.
067, 7860 and 2637 cd m−2, respectively. The maximum brightness markedly decreases from device D2 to D4 in turn, indicating that the performance of these devices decreases gradually.
Although the PL quantum efficiencies of these complexes were all high, their device efficiencies differed greatly. As expected, the devices D1, D2 and D3 showed high efficiency. As shown in Fig. 8(c and d), the maximum current efficiency (CE) and external quantum efficiency (EQE) of green emitting device D1 were 48.5 cd A−1 and 17.1%, respectively. Device D2 exhibited the best performance with the maximum CE and EQE of 46.4 cd A−1 and 27.5%, respectively. To the best of our knowledge, this is the best device performance among the phosphorescent devices based on phenylphthalazine iridium(III) complexes reported in the literature.16 The maximum CE and EQE of device D3 were also up to 33.3 cd A−1 and 24.0%, respectively. At the same time, at the practicable brightness of 1000 cd m−2, the EQEs of devices D1, D2 and D3 maintained 81.3%, 91.3% and 61.7% of their maximum efficiencies (Table 2), respectively. It may be that the concentration quenching rate of complex Ir2 is lower than that of complex Ir1, resulting in a smaller efficiency roll off of device D2 than that of device D1. The longer phosphorescence lifetime of complex Ir4 makes the roll off of device D3 larger. Although complex Ir5 had the highest PL efficiency, the EL efficiency (15.4 cd A−1 and 6.2%) of device D4 was the lowest due to the poor thermal stability and electrical properties of complex Ir5. In order to compare the performance with other iridium complexes, we also tested the device performance of commercial iridium complex PO-01 under the same conditions (Fig. S2, Table S3†). The control device shows the maximum EQE of 13.1%, thus explaining the high efficiency of our materials to a certain extent.
| Device (dopant) |
λ
EL![[thin space (1/6-em)]](https://www.rsc.org/images/entities/char_2009.gif) a (nm) a (nm) |
V
on![[thin space (1/6-em)]](https://www.rsc.org/images/entities/char_2009.gif) b (V) b (V) |
L (cd m−2) | CEd (cd A−1) | PEd (lm W−1) | EQEd (%) | CIEa (x, y) |
|---|---|---|---|---|---|---|---|
| a Values at 6 V. b Turn on voltages at 1 cd m−2. c Maximum luminance. d Maximum efficiency (efficiency at 1000 cd m−2). | |||||||
| D1 (Ir1) | 526 | 3.1 | 24![[thin space (1/6-em)]](https://www.rsc.org/images/entities/char_2009.gif) 510 510 |
48.5 (39.7) | 47.6 (29.6) | 17.1 (13.9) | (0.34, 0.61) |
| D2 (Ir2) | 592 | 4.0 | 19![[thin space (1/6-em)]](https://www.rsc.org/images/entities/char_2009.gif) 067 067 |
46.4 (42.4) | 35.6 (25.9) | 27.5 (25.1) | (0.60, 0.40) |
| D3 (Ir4) | 596 | 3.9 | 7860 | 33.3 (20.5) | 26.7 (11.5) | 24.0 (14.8) | (0.62, 0.38) |
| D4 (Ir5) | 588 | 3.6 | 2637 | 15.4 (5.4) | 12.6 (2.9) | 6.2 (2.3) | (0.42, 0.45) |
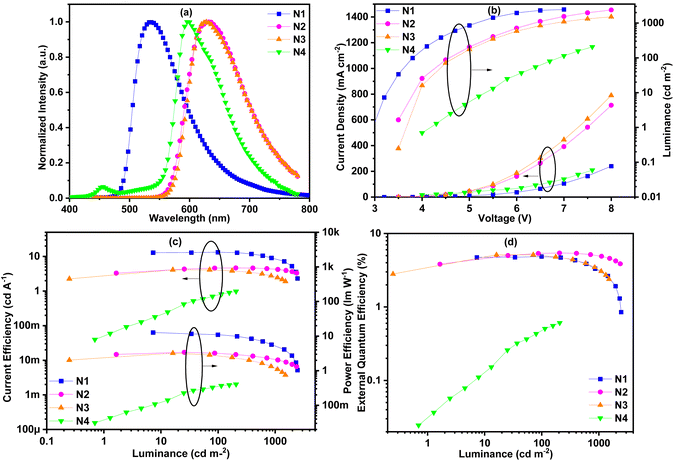
In order to further study the concentration quenching properties of the complexes, non-doped devices were fabricated. The thickness of the neat complex emitting layer was reduced to 10 nm and the mCP layer was also removed while the other structures remained unchanged in these non-doped devices. The EL spectra of non-doped devices N1–N4 have undergone different degrees of red-shift compared to the corresponding EL spectra of the doped devices (Fig. 9 and Table 3). Devices N2 (40 nm) and N3 (32 nm) showed a much larger red-shift than device N1 (8 nm) due to the larger conjugation of complexes Ir2 and Ir4 than that of complex Ir1. Devices N4 and N1 showed the same red-shift value, indicating that the concentration quenching of complex Ir5 is the smallest and the intermolecular interaction is the weakest. It is worth noting that, unlike the EL spectra of other non-doped devices, the EL spectra of device N4 exhibited a new peak at 456 nm, which may come from the adjacent functional layers or interface electroplex. In other words, the carrier transport performance of complex Ir5 is poor, and the carrier cannot be effectively limited in the light-emitting layer. Due to the milder device preparation conditions, the shoulder peak near 520 nm did not appear in the EL spectrum of N4, indicating that the partial decomposition of the complex did not occur. The turn-on voltages of these devices were between 3.0 V and 4.3 V. The highest maximum luminance values of these devices were between 207 and 2457 cd m−2. For the above reasons, device N4 had the highest turn-on voltage (4.3 V) and the lowest maximum brightness (207 cd m−2). Due to concentration quenching and unbalanced carrier transmission, the performances of these non-doped devices were significantly reduced. The maximum CE efficiencies were between 1.0 and 13.3 cd A−1 with the maximum EQEs in the range of 0.6%–5.4%. Device N2 exhibited the highest EQE of 5.4%, and a smaller efficiency roll off than devices N1 and N3. This indicates that the device N2 has lower concentration quenching than devices N1 and N3. Although the EL efficiency of device N4 is the worst, its efficiency roll-off is the lowest, which further confirms its minimum concentration quenching rate.
| Device (complex) |
λ
EL![[thin space (1/6-em)]](https://www.rsc.org/images/entities/char_2009.gif) a (nm) a (nm) |
V
on![[thin space (1/6-em)]](https://www.rsc.org/images/entities/char_2009.gif) b (V) b (V) |
L (cd m−2) | CEd (cd A−1) | PEd (lm W−1) | EQEd (%) | CIEa (x, y) |
|---|---|---|---|---|---|---|---|
| a Values at 6 V. b Turn on voltages at 1 cd m−2. c Maximum luminance. d Maximum efficiency. | |||||||
| N1 (Ir1) | 534 | 3.0 | 2457 | 13.3 | 12.7 | 4.9 | (0.39,0.58) |
| N2 (Ir2) | 632 | 3.5 | 2375 | 4.7 | 3.4 | 5.4 | (0.65, 0.35) |
| N3 (Ir4) | 628 | 4.0 | 1513 | 4.1 | 3.2 | 5.1 | (0.66, 0.34) |
| N4 (Ir5) | 596 | 4.3 | 207 | 1.0 | 0.4 | 0.6 | (0.58, 0.38) |
Conclusions
In summary, to effectively reduce the interaction between iridium complexes, five novel iridium complexes were successfully synthesized by fusing the triptycene groups and phthalazine/pyridazine-based homoleptic Ir(III) complexes through reasonable molecular design and an improved synthesis route. In the crystals of complexes Ir1–Ir3, Ir2 has the minimal intermolecular interaction and intramolecular repulsion. These complexes exhibited excellent thermal stability (Td > 436 °C) except for complex Ir5. All these complexes exhibited high PL QYs above 73.7% in PMMA films. The frontier molecular orbital energy levels and distributions of these complexes were investigated by CV and DFT calculations. The calculation results showed that LUMO orbitals were mainly distributed on heterocycles, and triptycene groups pushed up the LUMO and increased the Eoptg value of the complexes. The introduction of electron-rich diphenylamine groups would make them occupy the main HOMO orbitals, thus reducing the proportion of MLCT transitions in this complex. The phosphorescent OLEDs of these complexes exhibited good performance. The device based on complex Ir2 exhibited the maximum luminance of 19![[thin space (1/6-em)]](https://www.rsc.org/images/entities/char_2009.gif) 067 cd m−2 and the maximum CE and EQE of 46.4 cd A−1 and 27.5%, respectively. The efficiency roll-off of this device was also very low, and at the practicable brightness of 1000 cd m−2, its EQE was still as high as 25.1%. This work demonstrated that the triptycene skeleton has great potential in reducing the intermolecular interaction of iridium complexes and improving the comprehensive properties of iridium complex phosphorescent materials. It provides a successful paradigm for the design and preparation of high-performance electroluminescent materials.
067 cd m−2 and the maximum CE and EQE of 46.4 cd A−1 and 27.5%, respectively. The efficiency roll-off of this device was also very low, and at the practicable brightness of 1000 cd m−2, its EQE was still as high as 25.1%. This work demonstrated that the triptycene skeleton has great potential in reducing the intermolecular interaction of iridium complexes and improving the comprehensive properties of iridium complex phosphorescent materials. It provides a successful paradigm for the design and preparation of high-performance electroluminescent materials.
Experimental
Preparation of ligands
![[thin space (1/6-em)]](https://www.rsc.org/images/entities/char_2009.gif) :
:![[thin space (1/6-em)]](https://www.rsc.org/images/entities/char_2009.gif) v = 10
v = 10![[thin space (1/6-em)]](https://www.rsc.org/images/entities/char_2009.gif) :
:![[thin space (1/6-em)]](https://www.rsc.org/images/entities/char_2009.gif) 1) as the eluent to yield L1 (0.81 g, 74% yield) as a white solid. 1H NMR (400 MHz, CDCl3) δ 8.06 (s, 2 H), 8.04 (d, J = 8.0 Hz, 2 H), 7.90 (d, J = 8.4 Hz, 2 H), 7.82 (t, J = 7.6 Hz, 2 H), 7.50–7.43 (m, 4 H), 7.17–7.11 (m, 4 H), 5.84 (s, 2 H). 19F NMR (377 MHz, CDCl3) δ −62.72 (s, 6 F). HRMS ((+)-ESI): m/z = 545.1454 (calcd 545.1452 for [C22H13F6N2] [M + H]+).
1) as the eluent to yield L1 (0.81 g, 74% yield) as a white solid. 1H NMR (400 MHz, CDCl3) δ 8.06 (s, 2 H), 8.04 (d, J = 8.0 Hz, 2 H), 7.90 (d, J = 8.4 Hz, 2 H), 7.82 (t, J = 7.6 Hz, 2 H), 7.50–7.43 (m, 4 H), 7.17–7.11 (m, 4 H), 5.84 (s, 2 H). 19F NMR (377 MHz, CDCl3) δ −62.72 (s, 6 F). HRMS ((+)-ESI): m/z = 545.1454 (calcd 545.1452 for [C22H13F6N2] [M + H]+).
![[thin space (1/6-em)]](https://www.rsc.org/images/entities/char_2009.gif) :
:![[thin space (1/6-em)]](https://www.rsc.org/images/entities/char_2009.gif) v = 4
v = 4![[thin space (1/6-em)]](https://www.rsc.org/images/entities/char_2009.gif) :
:![[thin space (1/6-em)]](https://www.rsc.org/images/entities/char_2009.gif) 1) as the eluent to yield L4 (0.98 g, 77%) as a light yellow solid. 1H NMR (400 MHz, CDCl3) δ 8.03 (s, 1 H), 7.91 (d, J = 7.6 Hz, 1 H), 7.85 (s, 1 H), 7.83–7.77 (m, 2 H), 7.70 (t, J = 7.7 Hz, 1 H), 7.43–7.40 (m, 2 H), 7.38–7.34 (m, 2 H), 7.29–7.25 (m, 4 H), 7.12–7.03 (m, 10 H), 5.56 (s, 1 H), 5.39 (s, 1 H). 19F NMR (377 MHz, CDCl3) δ −62.50 (s, 3 F). HRMS ((+)-ESI): m/z = 618.2142 (calcd 618.2157 for [C41H27F3N3][M + H]+).
1) as the eluent to yield L4 (0.98 g, 77%) as a light yellow solid. 1H NMR (400 MHz, CDCl3) δ 8.03 (s, 1 H), 7.91 (d, J = 7.6 Hz, 1 H), 7.85 (s, 1 H), 7.83–7.77 (m, 2 H), 7.70 (t, J = 7.7 Hz, 1 H), 7.43–7.40 (m, 2 H), 7.38–7.34 (m, 2 H), 7.29–7.25 (m, 4 H), 7.12–7.03 (m, 10 H), 5.56 (s, 1 H), 5.39 (s, 1 H). 19F NMR (377 MHz, CDCl3) δ −62.50 (s, 3 F). HRMS ((+)-ESI): m/z = 618.2142 (calcd 618.2157 for [C41H27F3N3][M + H]+).
Preparation of Ir complexes
Ir1: A solution of IrCl3·3H2O (0.70 g, 2 mmol) and ligand L1 (3.3 g, 6 mmol) in 2-ethoxyethanol (24 mL)/H2O (8 mL) was refluxed for 24 h under nitrogen. Then, the solvent was removed by vacuum distillation, and the residue was purified by column chromatography (silica gel, petroleum ether/CH2Cl2 (v![[thin space (1/6-em)]](https://www.rsc.org/images/entities/char_2009.gif) :
:![[thin space (1/6-em)]](https://www.rsc.org/images/entities/char_2009.gif) v = 1
v = 1![[thin space (1/6-em)]](https://www.rsc.org/images/entities/char_2009.gif) :
:![[thin space (1/6-em)]](https://www.rsc.org/images/entities/char_2009.gif) 1)) to obtain pure Ir1 (1.1 g, 31%) as a yellow solid. 1H NMR (400 MHz, CDCl3) δ 8.50 (s, 3 H), 7.56 (d, J = 7.2 Hz, 3 H), 7.45 (d, J = 7.6 Hz, 3 H), 7.33 (d, J = 7.2 Hz, 3 H), 7.30–7.21 (m, 12 H), 7.15–7.06 (m, 9 H), 7.01 (t, J = 7.6 Hz, 3 H), 6.97 (t, J = 7.6 Hz, 3 H), 6.63 (t, J = 8.0 Hz, 3 H), 6.57 (s, 3 H), 6.36 (d, J = 7.6 Hz, 3 H), 5.51 (s, 3 H). 19F NMR (377 MHz, CDCl3) δ −61.77 (s, 9 F), −62.55 (s, 9 F). HRMS ((+)-ESI): m/z = 1824.3674 (calcd 1824.3629 for [C96H52F18N6Ir] [M + H+]).
1)) to obtain pure Ir1 (1.1 g, 31%) as a yellow solid. 1H NMR (400 MHz, CDCl3) δ 8.50 (s, 3 H), 7.56 (d, J = 7.2 Hz, 3 H), 7.45 (d, J = 7.6 Hz, 3 H), 7.33 (d, J = 7.2 Hz, 3 H), 7.30–7.21 (m, 12 H), 7.15–7.06 (m, 9 H), 7.01 (t, J = 7.6 Hz, 3 H), 6.97 (t, J = 7.6 Hz, 3 H), 6.63 (t, J = 8.0 Hz, 3 H), 6.57 (s, 3 H), 6.36 (d, J = 7.6 Hz, 3 H), 5.51 (s, 3 H). 19F NMR (377 MHz, CDCl3) δ −61.77 (s, 9 F), −62.55 (s, 9 F). HRMS ((+)-ESI): m/z = 1824.3674 (calcd 1824.3629 for [C96H52F18N6Ir] [M + H+]).
Ir2: This compound was prepared from L2 by a procedure similar to that used for Ir1. Red solid, 21%. 1H NMR (400 MHz, CDCl3) δ 8.62 (s, 3 H), 8.26 (s, 3 H), 7.63 (s, 3 H), 7.57–7.52 (m, 6 H), 7.49 (d, J = 7.0 Hz, 3 H), 7.44–7.40 (m, 3 H), 7.34 (d, J = 7.1 Hz, 3 H), 7.29 (dd, J = 8.1, 1.3 Hz, 3 H), 7.21–7.15 (m, 6 H), 7.14–7.05 (m, 9 H), 6.82 (d, J = 8.0 Hz, 3 H), 6.37 (d, J = 7.8 Hz, 3 H), 5.90 (t, J = 7.8 Hz, 3 H), 5.60 (s, 3 H), 5.51 (s, 3 H). 19F NMR (377 MHz, CDCl3) δ −61.45 (s, 9 F), −62.56 (s, 9 F). HRMS((+)-ESI): m/z = 1973.3998 (calcd 1973.4020 for [C108H57F18IrN6][M]+).
Ir3: This compound was prepared from L3 by a procedure similar to that used for Ir1. Red solid, 28%. 1H NMR (400 MHz, CDCl3) δ 8.80 (s, 3 H), 8.13 (d, J = 8.3 Hz, 3 H), 7.64 (d, J = 1.5 Hz, 3 H), 7.53 (t, J = 7.2 Hz, 6 H), 7.45 (s, 3 H), 7.42–7.32 (m, 9 H), 7.14–7.01 (m, 12 H), 6.70 (d, J = 8.0 Hz, 6 H), 6.07 (d, J = 7.9 Hz, 6 H), 5.70 (s, 3 H), 5.50 (s, 3 H). 19F NMR (377 MHz, CDCl3) δ −62.12 (s, 9 F), −63.04 (s, 9 F). HRMS((+)-ESI): m/z = 1973.3984 (calcd 1973.4020 for [C108H57F18IrN6][M]+).
Ir4: A solution of Ir(acac)3 (12 mg, 0.025 mmol) and ligand L4 (50 mg, 0.08 mmol) in o-dichlorobenzene (2 mL)/diethylene glycol monomethyl ether (4 mL)/glycerol (6 mL) was refluxed for 48 h under nitrogen. Then the mixture was quenched with H2O and extracted with CH2Cl2. The combined organic layers were dried. The solvent was removed in vacuo. The residue was purified by column chromatography on silica gel using petroleum ether/CH2Cl2 (v![[thin space (1/6-em)]](https://www.rsc.org/images/entities/char_2009.gif) :
:![[thin space (1/6-em)]](https://www.rsc.org/images/entities/char_2009.gif) v = 4
v = 4![[thin space (1/6-em)]](https://www.rsc.org/images/entities/char_2009.gif) :
:![[thin space (1/6-em)]](https://www.rsc.org/images/entities/char_2009.gif) 1) as the eluent to yield Ir4 (18 mg, 36%) as a red solid. 1H NMR (400 MHz, CDCl3) δ 8.45 (s, 3 H), 8.02 (s, 3 H), 7.67 (d, J = 6.9 Hz, 3 H), 7.46 (s, 3 H), 7.43 (d, J = 6.9 Hz, 3 H), 7.33–7.27 (m, 9 H), 7.14 (td, J = 7.5, 1.2 Hz, 3 H), 7.07–6.96 (m, 9 H), 6.91 (d, J = 8.0 Hz, 3 H), 6.46–6.29 (m, 18 H), 6.07 (t, J = 7.8 Hz, 12 H), 5.64 (s, 3 H), 5.28 (s, 3 H). 19F NMR (377 MHz, CDCl3) δ −61.24 (s, 9 F). HRMS((+)-ESI): m/z = 1022.2915 (calcd 1022.2911 for [C123H77F9IrN9][M + 2H]2+).
1) as the eluent to yield Ir4 (18 mg, 36%) as a red solid. 1H NMR (400 MHz, CDCl3) δ 8.45 (s, 3 H), 8.02 (s, 3 H), 7.67 (d, J = 6.9 Hz, 3 H), 7.46 (s, 3 H), 7.43 (d, J = 6.9 Hz, 3 H), 7.33–7.27 (m, 9 H), 7.14 (td, J = 7.5, 1.2 Hz, 3 H), 7.07–6.96 (m, 9 H), 6.91 (d, J = 8.0 Hz, 3 H), 6.46–6.29 (m, 18 H), 6.07 (t, J = 7.8 Hz, 12 H), 5.64 (s, 3 H), 5.28 (s, 3 H). 19F NMR (377 MHz, CDCl3) δ −61.24 (s, 9 F). HRMS((+)-ESI): m/z = 1022.2915 (calcd 1022.2911 for [C123H77F9IrN9][M + 2H]2+).
Ir5: This compound was prepared from L5 by a procedure similar to that used for Ir4. Red solid, 46%. 1H NMR (400 MHz, CDCl3) δ 8.69 (s, 3 H), 8.31 (s, 3 H), 7.57–7.30 (m, 14 H), 7.30–6.8 (m, 13 H), 6.23–6.05 (br, 3 H), 5.97–5.73 (br, 3 H), 5.54 (s, 3 H), 5.35 (s, 3 H), 1.59 (s, 24 H), 1.30–1.14 (m, 72 H). 19F NMR (377 MHz, CDCl3) δ −61.45 (s, 9 F), −62.67 (s, 9 F). MALDI-TOF-MS: m/z = 2636.188 (calcd 2636.075 for [C156H143F18IrN6][M + H]+).
Conflicts of interest
There are no conflicts to declare.Acknowledgements
This work was supported by the National Natural Science Foundation of China (21572001 and 61875144), the Scientific Research Project of Anhui Provincial Department of Education (YJS20210332), the Distinguished Professor of the Wanjiang Scholars Project, the Scientific Research Project of Anhui Provincial Department of Education (YJS20210332), the Anhui special support plan (T000609), the Suzhou Key Laboratory of Functional Nano & Soft Materials, the Collaborative Innovation Center of Suzhou Nano Science and Technology (NANO-CIC), the 111 Project and the Joint International Research Laboratory of Carbon-Based Functional Materials and Devices.References
- Y. Chi, T. K. Chang, P. Ganesan and P. Rajakannu, Emissive bis-tridentate Ir(III) metal complexes: tactics, photophysics and applications, Coord. Chem. Rev., 2017, 346, 91 CrossRef CAS.
- X. L. Yang, G. J. Zhou and W. Y. Wong, Functionalization of phosphorescent emitters and their host materials by main-group elements for phosphorescent organic light-emitting devices, Chem. Soc. Rev., 2015, 44, 8484 RSC.
- P. Tao, Y. Q. Miao, H. Wang, B. S. Xu and Q. Zhao, High-performance organic electroluminescence: Design from organic light-emitting materials to devices, Chem. Rec., 2019, 19, 1531 CrossRef CAS.
- T. Y. Li, J. Wu, Z. G. Wu, Y. X. Zheng, J. L. Zuo and Y. Pan, Rational design of phosphorescent iridium(III) complexes for emission color tenability and their applications in OLEDs, Coord. Chem. Rev., 2018, 374, 55 CrossRef CAS.
- H. Z. Xie, M. W. Liu, O. Y. Wang, X. H. Zhang, C. S. Lee, L. S. Hung, S. T. Lee, P. F. Teng, H. L. Kwong, H. Zheng and C. M. Che, Reduction of self–quenching effect in organic electrophosphorescence emitting devices via the use of sterically hindered spacers in phosphorescence molecules, Adv. Mater., 2001, 13, 1245 CrossRef CAS.
- (a) X. Zhuang, H. Wang, D. Xu, Y. Liu and Y. Wang, High-quality warm white organic electroluminescence from efficient phosphor-only emitting systems based on bipolar iridium(III) complexes, J. Mater. Chem. C, 2020, 8, 16730 RSC; (b) Y. Feng, J. Xue, H. Zhang, T. Lu, K. Ye and Y. Liu, Simple/efficient solution-processed emitting systems dominated by a novel bipolar small-molecule iridium(III) complex, Adv. Mater., 2021, 2, 5906 RSC; (c) C. You, D. Liu, F. Meng, Y. Wang, J. Yu and S. Wang, Iridium(III) phosphors with rigid fused-heterocyclic chelating architectures for efficient deep-red/near-infrared emissions in polymer light-emitting diodes, J. Mater. Chem. C, 2019, 7, 10961 RSC; (d) S. Chen, X. Gai, J. Liang, K. Ye, Y. Liu and Y. Wang, Highly efficient phosphorescent organic light-emitting diodes based on novel bipolar iridium complexes with easily-tuned emission colors by adjusting fluorine substitution on phenylpyridine ligands, J. Mater. Chem. C, 2021, 9, 8329 RSC; (e) G. Li, P. Li, X. Zhuang, K. Ye, Y. Liu and Y. Wang, Rational design and characterization of heteroleptic phosphorescent complexes for highly efficient deep-red organic light-emitting devices, ACS Appl. Mater. Interfaces, 2017, 9, 11749 CrossRef CAS PubMed.
- B. H. Tong, H. Wang, M. Chen, S. X. Zhou, Y. Y. Hu and Q. F. Zhang, High efficiency green OLEDs based on homoleptic iridium complexes with steric phenylpyridazine ligands, Dalton Trans., 2018, 47, 12243 RSC.
- M. Zhu, Y. Li, S. Hu, C. Li, C. Yang and H. Wu, Iridium phosphors with peripheral triphenylamine encapsulation: highly efficient solution-processed red electrophosphorescence, Chem. Commun., 2012, 48, 2695 RSC.
- L. Chen, S. Wang, Z. Yan, J. Ding and L. Wang, An oligocarbazole-encapsulated heteroleptic red iridium complex for solution-processed nondoped phosphorescent organic light-emitting diodes with over 10% external quantum efficiency, J. Mater. Chem. C, 2017, 5, 5749 RSC.
- Y. Wada, H. Nakagawa, S. Matsumoto, Y. Wakisaka and H. Kaji, Organic light emitters exhibiting very fast reverse intersystem crossing, Nat. Photonics, 2020, 14, 643 CrossRef CAS.
- Q. Zhan, C. Cao, T. A. Huang, C. J. Zhou, Z. Y. Xie, Y. Zou, C. S. Lee and C. L. Yang, 3D triptycene-fused acridine electron donor enables high-efficiency nondoped thermally activated delayed fluorescent OLEDs, Adv. Opt. Mater., 2021, 9, 2100273 CrossRef CAS.
- Y. Y. Jing, X. D. Tao, M. X. Yang, X. L. Chen and C. Z. Lu, Triptycene-imbedded thermally activated delayed fluorescence emitters with excellent film morphologies for applications in efficient nondoped and doped organic light-emitting devices, Chem. Eng. J., 2021, 413, 127418 CrossRef CAS.
- Y. Y. Huang, D. H. Zhang, X. D. Tao, Z. Z. Wei, S. S. Jiang, L. Y. Meng, M. X. Yang, X. L. Chen and C. Z. Lu, Triptycene-derived thermally activated delayed fluorescence emitters with combined through-bond and through-space charge transfers, Dyes Pigm., 2022, 204, 110397 CrossRef CAS.
- H. H. Chou, H. H. Shih and C. H. Cheng, Triptycene derivatives as high-Tg host materials for various electrophosphorescent devices, J. Mater. Chem., 2010, 20, 798 RSC.
- Y. Wang, Y. P. Xiao, Y. Y. Zhou, C. G. Hu, B. H. Tong, S. H. Ye and Q. B. Mei, Novel phosphorescent triptycene-based Ir(III) complexes for organic light-emitting diodes, Dalton Trans., 2019, 48, 16289 RSC.
- (a) Y. Y. Hu, W. Luo, C. G. Hu, Y. Wang, B. H. Tong, M. K. Fung, Y. P. Tian and Q. F. Zhang, The one-pot synthesis of homoleptic phenylphthalazine iridium(III) complexes and their application in high efficiency OLEDs, J. Lumin., 2020, 219, 116846 CrossRef CAS; (b) B. H. Tong, Q. B. Mei, S. J. Wang, Y. Fang, Y. Z. Meng and B. Wang, Nearly 100% internal phosphorescence efficiency in a polymer light-emitting diode using a new iridium complex phosphor, J. Mater. Chem., 2008, 18, 1636 RSC; (c) B. X. Mi, P. F. Wang, Z. Q. Gao, C. S. Lee, S. T. Lee and H. L. Hong, Strong luminescent iridium complexes with C^N=N structure in ligands and their potential in efficient and thermally stable phosphorescent OLEDs, Adv. Mater., 2009, 21, 339 CrossRef CAS; (d) Y. Fang, Y. H. Li, S. J. Wang, Y. Z. Meng, J. B. Peng and B. Wang, Synthesis, characterization and electroluminescence properties of iridium complexes based on pyridazine and phthalazine derivatives with C^N=N structure, Synth. Met., 2010, 160, 2231 CrossRef CAS; (e) Y. Fang, B. H. Tong, S. J. Hu, S. J. Wang, Y. Z. Meng and J. B. Peng, A highly efficient tris-cyclometalated iridium complex based on phenylphthalazine derivative for organic light-emitting diodes, Org. Electron., 2009, 10, 618 CrossRef CAS; (f) Y. Fang, S. J. Hu, Y. Z. Meng, J. B. Peng and B. Wang, Synthesis of a novel tris-cyclometalated iridium(III) complex containing triarylamine unit and its application in OLEDs, Inorg. Chim. Acta, 2009, 362, 4985 CrossRef CAS; (g) Q. B. Mei, L. X. Wang, B. Tian, B. H. Tong, J. N. Weng and B. Zhang, Highly efficient red iridium(III) complexes based on phthalazine derivatives for organic light-emitting diodes, Dyes Pigm., 2013, 97, 43 CrossRef CAS.
- Q. B. Mei, L. Liu, J. C. Yang, X. Y. Jiang, S. H. Ye, L. Zhang and B. H. Tong, Aza-triptycene-based homoleptic tris-cyclometalated iridium(III) complexes as highly efficient phosphors in green OLEDs, Dyes Pigm., 2022, 199, 110075 CrossRef CAS.
- J. Bouffard, R. F. Eaton, P. Muller and T. M. Swager, Iptycene-derived pyridazines and phthalazines, J. Org. Chem., 2007, 72, 10166 CrossRef CAS.
- R. G. D. Taylor, M. Carta, C. G. Bezzu, J. Walker, K. J. Msayib, B. M. Kariuki and N. B. McKeown, Triptycene-based organic molecules of intrinsic microporosity, Org. Lett., 2014, 16, 1848 CrossRef CAS PubMed.
- H. C. Mu, Y. X. Jiang and H. F. Xie, Efficient blue phosphorescent organic light emitting diodes based on exciplex and ultrathin Firpic sandwiched layer, Org. Electron., 2019, 66, 195 CrossRef CAS.
Footnotes |
| † Electronic supplementary information (ESI) available. CCDC 2132294, 2132295 and 2132297. For ESI and crystallographic data in CIF or other electronic format see DOI: https://doi.org/10.1039/d2qi01786e |
| ‡ These authors contributed equally. |
| This journal is © the Partner Organisations 2023 |

