 Open Access Article
Suppression of intrinsic thermal conductivity in Sr1−xGdxTiO3 ceramics via phonon-point defect scattering for enhanced thermoelectric application
R. Shanmuka Sundaria,
S. Harish ab,
V. Vijay
 a,
M. Shimomura
 b,
S. Ponnusamy*a,
J. Archana
 a and
M. Navaneethan
 *ac
*ac
aFunctional Materials and Energy Devices Laboratory, Department of Physics and Nanotechnology, SRM Institute of Science and Technology, Kattankulathur, 603 203, India. E-mail: m.navaneethan@gmail.com
bGraduate School of Science and Technology, Shizuoka University, 3-5-1 Johoku, Naka-Ku, Hamamatsu, Shizuoka 432-8011, Japan
cNanotechnology Research Center (NRC), SRM Institute of Science and Technology, Kattankulathur-603 203, India. E-mail: suruponnus@gmail.com
First published on 23rd December 2022
Abstract
A substantial reduction in the thermal conductivity for strontium titanate (ABO3) perovskite structure was realized for the A-site substitution of gadolinium (rare earth element) in SrTiO3 ceramics. The effect of Gd3+ substitution on the structure, composition, and thermoelectric properties of SrTiO3 was investigated. The substitution of Gd3+ in the SrTiO3 matrix resulted in the minimalization of thermal conductivity. The thermal conductivity followed a similar trend as that of thermal diffusivity, but specific heat capacity exhibited a non-monotonic trend. The thermal conductivity is reduced to 1.05 W m−1 K−1 for the minimal substitutional composition (Sr0.99Gd0.01TiO3) which is 30% less than that of SrTiO3 at 303 K. The variation in the ionic radii and atomic mass of the heavier rare earth Gd3+ substituted over Sr2+ resulted in the reduction of thermal conductivity of SGTO ceramics caused by the corresponding boundary scattering at low temperatures and temperature-independent phonon-impurity scattering at high temperatures.
Introduction
Thermoelectric (TE) materials involve the effective conversion of a temperature gradient to a voltage difference and vice versa. TE materials and devices tend to possess prominent applications in thermoelectric devices for heating and cooling which is primarily the generation of power based on waste heat recovery.1,2 The conversion efficiency of the TE module or device is generally determined based on the dimensionless thermoelectric figure of merit (zT), and the equation is
 | (1) |
Doping is one of the most immensely investigated strategies for either increasing the power factor or decreasing the total thermal conductivity. When substituting the A-site of SrTiO3 with the rare earth (RE) elements of higher ionic radii than Sr2+ ion could enhance the electrical properties, whereas low ionic radii will lead to a reduction in the thermal conductivity of the SrTiO3 ceramics.24
Besides, substituting Sr or Ti site with rare earth ions with dissimilar ionic radii was reported to induce disorders in lattice such as lattice strains concurrently influencing the thermoelectric performance of SrTiO3 ceramic materials.25 Trivalent rare earth RE3+ ions are often used for improving the reliability of strontium or barium (alkaline earth metal) Sr/Ba titanates.26 Gd was chosen typically due to its small ionic radius to substitute Sr2+ ion, leading to the large lattice distortion.27 There have been many investigations owing to the influence of RE doping and substitution which resulted in improved TE performance of SrTiO3 ceramics. Reportedly, the 10% substitution of La, Nd, and Sm in the Sr-site resulted in power factor enhancement. Instead, a 10% substitution of Gd, Dy, Er, and Y led to a reduction in thermal conductivity. Therefore, the substitution of La (higher ionic radius) and Yb (lower ionic radius) in-Sr site was reported to obtain the zT of 0.31 at 973 K.24 Similarly, the investigation of the ionic radius-dependent reduction in thermal conductivity of 2 W m−1 K−1 at 1273 K was reported by Kovalevsky et al.28
In this work, the thermal transport properties of Gd-substituted SrTiO3 have been discussed and reported for the different compositions of Sr1−xGdxTiO3 ceramics. Reducing the thermal conductivity of the SrTiO3 matrix is the main objective of this investigation. The SGTO ceramics were prepared by the solid–state reaction method and fabricated using the cold isostatic technique. After sintering in air, the SGTO ceramic samples were subjected to structural, and morphological analysis and thermoelectric properties were investigated over the temperature range of 303–903 K. A prominent minimalization in thermal diffusivity and thermal conductivity was achieved over a range of 303–903 K.
Experimental procedure
Pure and Gd-substituted SrTiO3 were prepared by conventional solid–state reaction techniques using SrCO3 (99.8%), TiO2 (99.8%), and Gd2O3 (99.9%) powders. The precursor powders were weighed according to the stoichiometric ratio for the pure SrTiO3, Sr0.99Gd0.01TiO3, Sr0.97Gd0.03TiO3, and Sr0.95Gd0.05TiO3 compositions and pulverized using mortar and pestle to obtain homogeneity of the mixture. The mixture was placed in the alumina crucible and then calcined at 1373 K in the air for 12 h. After calcination, the powders were prepared for pelletization. The calcined powders were weighed accordingly and loaded in a hardened stainless-steel die and further subjected to densification using uniaxial pressing with a cold isostatic press. A pressure of 40 MPa was applied for pelletization. This resulted in pellets with the dimensions of Φ = 13 mm and d = 2 mm. The as-prepared pellets were sintered in air at 1373 K. The sintered discs were named STO, SGTO1, SGTO3 and SGTO5 for the composition of Sr1−xGdxTiO3 (x = 0.01, 0.03 and 0.05), respectively.Characterization
X-ray diffraction analyses were performed using an X-ray diffractometer (PANalytical Bench Top). X-Ray photoelectron spectroscopy (XPS) measurements were carried out with X-ray Photoelectron spectroscopy (XPS) PHI Versaprobe III. Microstructural observations were done with a field emission scanning electron microscope with energy-dispersive X-ray spectrometry (HRSEM/EDS; Thermosceintific Apreo S) and high-resolution transmission electron microscope (JEOL Japan, JEM-2100 Plus). The thermal diffusivity (D) was measured using the laser flash method (NETZSCH, LFA 467 HT, Germany), and the specific heat capacity (Cp) was derived in the temperature ranging from 303–903 K range. The total thermal conductivity (κ) of a sample was calculated using the relationship κ = DCpρ. The density ρ plays important role in conductivity according to the above-mentioned relation of total thermal conductivity. In this work, the relative density of as prepared pellet samples was measured by Archimedes principle.Results and discussion
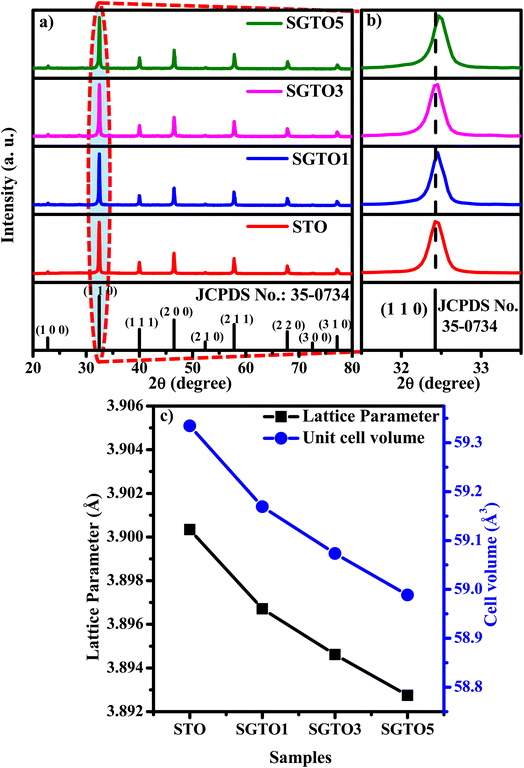
Fig. 1(a) shows the XRD patterns of STO and SGTO ceramics at room temperature. For all the compositions, the observed X-ray diffraction patterns are consistent with the crystallographic structure of SrTiO3. The major peaks were observed at 2θ of 22.7°, 32.4°, 39.9°, 46.4°, 52.3°, 57.7°, 67.8°, 72.5° and 77.1° corresponding to (1 0 0), (1 1 0), (1 1 1), (2 0 0), (2 1 0), (2 1 1), (2 2 0), (3 0 0) and (3 1 0) planes, respectively. The cubic crystal structure with Pm![[3 with combining macron]](https://www.rsc.org/images/entities/char_0033_0304.gif) m space group of STO, SGTO1, SGTO3 and SGTO5 was confirmed from the XRD patterns, which is well matched with JCPDS card no: 35-0734. When compared with the STO sample, the Gd-substituted SGTO ceramic samples exhibited minor shifts in the peak positions. Fig. 1(b) shows the XRD pattern of the (1 1 0) diffraction peak. The diffraction peak shifts toward higher angles with the increase in full width at half maximum (FWHM) with an increase in Gd-substitution.29 This implies that lattice shrinkage has occurred due to the influence of the ionic radii of Gd3+ (0.094 nm) when compared to Sr2+ (0.118 nm). Further, it can be identified from decreasing values of lattice parameter and cell volume with the addition of Gd as in Table 1. From the structural analysis, it can be inferred that the influence of the smaller ionic radii of Gd3+ for Sr2+ led to the distortion of the lattice and increased FWHM in the STO and SGTO ceramics.27
m space group of STO, SGTO1, SGTO3 and SGTO5 was confirmed from the XRD patterns, which is well matched with JCPDS card no: 35-0734. When compared with the STO sample, the Gd-substituted SGTO ceramic samples exhibited minor shifts in the peak positions. Fig. 1(b) shows the XRD pattern of the (1 1 0) diffraction peak. The diffraction peak shifts toward higher angles with the increase in full width at half maximum (FWHM) with an increase in Gd-substitution.29 This implies that lattice shrinkage has occurred due to the influence of the ionic radii of Gd3+ (0.094 nm) when compared to Sr2+ (0.118 nm). Further, it can be identified from decreasing values of lattice parameter and cell volume with the addition of Gd as in Table 1. From the structural analysis, it can be inferred that the influence of the smaller ionic radii of Gd3+ for Sr2+ led to the distortion of the lattice and increased FWHM in the STO and SGTO ceramics.27
| Sample composition | Structure | Lattice parameter (Å) | Unit cell volume (Å3) | Density (g cm−3) | Relative density (%) |
|---|---|---|---|---|---|
| SrTiO3 | Cubic | 3.90034 | 59.3345 | 4.51 | 88.1 |
| Sr0.99Gd0.01TiO3 | Cubic | 3.89671 | 59.1692 | 4.28 | 83.6 |
| Sr0.97Gd0.03TiO3 | Cubic | 3.89461 | 59.0735 | 4.25 | 83.1 |
| Sr0.95Gd0.05TiO3 | Cubic | 3.89274 | 58.9886 | 4.21 | 82.2 |
Fig. 2(a–i) shows the core-level spectra and survey spectra of STO and SGTO5 samples. Fig. 2(a–c) shows the high-resolution XPS spectra of Sr, Ti, Gd and O of STO and SGTO5, respectively. The survey spectra shown in Fig. 2(d–h) confirmed the presence of Sr, Ti, O and Gd in the STO and SGTO5 sample. The high-resolution spectra Sr 3d in Fig. 2(a) shows the doublet peak at 132.1 and 133.9 eV corresponding to 3d5/2 and 3d3/2, respectively. This confirms the Sr2+ state in the STO sample. The peaks at 133.2, and 133.4 eV corresponds to the Sr2+ state due to Sr–OH, Sr–CO3, Sr–Sr and Sr–O bonds at the surface of the STO sample.29,30 Fig. 2(d) shows the two peaks at 132 and 133.7 eV corresponding to Sr 3d5/2 and 3d3/2, respectively. The other two peaks at 133.1 and 134.8 eV correspond to the Sr2+ state due to Sr–OH, Sr–CO3, Sr–Sr and Sr–O bonds at the surface of the SGTO5 sample. Two strong peaks of the Ti 2p spectrum in Fig. 2(b) of the STO sample are located at 457.6 and 463.4 eV, respectively corresponding to the Ti 2p3/2 and Ti 2p1/2 bonding states. This confirms the Ti4+ chemical state in the STO sample. Similarly, the peaks of Ti 2p of SGTO5 was located at 4578 and 463.5 eV corresponds to Ti 2p3/2 and Ti 2p1/2 of Ti4+ state has shown in Fig. 2(e). The peak centred at 456.7 and 464.6 eV of the STO sample and 459.4 and 465.2 eV of the SGTO5 sample could be attributed to titanium with a low valence state corresponding to non-stoichiometric TiO2−x species. The splitting of SrO and reduced TiO2−x peaks implies that a large number of oxygen vacancies are present on the surface of SrTiO3. It is also be inferred that the surface of SrTiO3 may be mainly composed of TiO2−x and SrO species 30–32. In Fig. 2(c), the peaks at 528.9 and 531.6 eV in the O 1s spectra of STO correspond to the lattice oxygen and surface-adsorbed oxygen, respectively. In Fig. 2(f) the peaks at 528.9 and 530.7 eV in SGTO samples correspond to the lattice oxygen and surface-adsorbed oxygen, respectively 30,33. The core spectrum of Gd 3d is shown in Fig. 2(g) exhibits the doublet peaks of Gd 3d5/2 and 3d3/2 at the binding energies of 1187.1 and 1219.1 eV, respectively 34. The spin electron splitting energy of 32 eV confirms the existence of Gd3+ in the SGTO5 sample. The other peaks at 1195.9 and 1228.3 eV could be ascribed to the multiplet and satellite peaks, respectively 35,36. The XPS spectrum in Fig. 2(h) for Gd 4d reveals the peaks centred at 143.6 and 148.4 eV attributed to the Gd 4d5/2 and 4d3/2, respectively, confirming the presence of Gd3+ state in SGTO5 sample. The extra peak at 141.4 and 145.9 eV cannot be attributed to Auger electrons which require high kinetic energy or chemical decomposition which would result in the shift of all the core levels. Since Gd belongs to the heavy lanthanide group element, this splitting can be attributed to the electrostatic interaction between a core level and a partially filled 4f level 33,37. The XPS results further confirm the formation of SrTiO3 and Gd-substituted SrTiO3 ceramic samples, which agrees well with the XRD analysis.
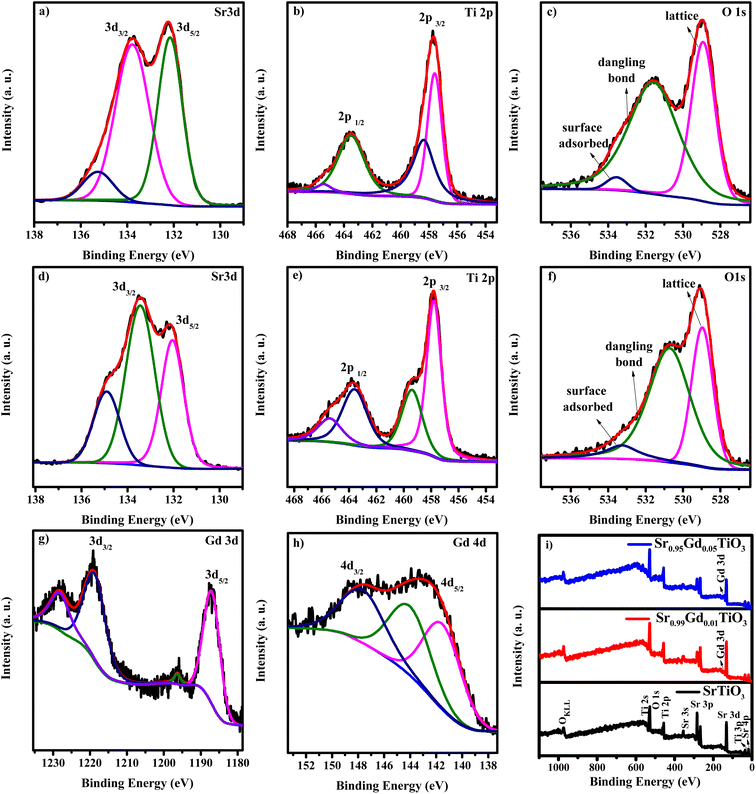 | ||
| Fig. 2 XPS core level spectra of (a–c) Sr 3d, Ti 2p and O 1s of STO sample, (d–h) Sr 3d, Ti 2p, O 1s, Gd 3d and Gd 4d of SGTO5 sample and (i) survey spectra of STO and SGTO5 samples. | ||
FESEM micrograph of STO and SGTO ceramics are shown in Fig. 3(a1–d1). With the increase in the concentration of Gd substitution in SrTiO3, the particle size was observed to increased and illustrated by the particle size distribution plot in Fig. 3(a2–d2).26 Fig. 3(a3–d3) shows the elemental mapping of SGTO1 ceramics, demonstrating the homogenous elemental distribution of Sr, Ti, Gd and O in the sample. Transmission electron microscopy (TEM) was employed for further investigation of the morphology and crystalline quality of the ceramic samples. Fig. 4(a1 and b1) shows the TEM image of STO and SGTO1 ceramics, the images are exhibiting irregular cubic-like morphology.38 HRTEM micrographs shown in Fig. 4(a2, a3, b2 and b3) indicated that STO exhibited high crystalline feature with the d-spacing of 0.291 nm corresponding to the (1 1 0) plane when the d-spacing of (1 1 0) decreased to 0.284 nm for SGTO1. This is consistent with the XRD analysis which is influenced by the smaller ionic radii of Gd3+ compared to Sr2+. Henceforth, the substitution of Gd in SrTiO3 results in a decreased d-spacing.39
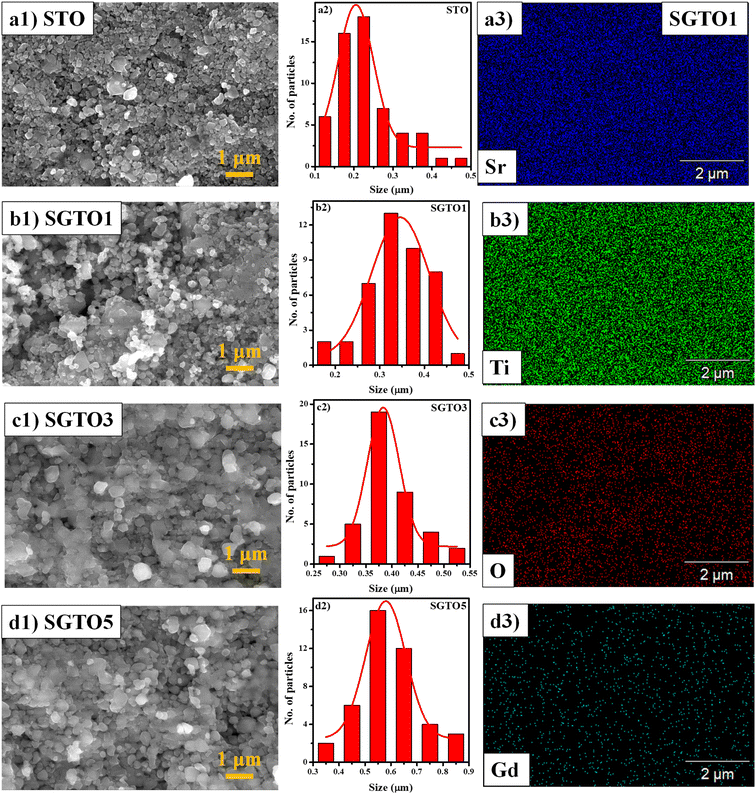 | ||
| Fig. 3 (a1–d1) HRSEM micrographs, (a2–d2) particle size distribution of STO, SGTO1, SGTO3 and SGTO5 ceramics and (a3–d3) elemental mapping of SGTO1 ceramics, respectively. | ||
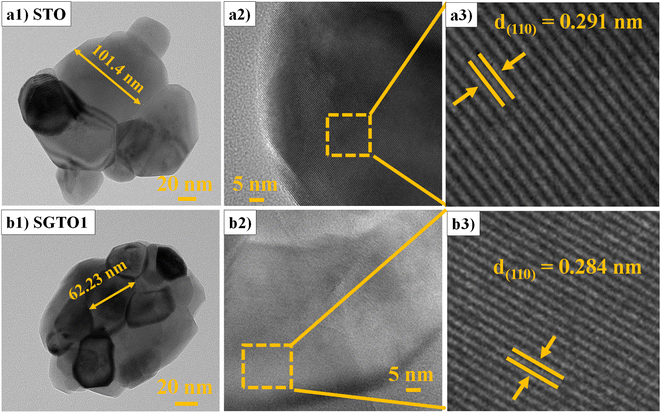 | ||
| Fig. 4 (a1 & b1) TEM and (a2, a3, b2 & b3) HRTEM micrographs of STO and SGTO1 ceramics, respectively. | ||
Temperature-dependent specific heat capacity (Cp) of SGTO ceramics is illustrated in Fig. 5(a) over the temperature range from 303–903 K. In this investigation, the Cp values of STO and SGTO samples vary between 2.2 to 1.1 J g−1 K−1. The Cp value of STO increased from 1.87 to 2.13 J g−1 K−1 at 303–903 K, respectively. At 303 K, the Cp value of the SGTO1 sample was 1.29 J g−1 K−1, it increased to 1.38 J g−1 K−1 at 903 K. However, the Cp values of the SGTO3 sample showed a decreasing property when compared to all other samples. At 303 K, the Cp value of the SGTO3 sample was 1.28 J g−1 K−1 while it decreased to 1.09 J g−1 K−1 at 903 K. The Cp values of the SGTO5 sample increased from 1.69 J g−1 K−1 at 303 K to 1.959 J g−1 K−1 at 903 K. Thus, the Cp values of the STO and SGTO ceramics depicted a discrete property in the temperature range of 303 K to 903 K. This indicated that there was no phase transformation or change in the composition of SrTiO3, while the increase in the Cp values is ascribed to the substitution of heavier element Gd in the SrTiO3 matrix.40–42
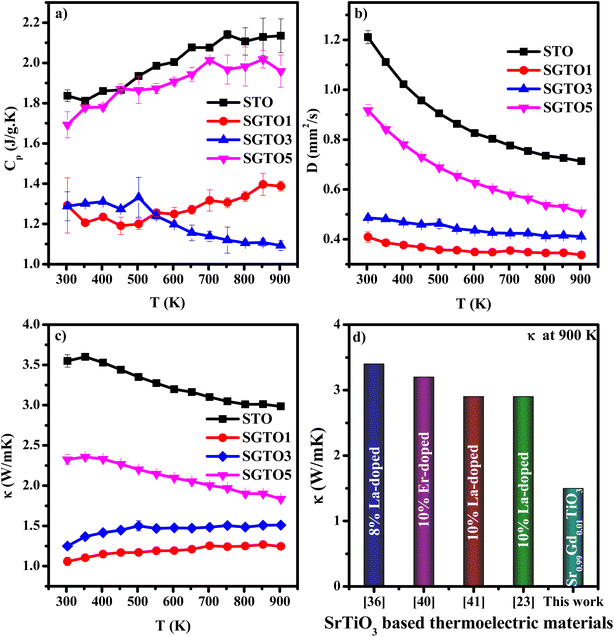 | ||
| Fig. 5 Temperature dependent (a) specific heat capacity (Cp), (b) thermal diffusivity (D) and (c) thermal conductivity (κ) of STO, SGTO1, SGTO3 and SGTO5 ceramics, respectively and (d) comparison plot of thermal conductivity.23,44,48,49 | ||
Temperature-dependent thermal diffusivity (D) of pure and Gd-substituted SrTiO3 is shown in Fig. 5(b) with a temperature range of 303–903 K. The thermal diffusivity of Gd-substituted samples continued to decrease with temperature. The diffusivity of STO was observed to be 1.2 mm2 s−1 at 303 K which continued to decrease almost exponentially with an increase in temperature thereby reaching a minimum of about 0.71 mm2 s−1 at 903 K, respectively. So, for the Gd-substituted samples such as, SGTO1, the D value was observed to be a minimum of 0.4 mm2 s−1 at 303 K which continued to remain the same with minimal variation till 903 K, illustrating almost temperature-independent diffusivity property. The SGTO3 sample also exhibited a similar diffusivity property when compared to the SGTO1 sample. For the SGTO5, the D value of 0.9 mm2 s−1 at 303 K possessed a similar trend of STO and reached 0.5 mm2 s−1 at 903 K. The smaller ionic radii of Gd3+ causing the lattice shrinkage and decreased cell volume influences the decrease in the thermal diffusivity. The declining thermal diffusivity specifically at high temperatures for the STO and SGTO ceramics is attributed to temperature-independent thermal diffusion. On the whole, the obtained thermal diffusivity of Gd-substituted samples was inferred to be reduced than that of pure SrTiO3.
The temperature dependence of thermal conductivity of pure and Gd-substituted SrTiO3 is shown in Fig. 5(c). Significant reduction in thermal conductivity is observed for all Gd substituted samples over the range of 303–903 K. An impressive overall reduction of 35% at 303 K and 50% at 903 K was observed. As the temperature is increasing the thermal conductivity of STO sample decreases from 3.54 W m−1 K−1 at 303 K to 2.9 W m−1 K−1 at 903 K. The thermal conductivity of SGTO1 initially decreased to 1.05 W m−1 K−1 at 303 K when compared to STO. Similarly, the thermal conductivity of SGTO3 decreased to 1.25 W m−1 K−1 at 303 K when compared to STO. The minimum κ was 1.25 W m−1 K−1 for the SGTO1 sample at 303 K. Specifically, for SGTO1 sample, with an increase in temperature the thermal conductivity increased however remaining below 1.5 W m−1 K−1 at 903 K. This shows that the κ of SGTO1 and SGTO3 samples are minimal when compared to STO. Instead, the SGTO5 sample was observed to possess high κ values when compared to SGTO1 and SGTO3 ranging from 2.32 W m−1 K−1 at 303 K to 1.83 at 903 K. A more distinguishable reduction in the thermal conductivity was observed for the Gd-substituted samples, specifically in the low-temperature region. In the case of crystalline solids, boundaries hinder the thermal transport at a lower temperature. Meanwhile, phonon–phonon Umklapp scattering influences the thermal transport at high temperatures.43 The reduction of κ at low temperatures could be attributed to the boundary scattering, as it is closely related to the microstructures.44,45 The temperature-independent property is precedent in perovskite materials which have been reported to represent the sequential relation between lattice parameters, lowering thermal conductivity and ionic radii, respectively.43,46 Thus, the lattice distortion evident from the structural and morphological analyses led to the lowered thermal conductivity which is attributed to phonon-impurity scattering. Thermal conductivity could be determined by a combination of defect scattering, grain boundary scattering and Umklapp scattering according to Matthiessen's rule. As demonstrated by Han et al., mass difference scattering could also be an influencing factor for the immense reduction in κ of Gd-substituted SrTiO3 ceramic samples, where the mass of Gd3+ is approximately two times heavier than that of Sr2+.46 Therefore, the minimum κ of 1.25 W m−1 K−1 and 1.5 W m−1 K−1 at 303 K and 903 K were achieved for minimal substitution of Gd (Sr0.99Gd0.01TiO3), respectively. The minimum thermal conductivity reported in this work is so far the lowest κ in comparison for a minimal amount of substitution when compared with other reports as shown in Fig. 5(d). Henceforth, the substitution of rare earth element Gd in the Sr-site of SrTiO3 perovskite structure has resulted in low thermal conductivity at 303 K and even at 903 K. It can be realized well that a greater number of phonon-scattering mechanisms contributed to the notable decline in κ including phonon–phonon and interface scattering. Based on Matthiessen's rule, the physical significance of different scale phonon scattering mechanisms has been given below. Microstructural defects including grain boundary and grain boundary interface scattering occurred at room temperature to near room temperature range, which strongly scatters the low-frequency phonons and described as,
 | (2) |
If the temperature increases, the contribution of microstructural defects was less, while the point-defect scattering arises, which scatters the high-frequency phonons and is described as,
 | (3) |
In addition, the impurity scattering (or) point defect scattering is the sum of mass and strain fluctuation scattering and is described as,
| ΓM + ΓS = Γcal | (4) |
 | (5) |
![[M with combining macron]](https://www.rsc.org/images/entities/i_char_004d_0304.gif) = M1x = M2(1 − x) = M1x = M2(1 − x)
| (6) |
 | (7) |
 | (8) |
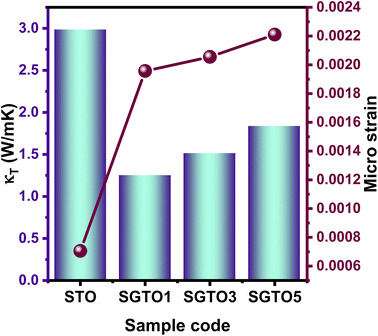
Fig. 6 represents the relation between the microstrain and total thermal conductivity, which proves that increasing Gd concentration significantly improved the microstrain and resulted in reduced thermal conductivity.
Conclusion
In summary, thermoelectric properties for Sr1−xGdxTiO3 (x = 0.01, 0.03 and 0.05) were investigated and revealed the low thermal conductivity of 1.05 W m−1 K−1 at 303 K. Introduction of Gd in the Sr site can significantly change the lattice parameters, which were confirmed by the structural and morphological analyses. From XPS it is evident that the substituted Gd have the valence state of 3+ in the Sr-site of the SrTiO3 matrix. The combined effect of grain boundary-phonon scattering, mass fluctuation scattering, strain fluctuation scattering and point defect scattering predominantly increased the phonon scattering resulting in reduced thermal conductivity for the SGTO1 sample. This investigation on thermal transport properties gives a prominent way to reduce the thermal conductivity through the rare earth element substitution, which would result in a great way to enhance the thermoelectric performance.Conflicts of interest
There is no conflicts to declare.Acknowledgements
The authors thank the management of SRM Institute of Science and Technology for the support through SEED, STARTUP grant, and Nanotechnology Research Center (NRC) for the research facilities.References
- T. Zhang, R. Wan, Y. Guo, A. J. Ahmed, Y. Lei and G. Tian, Ionics, 2022, 28, 2021–2028 CrossRef CAS.
- G. Jeffrey Snyder and Eric S. Toberer, Mater. Renewable Sustainable Energy, 2011, 64, 101–110 Search PubMed.
- S. S. Jana and T. Maiti, ACS Appl. Mater. Interfaces, 2022, 14, 14174–14181 CrossRef CAS PubMed.
- H. Bakhshi, R. Sarraf-Mamoory, A. Yourdkhani, S. Song, Y.-C. Tseng and Y. Mozharivskyj, Ceram. Int., 2022, 48, 5831–5839 CrossRef CAS.
- Q.-Q. Fu, H. Gu, J.-J. Xing, Z. Cao and J. Wang, Acta Mater., 2022, 229, 117785 CrossRef CAS.
- P. P. Khirade, S. D. Birajdar, A. V. Raut and K. M. Jadhav, J. Electroceram., 2016, 37(1), 110–120 CrossRef CAS.
- P. P. Khirade, A. V. Raut, R. C. Alange, W. S. Barde and A. R. Chavan, Phys. B, 2021, 15(613), 412948 CrossRef.
- P. P. Khirade, V. Vinayak, P. B. Kharat and A. R. Chavan, Opt. Mater., 2021, 1(111), 110664 CrossRef.
- T. Chen, H. Wang, W. Su, X. Wang, F. Mehmood, K. Zhang, T. Huo and C. Wang, J. Phys. D: Appl. Phys., 2021, 54, 155501 CrossRef CAS.
- J.-H. Lin, C.-S. Hwang and F.-R. Sie, Mater. Res. Bull., 2020, 122, 110650 CrossRef CAS.
- X.-L. Shi, H. Wu, Q. Liu, W. Zhou, S. Lu, Z. Shao, M. Dargusch and Z.-G. Chen, Nano Energy, 2020, 78, 105195 CrossRef CAS.
- H. Bantawal, U. S. Shenoy and D. K. Bhat, Appl. Surf. Sci., 2020, 513, 145858 CrossRef CAS.
- J.-H. Lin, C.-S. Hwang and F.-R. Sie, Mater. Res. Bull., 2020, 122, 110650 CrossRef CAS.
- S. P. Singh, N. Kanas, T. D. Desissa, M. Johnsson, M.-A. Einarsrud, T. Norby and K. Wiik, J. Eur. Ceram. Soc., 2020, 40, 401–407 CrossRef CAS.
- J. Chen, T. Sun, D. Sim, H. Peng, H. Wang, S. Fan, H. H. Hng, J. Ma, F. Y. C. Boey, S. Li, M. K. Samani, G. C. K. Chen, X. Chen, T. Wu and Q. Yan, Chem. Mater., 2010, 22, 3086–3092 CrossRef CAS.
- S. V. Faleev and F. Léonard, Phys. Rev. B: Condens. Matter Mater. Phys., 2008, 77, 214304 CrossRef.
- M. Wolf, R. Hinterding and A. Feldhoff, Entropy, 2019, 21 Search PubMed.
- H. Muta, K. Kurosaki and S. Yamanaka, J. Alloys Compd., 2004, 368, 22–24 CrossRef CAS.
- H. Muta, K. Kurosaki and S. Yamanaka, J. Alloys Compd., 2005, 392, 306–309 CrossRef CAS.
- F. Azough, A. Gholinia, D. T. Alvarez-Ruiz, E. Duran, D. M. Kepaptsoglou, A. S. Eggeman, Q. M. Ramasse and R. Freer, ACS Appl. Mater. Interfaces, 2019, 11, 32833–32843 CrossRef CAS PubMed.
- M. T. Dylla, J. J. Kuo, I. Witting and G. J. Snyder, Adv. Mater. Interfaces, 2019, 6, 1–7 Search PubMed.
- U. S. Shenoy and D. K. Bhat, J. Alloys Compd., 2020, 832, 154958 CrossRef CAS.
- N. Wang, H. Chen, H. He, W. Norimatsu, M. Kusunoki and K. Koumoto, Sci. Rep., 2013, 3, 3–7 Search PubMed.
- J. Liu, C. L. Wang, Y. Li, W. B. Su, Y. H. Zhu, J. C. Li and L. M. Mei, J. Appl. Phys., 2013, 114, 223714 CrossRef.
- N. Yalini Devi, K. Vijayakumar, P. Rajasekaran, A. S. Alagar Nedunchezhian, D. Sidharth, S. Masaru, M. Arivanandhan and R. Jayavel, Ceram. Int., 2021, 47, 3201–3208 CrossRef CAS.
- A. A. Murashkina, E. Y. Pikalova and D. A. Medvedev, Ionics, 2017, 23, 2351–2357 CrossRef CAS.
- L. Fang, W. Dong, F. Zheng and M. Shen, J. Appl. Phys., 2012, 112, 034114 CrossRef.
- A. V. Kovalevsky, A. A. Yaremchenko, S. Populoh, P. Thiel, D. P. Fagg, A. Weidenkaff and J. R. Frade, Phys. Chem. Chem. Phys., 2014, 16, 26946–26954 RSC.
- Y. X. Zhang, Z. H. Ge and J. Feng, J. Alloys Compd., 2017, 727, 1076–1082 CrossRef CAS.
- J.-Y. Baek, L. T. Duy, S. Y. Lee and H. Seo, J. Mater. Sci. Technol., 2020, 42, 28–37 CrossRef.
- H. Ren, L. Ge, Q. Guo, L. Li, G. Hu and J. Li, RSC Adv., 2018, 8, 20157–20165 RSC.
- L. Gu, H. Wei, Z. Peng and H. Wu, J. Mater. Res., 2017, 32, 748–756 CrossRef CAS.
- R. Tang and L. Yin, J. Mater. Chem. A, 2015, 3, 17417–17425 RSC.
- Y. Fan, Y. Liu, H. Cui, W. Wang, Q. Shang, X. Shi, G. Cui and B. Tang, Nanomaterials, 2020, 10, 1–10 Search PubMed.
- N. Zhang, D. Chen, F. Niu, S. Wang, L. Qin and Y. Huang, Sci. Rep., 2016, 6, 26467 CrossRef CAS PubMed.
- S. Majeed and S. A. Shivashankar, J. Mater. Chem. B, 2014, 2, 5585–5593 RSC.
- J. Chung, J. Park, J. G. Park, B.-H. Choi, S. J. Oh, E. J. Cho, H. D. Kim and Y. S. Kwon, arXiv, 1999, 9910443 [cond-mat.str-el], DOI:10.48550/arXiv.cond-mat/9910443.
- G. Xing, L. Zhao, T. Sun, Y. Su and X. Wang, Springerplus, 2016, 5, 1132 CrossRef PubMed.
- L. Li, Y. Liu, X. Qin, D. Li, J. Zhang, C. Song and L. Wang, J. Alloys Compd., 2014, 588, 562–567 CrossRef CAS.
- T. Teranishi, Y. Ishikawa, H. Hayashi, A. Kishimoto, M. Katayama and Y. Inada, J. Am. Ceram. Soc., 2013, 96, 2852–2856 CrossRef CAS.
- Y. F. Wang, K. H. Lee, H. Ohta and K. Koumoto, Int. Conf. Thermoelectr. ICT, Proc., 2007, 157–160 Search PubMed.
- A. Durán, F. Morales, L. Fuentes and J. M. Siqueiros, J. Phys.: Condens. Matter, 2008, 20, 85219 CrossRef.
- S. R. Popuri, A. J. M. Scott, R. A. Downie, M. A. Hall, E. Suard, R. Decourt, M. Pollet and J. W. G. Bos, RSC Adv., 2014, 4, 33720–33723 RSC.
- S. Il Kim, K. H. Lee, H. A. Mun, H. S. Kim, S. W. Hwang, J. W. Roh, D. J. Yang, W. H. Shin, X. S. Li, Y. H. Lee, G. J. Snyder and S. W. Kim, Science, 2015, 348, 109–114 CrossRef PubMed.
- H. S. Kim, S. D. Kang, Y. Tang, R. Hanus and G. Jeffrey Snyder, Mater. Horiz., 2016, 3, 234–240 RSC.
- H. Muta, K. Kurosaki and S. Yamanaka, J. Alloys Compd., 2003, 350, 292–295 CrossRef CAS.
- V. Vijay, S. Harish, J. Archana and M. Navaneethan, J, 2022, 15(612), 97–110 Search PubMed.
- M. Zhou, L. Chen, W. Zhang and C. Feng, J. Appl. Phys., 2005, 98(1), 013708 CrossRef.
- K. Monikapani, V. Vijay, R. Abinaya, J. Archana, S. Harish and M. Navaneethan, J. Alloys Compd., 2022, 25(923), 165961 CrossRef.
| This journal is © The Royal Society of Chemistry 2023 |

