 Open Access Article
Facile and scalable synthesis of un-doped, doped and co-doped graphene quantum dots: a comparative study on their impact for environmental applications†
Reena Suryawanshi,
Ramsingh Kurrey,
Sushama Sahu and
Kallol K. Ghosh *
*
School of Studies in Chemistry, Pt. Ravishankar Shukla University, Raipur-492010, Chhattisgarh, India. E-mail: kallolkghosh@gmaill.com
First published on 23rd December 2022
Abstract
In recent years, graphene quantum dots (GQDs) received huge attention due to their unique properties and potential applicability in different area. Here, we report simple and facile method for the synthesis of GQDs and their functionalization by doping and co-doping using different heteroatom under the optimized conditions. The doping and co-doping of GQDs using boron and nitrogen have been confirmed by FTIR and TEM. The UV-visible and fluorescence techniques have been used to study the optical properties and stability of functionalized GQDs. Further, the screening for enhancement of quantum yields of all GQDs were performed with fluorescence and UV-visible spectra under the optimized conditions. The average QY was obtained as 16.0%, 83.6%, 18.2% and 29.6% for GQDs, B-GQDs, N-GQDs and B,N-GQDs, respectively. The sensor was used to determine paraoxon in water samples. The LOD was observed to be 1.0 × 10⁻⁴ M with linearity range of 0.001 to 0.1 M. The RSD was calculated for the developed B,N-GQDs based sensor and observed to be 2.99% with the regression coefficient as 0.997. All the doped, co-doped and un-doped GQDs possess remarkable properties as a fluorescent probe.
1. Introduction
Graphene quantum dots (GQDs) are new emerging members of the luminescent carbon family.1–4 These are crystalline semiconductors prepared using graphene and single or 4–5 layered zero-dimensional graphene sheets with a diameter <20 nm of the exciton Bohr radius. GQDs exhibit remarkable physicochemical, electronic and optical (photoluminescence (PL) and electrochemiluminescence (ECL)) properties with good photostability. GQDs also exhibit multicolour emission, biocompatibility and chemical inertness derived from the quantum confinement and edge effects.5,6 Thus, GQDs are desirable candidates for tremendous applications, including biosensing, bioimaging, optical sensing, photocatalysis, optoelectronics, etc.7,8 Naik et al.4 studied the effect of pH on GQDs by developing a molecular scale rapid synthetic method for GQDs using citric acid as a carbon precursor. Li et al.2 developed sulphur and nitrogen co-doped GQD-assisted chemiluminescence for the sensitive detection of tryptophan and mercury in human plasma and water samples. Zhao et al.60 synthesized oxygen-enriched N-GQDs via a green synthetic method and reported their advantages in pH-sensitive photoluminescence and mercury detection.Recently, graphene and graphene-based materials have gained wide attention owing to various applications.9 Doping and co-doping of GQDs with various heteroatoms, such as boron, sulphur, nitrogen, fluorine, chlorine, bromine, iodine, potassium and selenium, and co-dopants have proven to be effective approaches to modulate their intrinsic electronic, luminescence and reactive properties.10,11 Yu et al.12 studied functionalized GQDs via electrochemical exfoliation of carbon fibers for the detection of sulfide ions. Herein, GQDs show fascinating properties and size-dependent optical properties as an environmentally friendly system.
Huang et al.13 developed a highly fluorescent nanoprobe carbon dot-desferrioxamine B (CD-DB) via the conjugate connection of CDs and desferrioxamine B for the detection of iron ions. The determination of the fluctuation of ascorbic acid induced by hypoxia in cells and in vivo system. The nanoprobe exhibited excellent sensitivity and selectivity for the detection of Fe3+ and AA. Since a decade, many researchers have reported the synthesis and functionalization methods of graphene based materials to enhance their application in various fields. The highly fluorescent behaviour of graphene-based materials has gained increasing attention.14–16 GQDs were synthesized by the use of citric acid as a precursor and then characterized by fluorescence and UV-visible spectroscopic techniques. Furthermore, graphene was used as sensor for sensitive and selective detection and degradation of several environmental pollutants.17,18
In addition, these approaches are proving graphene as an eminent sensing material for the detection of environmental and biological toxicants.19 Doping of GQDs with B results in the generation of holes and doping with N produces electrons. In addition, co-doping of GQDs with heteroatoms is the combination of both the hole and electron production.20,21 The doping of GQDs using B generates holes, and thus it would effectively tune the electronic nature and result in distinctive characteristics. Nitrogen atom effectively alters the properties of GQDs and enhances its application in the field of detection and degradation. According to several experimental results, nitrogen is shown to be a good candidate for chemical doping on the surface of GQDs, as their five valence electrons could easily interact with graphene atoms and form strong valence bonds.15–17 Tam et al.22 studied the one-step hydrothermal approach for the synthesis of B-GQDs using glucose and boric acid as the precursor. In this work, B-GQDs showed exceptional electrocatalytic properties than the other metal- and nonmetal-doped GQDs. Wang et al.23 used 4-vinylphenylboronic acid (VPBA) and boric acid under high-temperature treatment (200 °C) for the formation of B-GQDs. The C–H bond in the benzene ring and O–B bond in boric acid were ruptured to produce B-doped carbon-based free radicals and further formed bigger carbon-based fragments.24–26
Other than these, a simple, efficient, and scalable synthesis of B,N-GQDs with high quantum yield and bright fluorescence is extremely desirable. The smaller sized particle shows different characteristics than the bulk state.27 The reduction in the size of any object tends to oppose its properties because of the high surface area to charge ratio; thus, GQDs have also been utilized for bioimaging and biosensing applications.28 These also possess good biocompatibility, better water solubility, and low cytotoxicity; accordingly, GQDs based biosensors have been developed by doping and co-doping in order to enhance their PL properties.29
GQDs have been synthesized by two approaches, i.e., the “top-down” and the “bottom-up”. In the last few years, many researchers have synthesized GQDs using these two approaches and have been used for a wide range of applications.30 However, most of the approaches are unsatisfactory due to the need for cost-effective equipment, rigorous solution preparation conditions, and complicated processing. Fan et al.31 reported the synthesis, structure, and photoluminescence properties of GQDs for bioimaging applications. Bak et al.32 developed energy related applications of GQDs, such as lithium ion batteries, solar cells, and capacitors. In comparison to the electrochemical approach, the hydrothermal method may be a better alternative due to its ease of handling and low cost of equipment. Choi et al.33 used hydrothermal treatment of glucose in the presence of boric acid to create B-GQDs. The result exhibits high B contents in GQDs with uniform size in the nm scale. Wang and co-workers34 reported the synthesis of N-GQDs with intense fluorescence through hydrothermal treatment of benzimidazoles.35,36 The result shows that N-GQDs possess a homogeneous size at 3.8 nm scale with good crystallinity, high photostability, better water dispersibility, and a high quantum yield of about 25%.
The un-doped GQDs has relatively lower quantum yield (QY), limited sensitivity, and selectivity. To overcome this drawback, GQDs have been co-doped with different heteroatoms to enhance their fluorescence properties.37 Such co-doping of GQDs with B and N results in a P–N junction type of semiconductor with highly stable photoluminescence and lesser toxicity than the un-doped GQDs.38 Here, B is an electron deficient metalloid and N is an electron rich nonmetal. Doping of GQDs with N atom results in forming bonds with 4 neighbouring C atoms and the remaining 5th electron is weakly bonded to the parent atom in N-GQDs. B contains 3 electrons in its valence shell, so electron vacancies are observed, which is called as hole.39 A P–N junction is formed by close contact of this fabricated n-type semiconductor for N-GQDs and p-type for B-GQDs. The arrangement of P–N junction for B,N-GQDs possess concentration gradient across P and N sides. Here, holes diffuse from B-GQDs to N-GQDs and electrons diffuse from N-GQDs to B-GQDs.40 This diffusion of electrons from N-GQDs has been eliminated by recombination with B-GQDs and the same happens for the diffusion of holes on the N-GQDs. Thus, a positive charge is developed in N-GQDs and a negative charge in B-GQDs.41 This allows their use in biosensing, bioimaging, photocatalysis, super capacitors, photovoltaic and energy storage devices, etc. The co-doping of GQDs provides them with a better platform to be used as a sensing material as compared to other nanomaterials.42
In the present investigation, the un-doped, doped, and co-doped GQDs have been successfully synthesized using B and N as heteroatoms. These graphene-based materials have been characterized by UV-visible, fluorescence, FTIR, and TEM techniques. The advantages of the doped and co-doped B,N-GQDs included a tuned band gap, improved quantum yields (QYs), ionic mobility, and electrical and optical features that are also useful in biosensing applications.43
2. Experimental section
2.1. Reagents and chemicals
All the chemicals and reagents used for the experiment were of analytical grade and used without further purification. Glucose (purity ≥ 99.5%), citric acid (purity ≥ 99.5%), boric acid (purity ≥ 99.5%), borax (purity ≥ 99.5%), urea (purity ≥ 99.5%), ammonia (purity ≥ 99.5%), sodium hydroxide (purity ≥ 99.5%), hydrochloric acid (purity ≥ 99.5%), and dialysis membrane (2000 dalton cut off) were purchased from Sigma Aldrich, Pvt. Ltd. Bangalore, India. Whatman filters no. 42 were purchased from Sigma Aldrich, Pvt. Ltd. Bangalore, India. Double distilled water was used throughout the experiment for the preparation of all the sample solutions.2.2. Synthesis of graphene based quantum dots
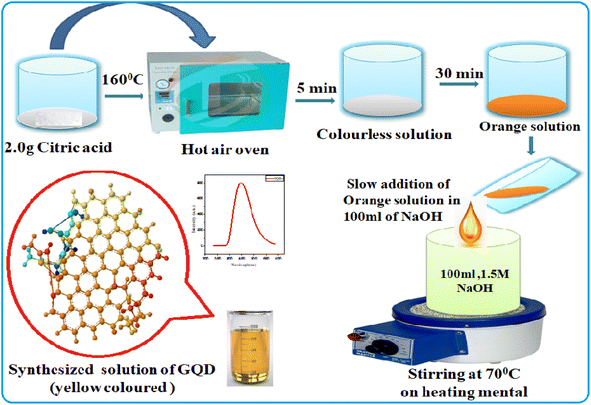
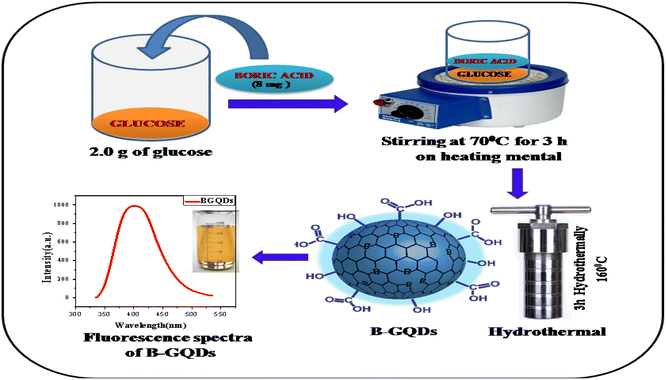
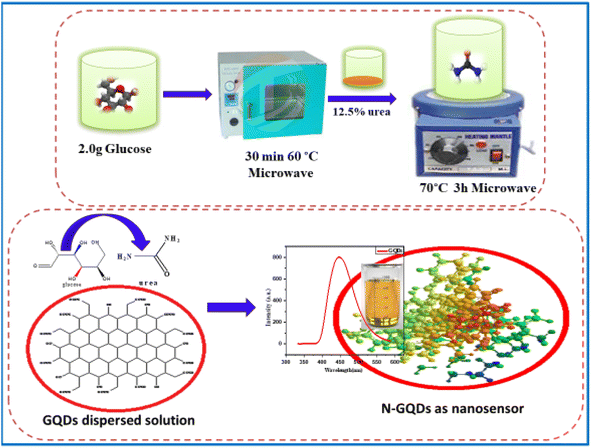
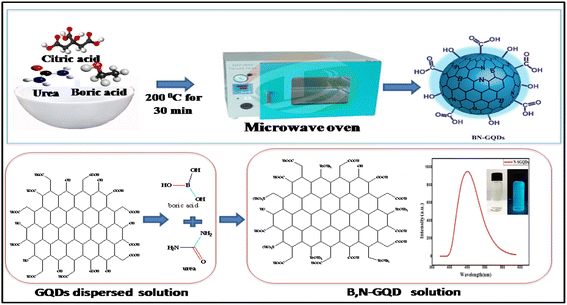
2.3. Instrumentation
The absorption spectra of different nanosensors, such as GQDs, B-GQDs, N-GQDs and B,N-GQDs, were recorded using UV-visible spectroscopy (Cary 60, Agilent Technologies) in the range of 200–800 nm by employing 1.0 cm quartz cell at room temperature. The fluorescence spectroscopic studies of all the samples were carried out using the Cary eclipsed fluorescence spectrophotometer (Agilent Technology) in the range of 200 to 500 nm. Fourier transform infra red (FTIR) spectra of GQDs, B-GQDs, N-GQDs, and B,N-GQDs systems were studied using a Nicolette is10 (Thermo Fisher Scientific instrument calibrated with 32 scans at 4 cm−1 resolution). The FTIR spectrum of all the samples was investigated in the 400 cm−1 to 4000 cm−1 range. Transmission electron microscopy (JEOL, TEM-2100F) was used to find the size and morphology of GQDs, B-GQDs, N-GQDs, and B,N-GQDs. Phase identification of GQDs was performed by X-ray diffraction (XRD) analysis. The GQDs was captured by scanning electron microscope (SEM) (JEOL JSM-6701F FE-SEM) for size determination.2.4. Studies of quantum yield
All the fluorescent materials show quantum yield due to their better electron releasing characteristics and electronegativity. For studying the quantum yield (QYs) of these materials, a 0.01 M stock solution of quinine sulphate was used as reference material.53 UV-visible technique was used to fix the absorbance of the quinine sulphate at 0.1, 0.25, 0.50, 0.75, and 1.0 a.u. and then characterized by fluorescence spectroscopy. For example, the calculated QY of B,N-GQDs at 1 a.u. is determined in fluorescence spectra at the excitation of 300, 310, 320, 330, and 340 nm. Here, the fluorescence intensity of B,N-GQDs increases with absorbance at 0.2, 0.5, and 0.75 a.u. and red shifting of spectra has been observed.54,55 The observed values have then been used for the calculation of quantum yields. The quantum yield (Ø) is a measure of the efficiency of photon emission as defined by the quantity of photons emitted divided by the number of photons absorbed and it could be calculated using eqn (1).
 | (1) |
3. Results and discussion
3.1. Optical studies
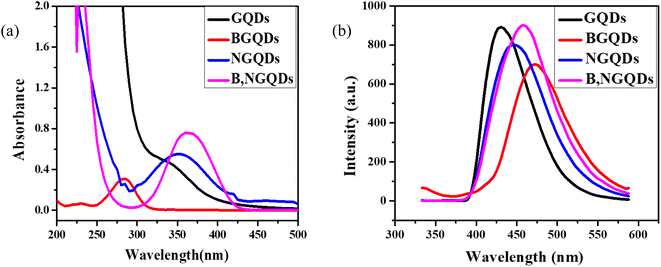
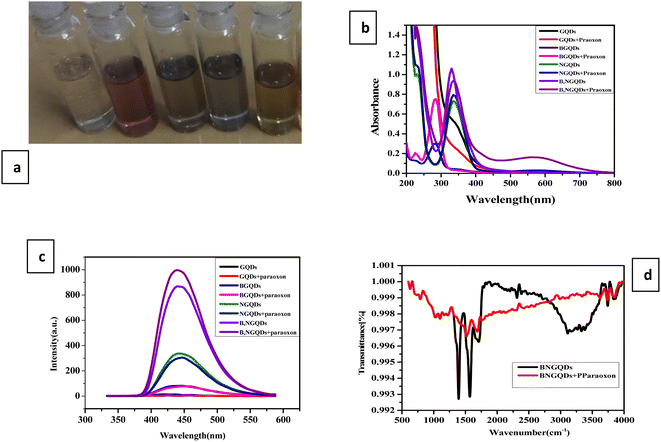
The optical properties of un-doped, doped, and co-doped GQDs are intriguing due to its tunable energy band gap. Theoretically, all the QD show similar absorption spectra with a prominent peak.57 Here, optimization of the un-doped, doped, and co-doped GQDs has been carried out by studying the effect of temperature, concentration, time, and pH. The optical properties of the synthesized un-doped, doped, and co-doped GQDs (GQDs, B-GQDs, N-GQDs, and B,N-GQDs) have been studied using UV-visible spectroscopy in the range of 200–500 nm. Among different GQDs, a prominent spectrum has not been shown by GQDs. Further, an intense spectrum is observed for co-doped B,N-GQDs, as compared to that of B-GQDs and N-GQDs (Fig. 1(a)). The absorption band of B,N-GQDs appears at around 365 nm owing to the π–π* transition from the aromatic sp2 domain of GQDs into the visible range of n–π* transition.58 The absorption band of B-GQDs and N-GQDs appeared at 295 and 350 nm, respectively.The fluorescence study has also been performed to determine the stability and quenching phenomenon of different heteroatoms with GQDs. Herein, the colour of the dispersed GQDs is observed to be pale yellow under visible light in contrast to the greenish-blue fluorescence. In comparison to GQDs, N-GQDs and B,N-GQDs show a broad blue PL under irradiation by 365 nm. Fig. 1(b) shows the fluorescence spectra of GQDs, B-GQDs, N-GQDs, and B,N-GQDs at the excitation wavelength of 330, 310, 350, and 365 nm, respectively, by taking the slit width as 5 nm.59 The spectrum shows a gradual red shift with an increase in the excitation for N-GQDs and B,N-GQDs, whereas a blue shift in the spectrum is observed with a decrease in the excitation wavelengths for GQDs and B-GQDs. B-GQDs shows the red shifting of spectra by 25 nm than GQDs and N-GQDs shows red shifting by 20 nm than GQDs. The shifting in the emission spectrum has been observed due to the presence of both the holes and electrons and the smaller particle size.
Further, the fluorescence spectra of GQDs, B-GQDs, N-GQDs, and B,N-GQDs at different excitation wavelengths are shown in Fig. 2(a–d). All the samples were excited at wavelengths of 330, 310, 350, and 365 nm and the fluorescence (FL) emission peaks were observed at 430, 465, 450, and 460 nm, respectively. The study confirms that the intensity of the spectra increases on increasing the excitation range. In the case of B-GQDs, a decrease in the fluorescence intensity is observed with an increase in the excitation due to the electron withdrawing characteristics of B.60,61 While an increase in the fluorescence intensity has been shown with an increase in the excitation for N-GQDs due to the electron donating characteristics of N. Nonetheless, in the case of B,N-GQDs, when excitation increases from 300 to 340 nm, the fluorescence intensity decreases, while further increase in the intensity is observed in the range 350 to 400 nm due to the presence of electrons and holes in the lattice structure of B,N-GQDs. We also describe the excitation-wavelength-independent PL for GQDs, B-GQDs, N-GQDs, and B,N-GQDs that arises due to π* → n recombination. This involves the scattering phenomenon and an electron transition and relaxation from σ* → π* orbital, which are essential for PL emission induced by short-wavelength excitation.62,63 In addition, evidence suggested that the nature of PL spectrum depends on the pH, solvent, and counter ions, even in a similar size. The emission kinetics of both the GQDs and N-GQDs were multiexponentially fitted using time constant.
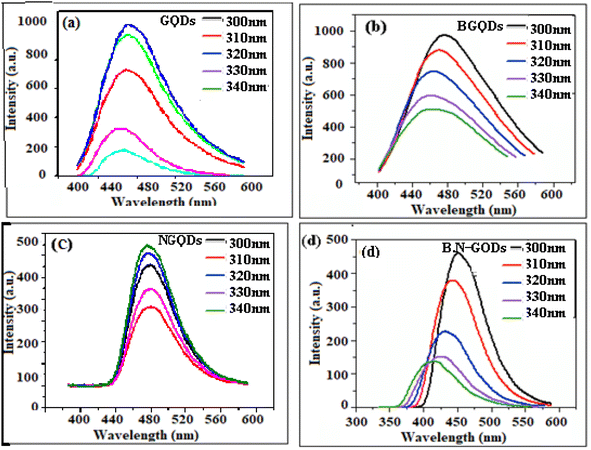 | ||
| Fig. 2 Fluorescence spectra of (a) GQDs, (b) B-GQDs, (c) N-GQDs and (d) B,N-GQDs along with different excitation wavelength. | ||
Further, the average fluorescence decay time of GQDs (τ0 = 513 ns), B-GQDs (τ0 = 83 ns), N-GQDs (τ0 = 71 ns), and B,N-GQDs (τ0 = 911 ns) were calculated using the weighted average process.64 Subsequently, multiexponential dynamics arising from the surface traps of B-GQDs, N-GQDs and B,N-GQDs decrease and the redox energy level shifts to lower energies, compared to un-doped GQDs. The average decay time of co-doped GQDs increases rapidly. As a result of these findings, heteroatoms such as B and N and their mixture have been effectively doped in GQDs.
3.2. Functional group and structural elucidation
In this work, the surface of GQDs were modified with boron and nitrogen and initially characterized by simple and sensitive UV-visible and fluorescence spectroscopic techniques. According to the literature review, the presence of intermediate surface states created upon functionalisations with different capping agents could be responsible for the excitation dependence, whereas excitation independent PL behaviour probably comes from the inter-band transition of doped and co-doped GQD structures.65,66 In order to understand the intrinsic functional groups generated during the synthesis of the samples, the analysis of functional groups has been carried out for un-doped, doped, and co-doped GQDs. Fig. 3(a–h) and Table 1 show the FTIR spectrum and characteristic transmission peaks of synthesized GQDs, B-GQDs, N-GQDs, and B,N-GQDs. The FTIR absorption spectrum of GQDs is depicted in Fig. 3(b). Besides, graphene peaks at 3400.18 and 1563.80 cm−1 are attributed to the C–OH bond. Hence, the confirmation of graphene structure was validated by FTIR study. The characteristic FTIR absorption spectrum of citric acid used as a precursor for the synthesis of GQDs is shown in Fig. 3(a). Here, a characteristic transmission peak was observed at 3290.12 cm−1 (R–C(O)–OH symmetric stretching), 1721.69 cm−1 (C(O)–OH stretching), 1105.85 cm−1 (C–OH stretching vibration), and 778.78 cm−1 (CH2 rocking).67 The result is attributed to the vibration modes of citric acid molecule. The FTIR spectrum of GQDs shows a broad peak due to the –OH stretching at 3408 cm−1 and C![[double bond, length as m-dash]](https://www.rsc.org/images/entities/char_e001.gif) O vibration adsorption of –COOR moieties at 1739 cm−1. Typical peaks at 2972 and 1602 cm−1 indicate the C–H asymmetric and symmetric vibrations and aromatic C
O vibration adsorption of –COOR moieties at 1739 cm−1. Typical peaks at 2972 and 1602 cm−1 indicate the C–H asymmetric and symmetric vibrations and aromatic C![[double bond, length as m-dash]](https://www.rsc.org/images/entities/char_e001.gif) C skeletal ring vibrations from the graphitic domain, respectively (Fig. 3(b)). The frontier orbital hybridization and functional groups of GQDs reduce the energy gap between HOMO and LUMO, while the charge transfer was observed from GQDs moiety to functional groups.68 It is also observed that all the functional groups are responsible for tailoring the electronic and optical properties of GQDs compared to other groups, which indeed has a much weaker influence on electronic structure.69
C skeletal ring vibrations from the graphitic domain, respectively (Fig. 3(b)). The frontier orbital hybridization and functional groups of GQDs reduce the energy gap between HOMO and LUMO, while the charge transfer was observed from GQDs moiety to functional groups.68 It is also observed that all the functional groups are responsible for tailoring the electronic and optical properties of GQDs compared to other groups, which indeed has a much weaker influence on electronic structure.69
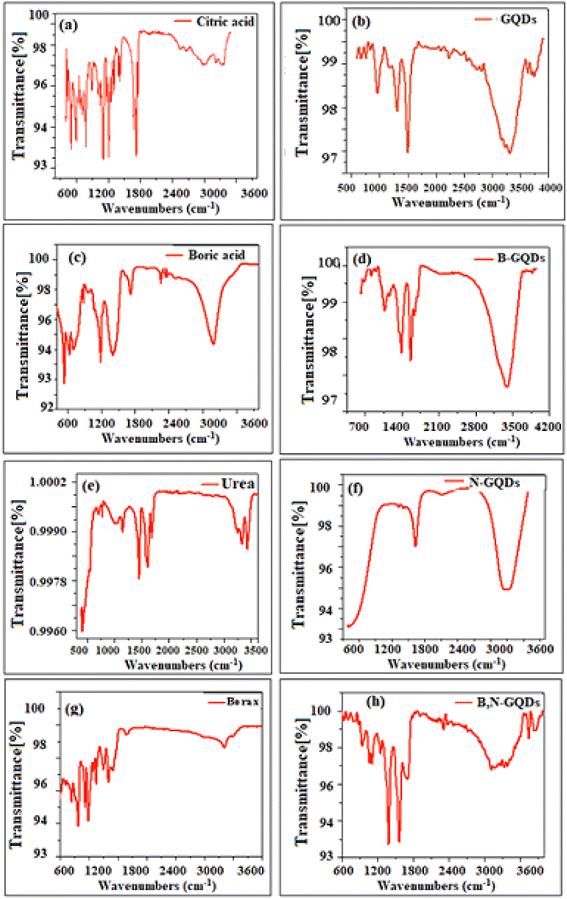 | ||
| Fig. 3 FTIR spectra of (a) citric acid, (b) GQDs, (c) boric acid, (d) B-GQDs, (e) urea, (f) N-GQDs, (g) borax and (h) B,N-GQDs in the transmittance mode. | ||
| S. no. | Sample | Precursor | Group | Peak assignment | FTIR transmittance band regions (cm−1) | |
|---|---|---|---|---|---|---|
| Present method | Reference method | |||||
| 1 | GQDs | Citric acid | Alkyl chain | C–H asymmetrical stretching | 2972 | 3000–2800 |
| Carbonyl | C![[double bond, length as m-dash]](https://www.rsc.org/images/entities/char_e001.gif) O stretching vibration O stretching vibration |
1739 | 1739–1700 | |||
| Hydroxyl | O–H stretching vibration | 3808 | 3808–3500 | |||
| Aromatic hydrocarbon chain | C![[double bond, length as m-dash]](https://www.rsc.org/images/entities/char_e001.gif) C stretching vibration C stretching vibration |
1602 | 1602–1600 | |||
| 2 | B-GQDs | Boric acid | Tetrahedral boron | B–O–H bending vibration | 600 | 600–800 |
| Trigonal boron | B–O stretching vibration | 1800 | 1800–900 | |||
| Hydroxyl | O–H stretching vibration | 3416 | 3416–3500 | |||
| Carbonyl | C![[double bond, length as m-dash]](https://www.rsc.org/images/entities/char_e001.gif) O stretching vibration O stretching vibration |
1714 | 1714–1700 | |||
| 3 | N-GQDs | Urea | Hydroxyl | O–H stretching vibration | 3500 | 3500–3000 |
| Amine | N–H stretching vibration | 3200 | 3200–3000 | |||
| Carboxylic | COOH bending vibration | 1709 | 1709–1650 | |||
| Amide | CONH bending vibration | 1667 | 1667–1600 | |||
| Carbonyl | C![[double bond, length as m-dash]](https://www.rsc.org/images/entities/char_e001.gif) O stretching vibrations O stretching vibrations |
1720 | 1720–1700 | |||
| 4 | B,N-GQDs | Borax | Hydroxyl | O–H stretching vibrations | 3400 | 3400–3000 |
| Alcoholic-hydroxyl | H–O–H bending vibrations | 1650 | 1650–1600 | |||
| Trigonal boron | B–O stretching vibration | 1130 | 1130–1050 | |||
| Amine | N–H stretching vibration | 3241 | 3241–3000 | |||
| Alkyl chain | C–H asymmetrical stretching | 2946 | 2946–2900 | |||
| Carbonyl | C![[double bond, length as m-dash]](https://www.rsc.org/images/entities/char_e001.gif) O stretching vibration O stretching vibration |
1652 | 1652–1600 | |||
The FTIR spectra of boric acid used as a precursor for the formation of B-GQDs are shown in Fig. 3(c and d). It is especially difficult to assign the peaks for tetrahedral boron, as peaks from B–O–H bending, trigonal B–O stretching, and tetrahedral B–O stretching occur in the 600–1800 cm−1 spectral region.70 Here, any significant shift in the spectrum is not observed due to the asymmetrical crystal structure of –OH, resulting in a horizontal axis of rotation.71,72 However, in aqueous solution, the movement of H around the O atom of boric acid is essentially unconstrained. The FTIR transmittance peaks arising at 3416 and 1714 cm−1 correspond to –OH and C![[double bond, length as m-dash]](https://www.rsc.org/images/entities/char_e001.gif) O stretching vibration modes, respectively, which indicated the presence of hydroxyl and carboxyl groups on the surface of B-GQDs and endowed them with good water-solubility.73
O stretching vibration modes, respectively, which indicated the presence of hydroxyl and carboxyl groups on the surface of B-GQDs and endowed them with good water-solubility.73
The FTIR spectra of glucose and urea used for the formation of N-GQDs are shown in Fig. 3(e and f). Here, the peaks appeared at 3000–3500 cm−1, which are assigned to stretching vibration of –OH and –NH groups of glucose and urea. The vibrational stretching band of C![[double bond, length as m-dash]](https://www.rsc.org/images/entities/char_e001.gif) O in the –COOH and –CONH groups on the surface of N-GQDs are ascribed to the bands at 1709 and 1667 cm−1, respectively.69 The results indicated that the surface of N-GQDs is successfully modified with urea. Kumler and Fohlen24,74,75 interpreted the dipole moment of urea as indicating a resonance hybrid with 25–30% contribution of highly polar structures. They also pointed out that the structure of urea does not differ significantly from that of simple amides. A variety of research work assigned the C
O in the –COOH and –CONH groups on the surface of N-GQDs are ascribed to the bands at 1709 and 1667 cm−1, respectively.69 The results indicated that the surface of N-GQDs is successfully modified with urea. Kumler and Fohlen24,74,75 interpreted the dipole moment of urea as indicating a resonance hybrid with 25–30% contribution of highly polar structures. They also pointed out that the structure of urea does not differ significantly from that of simple amides. A variety of research work assigned the C![[double bond, length as m-dash]](https://www.rsc.org/images/entities/char_e001.gif) O stretching vibrations only, which does not exist in the spectrum of O-alkyl derivatives of iso-urea type (I). This only indicated the –NH2 group and did not address C
O stretching vibrations only, which does not exist in the spectrum of O-alkyl derivatives of iso-urea type (I). This only indicated the –NH2 group and did not address C![[double bond, length as m-dash]](https://www.rsc.org/images/entities/char_e001.gif) O.76
O.76
Subsequently, the FTIR spectra of borax decahydrate were collected for the qualitative determination of chemical structure. Fig. 3(g and h) shows the transmittance spectra of the pure crystals in the range of 400–4000 cm−1. The bands appeared at 3400 and 1650 cm−1, representing the O–H stretching and H–O–H bending vibrations, respectively.77 The peak observed at 1432 cm−1 is attributed to the asymmetric stretching of the B–O bond in BO3. Similarly, the strong transmission bands at 1130 and 1080 cm−1 are characteristics of asymmetric stretching of the B–O bond in BO4.78 Two bands appearing at 950 and 830 cm−1 denoted the presence of symmetric stretching of B–O in BO3 and BO4, respectively, which plays a key role for the binding on the surface of GQDs and resulting in the formation of B,N-GQDs as fluorescence sensor. The appearance of all these bands confirms the formation of borax decahydrate crystals. FTIR spectroscopy was systematically applied to explore the information about the number of bonds present in the synthesized B,N-GQDs as nanomaterials.79 The peak that appeared at 3409, 3241, 2946, and 1652 cm−1 are recognized as the stretching vibrations of O–H, N–H, C–H, and C![[double bond, length as m-dash]](https://www.rsc.org/images/entities/char_e001.gif) O, respectively. The strong and sharp bands that appeared at 1548 cm−1 are assigned to the bending vibration of N–H corresponding to an interlayer spacing of about 0.385 nm, which is larger than graphene (0.335 nm) due to the presence of multifunctional groups on the surface of B,N-GQDs. The transmittance bands of B–O stretching, B–N bending, and B–O–H bending vibrations appeared at 1380, 1215, and 1151 cm−1, respectively. In comparison to pure N-GQDs, the appearance of new transmittance peaks of B–O at 1450 cm−1 and C–B at 1190 cm−1 indicated that B has been successfully doped into the GQDs network, validating the doping of B,N on graphene structure.80 In addition, the FTIR spectral result showed the shifting of all these bands, which clearly indicated the intermolecular interaction taking place within B,N-GQDs.
O, respectively. The strong and sharp bands that appeared at 1548 cm−1 are assigned to the bending vibration of N–H corresponding to an interlayer spacing of about 0.385 nm, which is larger than graphene (0.335 nm) due to the presence of multifunctional groups on the surface of B,N-GQDs. The transmittance bands of B–O stretching, B–N bending, and B–O–H bending vibrations appeared at 1380, 1215, and 1151 cm−1, respectively. In comparison to pure N-GQDs, the appearance of new transmittance peaks of B–O at 1450 cm−1 and C–B at 1190 cm−1 indicated that B has been successfully doped into the GQDs network, validating the doping of B,N on graphene structure.80 In addition, the FTIR spectral result showed the shifting of all these bands, which clearly indicated the intermolecular interaction taking place within B,N-GQDs.
3.3. Size determination of graphene based materials
TEM imaging was performed to find the crystal structure and size of all the samples (Fig. 4). Here, GQDs are spherical in shape with an average size of 2.83 ± 0.24 nm. The lattice spacing of B-GQDs is 0.16 ± 1.21 nm, corresponding to the lattice plane of graphite, suggesting that the synthesized B-GQDs have excellent crystallinity.81 The TEM image shows the N-GQDs exhibiting an average particle size of ∼4.0 nm with a distribution of 1.6 to 2.5 nm range (Fig. 4(c)). The effect of growth time on the morphology and the size of N-GQDs was investigated from 3 to 5 min. Consequently, the size of N-GQDs has been observed at 5–10 nm. Further increase in the growth time did not affect the size and thickness of the N-GQDs. TEM image of the resultant co-doped B,N-GQDs exhibits an average particle size of ∼4.0 nm with a distribution of 2.8 to 6.2 nm range.82 The result reveals that the size of un-doped, doped, and co-doped GQDs was below the range of 2–10 nm, which is quite similar to the previously reported size of GQDs.83 TEM imaging was performed to determine the crystal structure and size of all the samples (Fig. 4), where GQDs are spherical with an average size of 2.83 ± 0.24 nm. The TEM images have now been replaced with images of clearly visible GQD particles. This was confirmed by SEM images of the synthesized materials, which revealed no significant differences in particle size (Fig. 4(e and f)).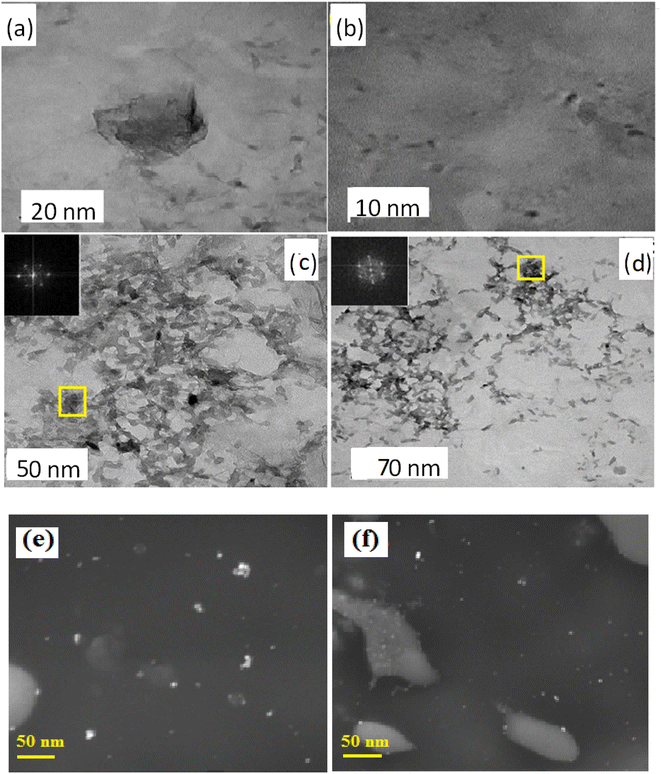 | ||
| Fig. 4 TEM images of (a) GQDs, (b) B-GQDs, (c) N-GQDs and (d) B,N-GQDs. SEM images of (e) GQDS and (f) B,N-GQDs. | ||
3.4. X-ray diffraction and zeta potential
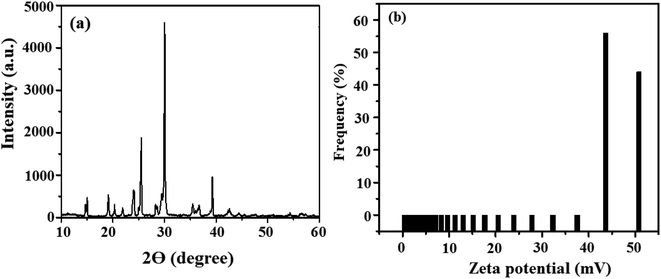
The lattice spacing or the degree of (graphene-like) crystallinity was determined by performing additional experiments using X-ray diffraction (XRD) technique, TEM, and SEM. The X-ray diffraction (XRD) analysis revealed the crystallinity and phase of the material. GQDs exhibited peaks at 20.09° and 30.11° for graphene oxide and 25.47° for graphite. This result is supported by the FTIR spectrum and characteristic transmission peaks of graphene-like nanostructures. The FTIR peaks of graphene at 3400.18 and 1563.80 cm−1 are attributed to the C–OH bond. The zeta potential value of GQD is −17.5 mV, as shown in Fig. S4.† This indicates that more electron-rich functional groups (–NH2, –OH, –CONH2) are present on the surface of the carbon dots. The results are shown in Fig. 5(a and b).3.5. Screening for the enhancement of quantum yield of un-doped, doped, and co-doped GQDs
Quantum yield (QY) is one of the most important photophysical parameters when characterising luminescent materials.84 It could be defined as the efficiency to convert absorbed light into emitted light, which can be in the form of fluorescence. The fluorophores with high QYs emit strong fluorescence even at lower concentrations. This reduces the amount of fluorophores required for an application and this subsequently cuts the cost of materials and promotes better clearance from the body for in vivo applications.85 A wide range of QY values for GQDs has been observed in which the commonly reported ones are below 10%, especially those for bare or un-doped GQDs as these are obtained without surface passivation. Some studies reported that the QY values of GQDs can be altered via surface functionalization or doping approaches. Most of these studies showed enhancement in fluorescence intensity and QY values of 0.In this present investigation, the screening for the enhancement of QYs of un-doped, doped, and co-doped GQDs were performed using fluorescence and UV-visible techniques under the optimized conditions.86 QY of GQDs has been improved by varying the content of hydroxyl groups, whereas the doping of B into GQDs produces high QY (83.6%) as compared to un-doped GQDs. Similarly, QY of B-GQDs has been improved by varying the content of tetrahedral B, whereas the doping by N into GQDs produces the QY as 18.2%. Co-doping of GQDs by N and B as heteroatom increases the QY to 29.6%.
The QY of all these systems has been studied at different times, temperature, and pH to optimize the proposed sensing system. The study showed that there is no sequential alteration in the calculated values of QY (Fig. 6). This confirms that the proposed method is independent of the environmental conditions studied here. The work reported high QY for B-GQDs, but it is comparatively less stable, and thus it has been diminished. A good QY was observed for co-doped GQDs with better stability.87 Fig. S1–S4† shows a comparison of the PL emission spectra of GQDs, B-GQDs, N-GQDs, and B,N-GQDs as a function of excitation wavelengths 330, 310, 350, and 365 nm, respectively. The first peak is most probably triggered by singlet to singlet relaxation, whereas the second is produced by the triplet to singlet transition (as the triplet excitons tend to have longer diffusion lengths). Mueller et al.88 explored the shifting in the peak position with different solvents and also the effect of solvent and size on singlet/triplet splitting. Similar kinds of PL peaks have been observed in the GQDs prepared by the thermal plasma jet. Here, excitation dependence is caused by intermediate surface states, which were formed after functionalization with different heteroatoms. The excitation independent PL is most likely driven by the internal GQDs structure and inter-band transition according to the findings of this work.93 Fig. S5† shows the PL, QY and absorbance, which are directly correlated to the concentration term using Beer–Lambert law, A = €cl, where, A = absorbance, € = molar extinction coefficient, c = concentration, and l = path length. The equation also reveals an absorbance region corresponding to the average maximum QY (65%) for Gaussian behavior.89 The results of this experiment are summarized in Tables 2 and 3.
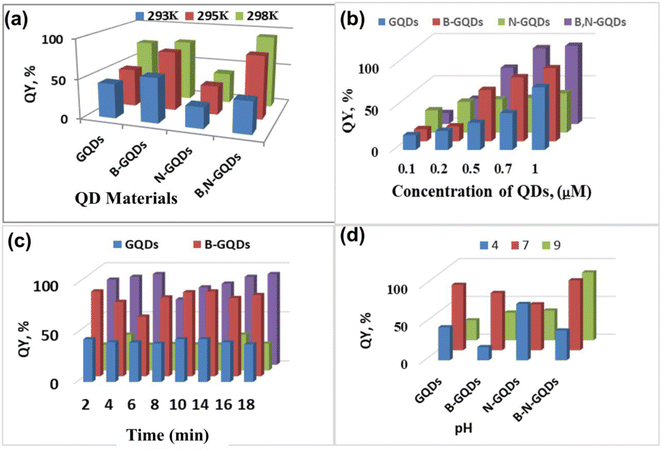 | ||
| Fig. 6 3D graphical representation for the screening of QYs along with different physical parameters: (a) temperature, (b) concentration, (c) time and (d) influence of pH. | ||
| Concentration, mM | |||||
|---|---|---|---|---|---|
| QD material | Maximum PL excitation, nm | Emission, nm | QYs, % | Temperature, °C | Stability time (month) |
| GQDs | 330 | 435 | 16.0 | 160 | 3–4 |
| B-GQDs | 270 | 460 | 83.6 | 160 | 2–3 |
| N-GQDs | 360 | 450 | 18.2 | 70 | 6–7 |
| B,N-GQDs | 360 | 445 | 29.6 | 200 | 9–12 |
| QD materials | Values of QY in percentage (%) | |||||||||||||
|---|---|---|---|---|---|---|---|---|---|---|---|---|---|---|
| Time, min | Temperature, °C | pH | ||||||||||||
| 2 | 4 | 6 | 8 | 10 | 14 | 16 | 18 | 305 | 298 | 295 | 4 | 7 | 9 | |
| GQDs | 43.5 | 40.33 | 40.31 | 39.1 | 43.53 | 43.5 | 44.33 | 44.36 | 43.5 | 48.33 | 74.31 | 42.1 | 17.33 | 74.31 |
| B-GQDs | 75.7 | 60.65 | 80.2 | 85.24 | 86.4 | 86.4 | 79.7 | 82.65 | 56.4 | 75.7 | 78.65 | 56.4 | 60.65 | 75.7 |
| N-GQDs | 26.12 | 26.21 | 26.27 | 27.01 | 36.51 | 26.35 | 27.27 | 36.51 | 26.35 | 36.51 | 39.27 | 26.01 | 36.24 | 38.21 |
| B,N-GQDs | 86.06 | 86.12 | 88.42 | 89.49 | 90.82 | 92.01 | 92.23 | 92.42 | 39.66 | 79.61 | 92.42 | 76.61 | 89.61 | 92.42 |
| Concentration, mM | |||||
|---|---|---|---|---|---|
| QD materials | 0.1 | 0.2 | 0.5 | 0.7 | 1.0 |
| GQDs | 17.33 | 22.53 | 32.1 | 43.5 | 74.3 |
| B-GQDs | 14.24 | 17.5 | 60.65 | 75.7 | 86.4 |
| N-GQDs | 26.35 | 36.51 | 39.27 | 41.01 | 46.54 |
| B,N-GQDs | 12.82 | 29.66 | 66.49 | 89.61 | 92.42 |
Considering the discussion in the section above, only those photons cause a reaction, which are absorbed by the reactant starting the photo primary step. Solvent polarity, viscosity, rate of solvent relaxation, probe, conformational changes, rigidity of the local environment, and internal charge transfer could also affect the fluorescence emission spectra and QYs.90 Therefore, H2SO4 was chosen on the basis of polarity, viscosity, and all the above chemical properties.
3.6. Comparison of the QYs with previously reported methods
Table 4 provides the physicochemical parameters for screening QY using UV-visible and fluorescence techniques and has been compared with the previously reported literature in terms of the precursor and synthesis methodologies. The synthesis of GQDs using a hydrothermal method provided high QYs, showing the advantages of doped and co-doped GQDs as a sensing system. The obtained results of QYs for four different kinds of graphene based materials in an aqueous solution have been compared with several reported nanomaterials, like graphene, graphene oxide, nano tubes, nanowires, quantum wire and so on.91,92 In the present investigation, many folds enhancement in the fluorescence signal intensity and better QY has been observed as compared to those of other hydrothermal, precursor pyrolysis acid catalysed, solvothermal, and ultrasonic treatment procedures. The proposed method shows high adsorption efficiency, requires minimal time, shows good stability, is easy to handle and eco-friendly, and do not require any sophisticated instrument for the screening of QYs.93–95 The average QYs for the proposed systems were obtained as 16.2%, 83.6%, 18.2%, and 29.6% for GQDs, B-GQDs, N-GQDs, and B,N-GQDs, respectively. The present study indicated that quinine sulphate plays a key role for the determination of QY than the other reference materials. The highly stable GQDs possess better stability and PL properties than the low yielded QDs.96,97| Quantum dots | Quantum yield, % | Excitation, nm | Emission, a.u. | Temperature, °C | Solvent | Stability, month | Reference material | Ref. |
|---|---|---|---|---|---|---|---|---|
| GQDs | 8.98 | 310 | 335 | 170 | H2SO4 | 2–3 | Quinine sulphate | 37 |
| GQDs | 18.0 | 310 | 335 | 200 | ND | 1–2 | Fluorescein | 38 |
| B-GQDs | 11.4 | 290 | 460 | ND | ND | 6–7 | Quinine sulphate | 39 |
| B-GQDs | 23.0 | 290 | 460 | ND | DMF | ND | Quinine sulphate | 40 |
| N-GQDs | 49.8 | 350 | 450 | 160 | H2SO4 | 3–4 | Quinine sulphate | 41 |
| N-GQDs | 49.8 | 350 | 450 | 160 | H2SO4 | 3–4 | Quinine sulphate | 42 |
| B,N-GQDs | 29.1 | 365 | 440 | 200 | NH3 | 3–4 | Quinine sulphate | 43 |
| B,N-GQDs | 52.8 | 365 | 440 | 160 | ND | 3–4 | Quinine sulphate | 44 |
| GQDs | 16.0 | 330 | 435 | 160 | H2SO4 | 3–4 | Quinine sulphate | Present method |
| N-GQDs | 83.6 | 270 | 460 | 70 | H2SO4 | 2–3 | ||
| B-GQDs | 18.2 | 360 | 450 | 160 | H2SO4 | 6–7 | ||
| B,N-GQDs | 29.6 | 360 | 445 | 200 | H2SO4 | 9–12 |
3.7. Determination of Stern–Volmer and binding constant using fluorescence spectrophotometry
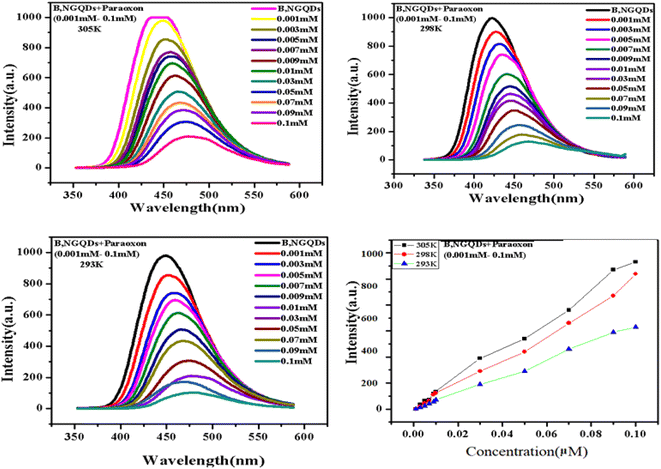
The fluorescence quenching constant (Ksv) and binding constant (Ka) is determined to study the interaction phenomenon of B,N-GQDs with paraoxon. The study showed a decrease in the fluorescence intensity with an increase in temperature for B,N-GQDs–paraoxon system (Fig. 7). Additionally, quenching in the spectrum has been observed with increasing the concentration of paraoxon from 0.001 to 0.1 M.98,99 The fluorescence quenching could be calculated using the following Stern–Volmer equation.
 | (2) |
| S. no. | Temperature (K) | Stern–Volmer quenching constant (Ksv) (104 L mol−1) | pH | Binding constant (Ka) (104 L mol−1) |
|---|---|---|---|---|
| 1 | 305 K | 110 | 7 | 6.5 × 10⁻² |
| 2 | 298 K | 190 | 7 | 1.6 × 10⁻⁴ |
| 3 | 293 K | 60 | 7 | 1.4 × 10⁻⁴ |
Further, the binding constant (Ka) has been analyzed by the double logarithmic equation, and observed values are summarized in Table 5.
 | (3) |
The result demonstrated that the values of binding constant Ka increase dramatically with temperature, showing that B,N-GQDs has better binding ability towards paraoxon.
3.8. Evaluation of binding constant and thermodynamic parameters by UV-vis spectroscopy
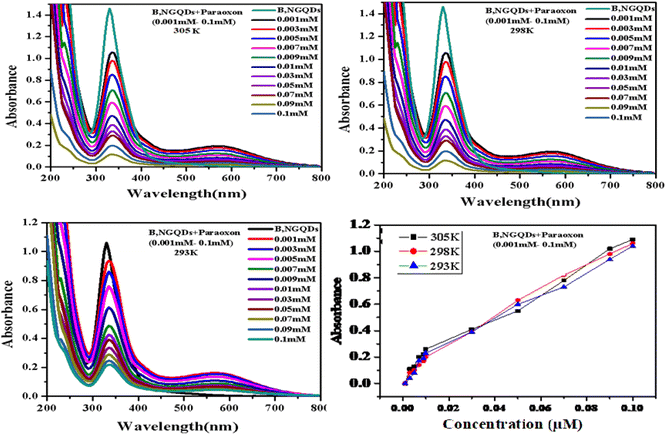
UV-visible absorption spectrum of B,N-GQDs–paraoxon system is also demonstrated at different temperatures (Fig. 8). Here, co-doped B,N-GQDs shows a peak at 340 nm, which is related to the π–π* transition of the C![[double bond, length as m-dash]](https://www.rsc.org/images/entities/char_e001.gif) C bonds. The binding constant of B,N-GQDs–paraoxon system has been determined using the following equation.102,103
C bonds. The binding constant of B,N-GQDs–paraoxon system has been determined using the following equation.102,103
 | (4) |
 | (5) |
| ΔG = ΔH − TΔS | (6) |
| S. no. | Temperature (K) | Binding constant (Ka) | ΔH [kJ mol−1] | ΔS [J mol−1 K−1] | ΔG [kJ mol−1] | |
|---|---|---|---|---|---|---|
| 1 | 305 | 14.86 | −64 | 19.8 | −556 | |
| 2 | 298 | 14.46 | −61 | 17.5 | −479 | |
| 3 | 293 | 14.09 | −57 | 13.14 | −337 |
4. Application in real samples
Detection of paraoxon in real samples (water) is crucial because of its high toxicity and wide existence in the environment.102 The fluorescence emission of B,N-GQDs shows more quenching behaviour with paraoxon than the other un-doped, doped, and co-doped GQDs. It has been observed that the paraoxon shows noticeable quenching with B,N-GQDs, which proved that B,N-GQDs is a rapid and better probe for detection of different environmental toxicants.104 Fig. 9 confirms that B,N-GQDs shows an additional peak at 585 nm after complexation with paraoxon. This has also been confirmed by taking the fluorescence spectra of un-doped, doped, and co-doped GQDs, where only B,N-GQDs gives efficient quenching in the spectrum with paraoxon. Thus, the proposed system is observed to be highly stable and selective for the detection of different analytes. Further, analytical evaluation has also been carried out for B,N-GQDs–paraoxon system by studying the linearity range, limit of detection (LOD), incubation time, and correlation coefficient in a specific pH range.105,106 FTIR spectra of B,N-GQDs with and without the addition of paraoxon were systematically applied to explore the information about the number of bonds present in the synthesized nanomaterials. The detailed information about the number of functional groups present in B,N-GQDs are discussed in the above paragraph. The sensor is used to determine paraoxon in water samples. The LOD is observed to be 1.0 × 10⁻⁴ M in the range of 0.001 to 0.1 M. The relative standard deviation is calculated for the developed B,N-GQDs based sensor and is observed to be 2.99% with the regression coefficient of 0.997.1075. Conclusions
Herein, we evaluate a route for the detection of environmental pollutants such as organophosphate pesticides. The incorporation of heteroatoms such as B and N into graphene materials is a current research concern. Boron and nitrogen co-doped graphene quantum dots (B,N-GQDs) are synthesized by a one-step bottom-up hydrothermal method. The detection of paraoxon is based on the colour change of B,N-GQDs. B,N-GQDs exhibits single/bilayer graphene structure, high crystallinity, large surface to volume ratio, biocompatibility, etc., by which it has drawn increasing attention in the detection and removal of pesticides. In this work, doped GQDs show fascinating properties and size dependent optical properties as an environmentally friendly system. The doped GQDs are imperative for researchers to design novel hybrid materials for better applications. Despite extensive investigations, studies based on the detection of environmental pollutants using heteroatom doped GQDs. The detection of organophosphate pesticide paraoxon and a comparative study of the screening of QYs of un-doped, doped and co-doped GQDs to find out the better stability of the material is also performed. The optical properties of the synthesized graphene-based materials were studied using UV-visible and fluorescence spectroscopy. FTIR technique has been used to confirm the surface functionalities of GQDs by B and N atoms. The effect of pH has been studied with GQDs, B-GQDs N-GQDs, and B,N-GQDs and pH significantly affects B-GQDs, N-GQDs and B,N-GQDs than the un-doped GQDs. Through the characterizations, it is confirmed that the doping and co-doping elements successfully attached onto the surface of GQDs and showed good QYs. The doped and co-doped GQDs also indicated a highly graphene-stacked structure with good crystallinity. All un-doped, doped, and co-doped GQDs possess remarkable properties, which make them suitable as fluorescent probes. A white luminescence was seen in the as-synthesized doped and co-doped GQDs in a gel-like form, with two emission zones of 400–550 nm and 550–700 nm, which is believed to have interesting applications in light-harvesting devices and optoelectronics.Conflicts of interest
There are no conflicts of interest declared by the authors.Acknowledgements
Authors are thankful to the Director, National Center for Natural Resources (NCNR), Raipur [Grant No: IR/SO/LU/0008/2011(SERB)] and Director, IIT MUMBAI for providing FTIR and TEM facilities, respectively. The authors wish to thank the Head, School of Studies in Chemistry, Pt. Ravishankar Shukla University, Raipur, and C. G. for providing lab facilities.References
- L. Feng, Z. Qin, Y. Huang, K. Peng, F. Wang, Y. Yan and Y. Chen, Boron-sulfur- and phosphorus-doped graphene for environmental applications, Sci. Total Environ., 2020, 698(1), 134239 CrossRef CAS PubMed.
- R. Li, Q. Li, A. R. B. Méndez, T. Hayashi, B. Wang, A. Berkheimer, Q. Hao, A. L. Elías, R. C. Silva, H. R. Gutiérrez, Y. A. Kim, H. Mura Matsu, J. Zhu, M. Endo, H. Terrones, J. C. Charlie, M. Pan and M. Terrones, Nitrogen Nitrogen-doped graphene: beyond single substitution and enhanced molecular sensing, Sci. Rep., 2012, 2, 586 CrossRef PubMed.
- P. Yang, J. Su, R. Guo, F. Yao and C. Yuan, B,N-Co-doped graphene quantum dots as fluoresecence sensor for detection of Hg2+ and F-, Anal. Methods, 2019, 11, 1879–1883 RSC.
- J. P. Naik, P. Sutradhar and M. Saha, Molecular scale rapid synthesis of graphen quantum dots (GQDs), J. Nanostruct. Chem., 2017, 7, 85–89 CrossRef CAS.
- L. Zhang, Y. Liang, Li. Ru-ping and J. D. Qui, Boron-Doped graphene quantum dots for selective glucose sensing based on the abnormal aggregation induced photoluminescence enhancement, Anal. Chem., 2014, 86, 4423–4430 CrossRef CAS PubMed.
- J. Luo, J. Wang, S. Liu, W. Wu, T. Jia, Z. Yang, S. Mu and Y. Huang, Graphene quantum dots encapsulated tremella-like NiCo2O4 for advance asymmetric super capacitors, Carbon, 2019, 146, 1–8 CrossRef CAS.
- A. Suryawanshi, M. Biswal, D. Mhamane, R. Gokhale, S. Patil, D. Guin and S. Ogale, Large scale synthesis of graphene quantum dots (GQDs) from waste biomass and their use as an efficient and selective photoluminescence, Nanoscale, 2014, 6, 11664 RSC.
- S. Dey, A. Govindaraj, K. Biswas and C. N. R. Rao, Luminescence properties of boron and nitrogen doped graphene quantum dots prepared from arc-discharge-generated doped graphene samples, Chem. Phys. Lett., 2014, 59, 203–208 CrossRef.
- N. Pourreza and K. Ghanemi, Determination of mercury in water and fish samples by cold vapor atomic absorption spectrometry after solid phase extraction on agar modified with 2-mercaptobenzimidazole, J. Hazard. Mater., 2009, 161, 982–987 CrossRef CAS PubMed.
- M. L. Mueller, Y. Xin, D. Bogdan and L. Li, Slow hot-carrier relaxation in colloidal graphene quantum dots, Nano Lett., 2011, 11, 56–60 CrossRef CAS PubMed.
- M. Wang, S. Guo, Y. Li, L. Cai, J. Zou, G. Xu, W. Zhou, F. Zheng and G. Guo, Direct white-light-emitting metal−organic framework with tunable yellow-to-white photoluminescence by variation of excitation light, J. Am. Chem. Soc., 2009, 131, 13572 CrossRef CAS PubMed.
- J. Yu, W. Ji, M. Arabi, L. Fu, B. Li and L. Chen, ACS Appl. Nano Mater., 2021, 4(7), 6852–6860 CrossRef.
- Y. Huang, N. He, Q. Kang, D. Shen, X. Wang, Y. Wang and L. Chen, Analyst, 2019, 144, 6609–6616 RSC.
- Z. Y. Hong, S. L. Liu and D. W. Pang, Analyst, 2020, 145, 3131–3135 RSC.
- X. W. Wang, S. Yu, J. Wang, J. Yu, M. Arabi, L. Fu, B. Li, J. Li and L. Chen, Talanta, 2020, 211, 120727 CrossRef CAS PubMed.
- N. Yu, H. Peng, H. Xiong, X. Wu, X. Wang, Y. Li and L. Chen, Microchim. Acta, 2015, 182, 2139–2146 CrossRef CAS.
- W. Xue, J. Zhong, H. Wu, J. Zhang and Y. Chi, Analyst, 2021, 146, 7545–7553 RSC.
- Z. Liu, F. Li, Y. Luo, M. Li, G. Hu, X. Pu, T. Tang, J. Wen, X. Li and W. Li, Molecules, 2021, 26(13), 3922 CrossRef CAS PubMed.
- P. Lin, J. W. Chen, L. W. Chang, J. P. Wu, L. Redding, H. Chang and Y. C. Kuo, Computational and ultrastructural toxicology of a nanoparticle, quantum dot in mice 705, in mice, Environ. Sci. Technol., 2008, 42, 6264–6270 CrossRef CAS PubMed.
- D. I. Son, K. Won, B. W. Dong, H. P. Seo, W. S. Yi, Y. Angadi, L. Chang-Lyoul and W. K. Choi, graphene quantum dots for white-light-emitting diods, Nat. Nanotechnol., 2012, 7, 465–471 CrossRef CAS PubMed.
- T. A. Tabish, M. Z. I. Pranjol, I. Karadag, D. Horsell and S. Zhang, Influence of fluorescent graphene quantum dots on trypsin activity, Int. J. Nanomed., 2018, 13, 1525–1538 CrossRef CAS PubMed.
- T. V. Tam, S. G. Kang, K. F. Babu, O. Eun-Suok, S. G. Lee, W. M. Mook and G. Choi, Synthesis of B-doped graphene quantum dots as a metal-free electrocatalyst for the oxygen reduction reaction, J. Mater. Chem. A, 2017, 5, 10537–10543 RSC.
- S. Wang, L. Zhang, Z. Xia, A. Roy, D. W. Chang, J. B. Baek and L. Dai, graphene as efficient metal-free electro catalyst for the oxygen reduction reaction, Angew. Chem., Int. Ed., 2012, 51, 4209–4212 CrossRef CAS PubMed.
- W. D. Kumler and G. M. Fohlen, the dipole moment and structure of urea and thiourea, J. Am. Chem. Soc., 1992, 64, 1944–1948 CrossRef.
- N. T. N. Anh, A. D. Chowdhury and R. A. Doong, Highly sensitive and selective detection of mercury ions using N, S-codoped graphene quantum dots and its paper strip based sensing application in wastewater, Sens. Actuators, B, 2017, 252, 1169–1178 CrossRef.
- D. Marczewska, M. B. Adam, W. Marczewski, S. Malgorzata and B. Tarasiuk, Adsorption of selected herbicides from aqueous solutions on activated carbon, Chemosphere, 2019, 214, 349–360 CrossRef PubMed.
- R. Maria-Hormigos, B. Jurado-Sanchez and A. Escarna, Graphene quantum dot based micromotors: a size matter, Chem. Commun., 2019, 55, 6795 RSC.
- T. Schiros, D. Nordlund, L. Pálová, D. Prezzi, L. Zhao, K. S. Kim, U. Wurstbauer, C. Gutiérrez, D. Delongchamp, C. Jaye, D. Fischer, H. Ogasawara, L. G. M. Petteron, D. R. Reichman, P. Kim, M. S. Hybertsen and A. N. Pasupathy, Connecting dopant bond type with electronic structure in n-doped graphene, Nano Lett., 2012, 12, 4025 CrossRef CAS PubMed.
- J. Peng, W. Gao, B. K. Gupta, Z. Liu, R. Romero-Aburto, L. Ge, L. Song, L. B. Alemany, X. Zhan, G. Gao, S. A. Vithayathil, B. A. Kaipparettu, A. A. Marti, T. Hayashi, J. J. Zhu and P. M. Ajayan, Graphene quantum dots derived from carbon fibres, Nano Lett., 2012, 12, 844–849 CrossRef CAS PubMed.
- N. Kaur and B. Kaur, Spectral studies on anthracene based dual sensor for Hg2 + and Al3 + ions with two distinct output modes of detection, Spectrochim. Acta, Part A, 2017, 181, 60–64 CrossRef CAS PubMed.
- Z. Fan, Y. Li, X. Li, W. Li, W. Zhou, Z. Wang, P. G. Ding, X. Xie, Z. Kang and M. Jiang, Large-scale fabrication of heavy doped carbon quantum dots with tunable-photoluminescence and sensitive fluorescence detection, J. Mater. Chem. A, 2014, 2, 8660 RSC.
- J. Bak, M. J. Park, S. J. Kim, D. H. Wang, S. Cho, P. Bae, J. H. Park and B. H. Hong, Balancing light absorptive and carrier conductivity of graphene quantum dots for high-efficiency bulk heterojunction solar cells, ACS Nano, 2013, 7, 7207 CrossRef PubMed.
- H. H. Choi, H. Yang, D. J. Kang and B. J. Kim, Enhancing mechanical properties of highly efficient polymer solar cells using size-tuned polymer nanoparticles, ACS Appl. Mater. Interfaces, 2015, 7, 2668–2676 CrossRef PubMed.
- T. Wang, A. Wang, R. Wang, Z. Liu, Y. Sun, G. Shan, Y. Chen and Y. Liu, Sci. Rep., 2019, 1–9 Search PubMed.
- C. Boonta, S. Talodthaisong, C. Sattayaporn, A. Chaicham, S. Chaicham, L. Sahasithiwat and K. S. Kulchat, The synthesis of nitrogen and sulfur co-doped graphene quantum dots for fluorescence detection of cobalt(II) ions in water, Mater. Chem. Front., 2020, 4, 507–516 RSC.
- P. R. Kharange, S. Umapathy and G. Singh, Multiple electrical phase transitions in Al substituted barium hexaferrite, J. Appl. Phycol., 2017, 122, 145107 CrossRef.
- M. Ghaedi, F. Ahmadi, A. Shokrollahi and P. Hazard, Simultaneous preconcentration and determination of copper, nickel, cobalt and lead ions content by flame atomic absorption spectrometry, J. Mater., 2007, 142, 272–278 CAS.
- M. L. Yola and N. Atar, A novel detection approach for serotonin by graphene quantum dots/two-dimensional (2D) hexagonal boron nitride nanosheets with molecularly imprinted polymer, Appl. Surf. Sci., 2018, 458, 648–655 CrossRef CAS.
- J. H. Zhang, T. Sun, A. Niu, Y. M. Tang, S. Deng and W. Luo, Perturbation effect of reduced graphene oxide quantum dots (rGOQDs) on aryl hydrocarbon receptor (AhR) pathway in zebrafish, Biomaterials, 2017, 133, 49–59 CrossRef CAS PubMed.
- R. Leu, Q. Li, A. R. B. Méndez, T. Hayashi, B. Wang, A. Berkdemir, Q. Hao, A. L. Elías, R. C. Silva, H. R. Gutiérrez, Y. A. Kim, H. Muramatsu, J. Zhu, M. Endo, H. Terrones, J. C. Charlier, M. Pan and M. Terrones, Nitrogen-doped graphene: beyond single substitution and enhanced molecular sensing, Sci. Rep., 2012, 2, 586 CrossRef PubMed.
- Y. Yang, Z. C. Liu, B. Gu, B. Gao, Z. Wang, Q. Guo and G. Wang, Preparation of concentration dependent nitrogen sulfur co-doped graphene quantum dots by UV irradiation and reversible optical switch of hydroxypropyl methyl cellulose, J. Photochem. Photobiol., A, 2021, 15, 112977 CrossRef.
- J. He, Z. Li, R. Zhao, Y. Lu, L. Shi, J. Liu, X. Dong and F. Xi, Aqueous synthesis of amphiphilic graphene quantum dots and their application as surfactants for preparing of fluorescent polymer microspheres, Colloids Surf., A, 2019, 563, 77–83 CrossRef CAS.
- B. K. Jena and C. R. Raj, Gold nanoelectrode ensembles for the simultaneous electrochemical detection of ultratrace arsenic, mercury, and copper, Anal. Chem., 2008, 80, 4836–4844 CrossRef CAS PubMed.
- W. Guo, S. Hu, X. Wang, J. Zhang, L. Jin, Z. Zhu and H. Zhang, Application of ion molecule reaction to eliminate WO interference on mercury determination in soil and sediment samples by ICP-MS, J. Anal. At. Spectrom., 2011, 26, 1198–1203 RSC.
- M. L. Yola and N. Atar, Highly sensitive fluorescence sensor for mercury(II) based on boron- and nitrogen-co-doped graphene quantum dots, J. Electrochem. Soc., 2019, 166, 1879–1883 Search PubMed.
- Y. J. Dai, Y. F. Jia, N. Chen, W. P. Bian, Q. K. Li and B. M. Yang, Zebrafish as a model system to study toxicology, Environ. Toxicol. Chem., 2014, 33, 11–17 CrossRef CAS PubMed.
- D. Iannazzo, A. Pistone, M. Salamo, S. Galvagno, R. Rmeo, S. V. Giofre, C. Branca and G. Visalli, Graphene quantum dots for cancer targeted drug delivery, Int. J. Pharm., 2017, 518, 185–192 CrossRef CAS PubMed.
- Y. Qing, Y. Jiang, H. Lin, L. Wang, A. Liu, Y. Cao, R. Sheng, Y. Guo, C. Fan, S. Zhang, D. Jia and Z. Boosting, Construction of hierarchical porous carbon nanosheets from template-assisted assembly of coal-based graphene quantum dots for high performance super capacitor electrodes, Mater. Today, 2013, 6, 1–3 Search PubMed.
- Y. Dong, C. Chen, X. Zheng, L. Gao, Z. Cui, H. Yang, C. Guo, Y. Chi and C. Li, One-step and high yield simultaneous preparation of single- and multi-layer graphene quantum dots from CX-72 carbon black, J. Mater. Chem., 2012, 22, 8764–8766 RSC.
- S. P. Nichols, A. Koh, W. L. Storm, J. H. Shin and M. H. Schoenfisch, Biocompatible materials for continuous glucose monitoring devices, Chem. Rev., 2013, 113, 2528–2549 CrossRef CAS PubMed.
- S. Gu, C. T. Hsieh, Y. Y. Tsai, Y. Ashraf, S. Gandomi, K. D. Yeom and R. S. Kihm, Juang, Sulfur and nitrogen co-doped graphene quantum dots as a fluorescent quenching probe for highly sensitive detection toward mercury ions, ACS Appl. Nano Mater., 2019, 2, 790–798 CrossRef CAS.
- K. N. Kudin, B. Ozbas, H. C. Schniepp, R. K. Prud'homme, I. A. Aksay and R. Car, Raman spectra of graphite oxide and functionalized graphene sheets, Nano Lett., 2008, 8, 36–41 CrossRef CAS PubMed.
- L. A. Ponomarenko, F. Schedin, M. I. Katsnelson, R. Yang, E. W. Hill, K. S. Novoselov and A. K. Geim, Chaotic dirac billiard in graphene quantum dots, Science, 2008, 320, 356–358 CrossRef CAS PubMed.
- R. V. Goreham, K. L. Schroeder, A. Holmes, S. J. Bradley and T. Nann, Demonstration of the lack of cytotoxicity of unmodified and folic acid modified graphene oxide quantum dots, and their application to fluorescence lifetime imaging of HaCaT cells, Microchim. Acta, 2018, 185, 128 CrossRef PubMed.
- L. Tang, R. Ji, X. Cao, J. Lin, H. Jiang, X. Li, K. Teng, S. C. M. Luk, S. Zeng, J. Hao and S. P. Lau, Optical and electrochemical applications of silicon–carbon dots/silicon dioxide nanocomposites, ACS Nano, 2012, 6, 5102–5110 CrossRef CAS PubMed.
- P. Kumar, C. Dhand, N. Dwivedi, S. Singh, R. Khan, S. Verma, A. Singh, M. K. G. S. Kumar, R. Kumar and A. K. Srivastava, Graphene quantum dots: A contemporary perspective on scope, opportunities, and sustainability, Renew. Sustain. Energy Rev., 2022, 143, 111993 CrossRef.
- H. Tetsuka, R. Asahi, A. Nagoya, K. Okamoto, I. Tajima, R. Ohta and A. Okamoto, Modulated photoluminescence of graphene quantum dot in the vicinity of individual silver nano-octahedron, Adv. Mater., 2012, 24, 5333–5338 CrossRef CAS PubMed.
- J. Peng, W. Gao, B. K. Gupta, Z. Liu, R. R. Aburto, L. Ge, L. Song, L. B. Alemany, X. Zhan, G. Gao, S. A. Vithayathil, B. A. Kaipparettu, A. A. Marti, T. Hayashi, J. J. Zhu and P. M. Ajayan, Graphene Quantum Dots Derived from Carbon Fibers, Nano Lett., 2012, 12, 844–849 CrossRef CAS PubMed.
- A. Safavi and E. Farjami, Construction of a carbon nanocomposite electrode based on amino acids functionalized gold nanoparticles for trace electrochemical detection of mercury, Anal. Chim. Acta, 2011, 688, 43–48 CrossRef CAS PubMed.
- Y. Zhao, Q. Wu and D. Wang, A micro RNAs–mRNAs network involved in the control of graphene oxide toxicity in Caenorhabditis, RSC Adv., 2015, 5, 92394–92405 RSC.
- Q. Feng, W. Xiao, Y. Liu, Y. Zheng, Y. Lin, J. Li, Q. Ye and Z. Huang, Novel synthesis of slightly fluorinated graphene quantum dots with luminescent and paramagnetic properties through thermal cutting of fluorinated graphene materials, Materials, 2018, 11, 91 CrossRef PubMed.
- K. Erickson, R. Erni, Z. Lee, N. Alem, W. Gannett and A. Zettl, Determination of the local chemical structure of graphene oxide and reduced graphene oxide, Adv. Mater., 2010, 22, 4467 CrossRef CAS PubMed.
- N. Suzuki, Y. Wang, P. Elwati, Z. B. Qu, K. Kim, S. Jiang, E. Baumeister, J. Lee, B. Yeom, J. H. Bahng, J. Lee, A. Violi and N. A. Kotov, Chiral graphene quantum dots, ACS Nano, 2016, 10, 1744–1755 CrossRef CAS PubMed.
- G. P. C. Mello, E. F. C. Simoes, D. M. A. Crista, J. M. M. Leitao, L. P. D. Silva and J. C. G. Esteves da Silva, Glucose sensing by fluorescent nanomaterials, Crit. Rev. Anal. Chem., 2019, 49, 542–552 CrossRef CAS PubMed.
- X. T. Zheng, A. Ananthanarayanan and K. Q. Luo, Highly efficient nuclear delivery of anti-cancer drugs using a bio-functionalized reduced graphene oxide, Small, 2016, 16, 1192–1201 Search PubMed.
- C. Gutierrez, L. Brown, C. J. Kim, J. Park, A. Pasupathy and N. Klein, Tailoring electrical conductivity of two dimensional nanomaterial's using plasma for edge electronics: A mini review, Nat. Phys., 2016, 1–7 Search PubMed.
- M. Dutta, S. Sarkar, T. Ghosh and D. Bask, ZnO/Graphene quantum dot solid-state solar cell, J. Phys. Chem. C, 2012, 116, 20127–20131 CrossRef CAS.
- X. T. Zheng, A. Ananthanarayanan, K. Q. Luo and P. Chen, Glowing graphene quantum dots and carbon dots: properties, syntheses, and biological applications, Small, 2015, 11, 1620–1636 CrossRef CAS PubMed.
- B. Mandal, S. Sarkar and P. Sarkar, Theoretical studies on understanding the feasibility of porphyrin-sensitized graphene quantum dot solar cell, J. Phys. Chem. C, 2015, 119, 3400–3407 CrossRef CAS.
- L. Tang, R. Ji, X. Cao, J. Lin, H. Jiang, X. Li, K. S. Teng, C. M. Luk, S. Zeng, J. Hao and S. P. Lau, Deep ultraviolet photoluminescence of water-soluble self-passivated graphene quantum dots, ACS Nano, 2012, 6, 5102–5110 CrossRef CAS PubMed.
- E. Campbell, M. T. Hasan, R. Gonzalez-Rodriguez, R. Giridhar, V. Anton and C. E. Naumov, Graphene quantum dot formulation for cancer imaging and redox-based drug delivery, Nanomedicine, 2021, 37, 102408 CrossRef CAS PubMed.
- R. V. Goreham, K. L. Schroeder, A. Holmes, S. J. Bradley and T. Nann, Demonstration of the lack of cytotoxicity of unmodified and folic acid modified graphene oxide quantum dots, and their application to fluorescence lifetime imaging of HaCaT cells, Microchim. Acta, 2018, 185, 128 CrossRef PubMed.
- R. Purbia and S. Paria, A simple turn on fluorescent sensor for the selective detection of thiamine using coconut water derived luminescent carbon dots, Biosens. Bioelectron., 2016, 79, 467–475 CrossRef CAS PubMed.
- F. Liu, M. Jang, H. Ha, J. Kim, Y. Cho and T. S. Seo, Facile synthetic method for pristine graphene quantum dots and graphene oxide quantum dots: origin of blue and green luminescence, Adv. Mater., 2013, 25, 3657 CrossRef CAS PubMed.
- Li. Yang, Y. Zhao, Y. Shi, G. Deng, L. Hou and L. Qu, An electrochemical avenue to green-luminescent graphene quantum dots as potential electron-acceptors for photovoltaics, Adv. Mater., 2011, 23, 776–780 CrossRef PubMed.
- M. Fayazi, M. A. Taher, D. Afzali and A. Mostafavi, Fe3O4 and MnO2 assembled on halloysite nanotubes: A highly efficient solid-phase extractant for electrochemical detection of mercury (II) ions, Sens. Actuators, B, 2016, 228, 1–9 CrossRef CAS.
- D. Jiang, Y. Chen, N. Li, W. Li, Z. Wang and J. Zhu, Graphene quantum dot based materials for sensing, bio-imaging and energy storage applications: a review, PLoS One, 2016, 10, 23861–23898 Search PubMed.
- R. Ye, Z. Peng, A. Metzger, J. Lin, J. A. Mann, K. Huang, C. Xiang, X. Fan, E. L. G. Samuel, L. B. Alemany, A. A. Marti and J. M. Tour, Bandgap engineering of coal-derived graphene quantum dots, ACS Appl. Mater. Interfaces, 2015, 7, 7041–7048 CrossRef CAS PubMed.
- Z. Yu, Z. Chen, M. Li and L. Wu, Photoluminescence responses of graphene quantum dots toward organic bases and an acid, J. Mater. Chem., 2012, 22, 3314 RSC.
- X. Wu, F. Tian, W. Wang, J. Chen, M. Wu and J. Zhuo, Fabrication of highly fluorescent graphenequantum dots using l-glutamic acid for in vitro/in vivo imaging and sensing, J. Mater. Chem. C, 2013, 1, 4676 RSC.
- Q. Xu, Q. Zhou, Z. Hua, Q. Xue, C. Zhang, X. Wang, D. Pan and M. Xiao, Single-particle spectroscopic measurements of fluorescent graphene quantum dots, ACS Nano, 2014, 7, 10654–10661 CrossRef PubMed.
- Y. Liu, X. Tang, M. Deng, Y. Cao, Y. Li, H. Zheng and L. Gao, Nitrogen doped graphene quantum dots as a fluorescent probe for mercury (II) ions, Microchim. Acta, 2019, 186, 140 CrossRef PubMed.
- Y. Yan, J. Gong, J. Chen, Z. Zhen, W. Huang, K. P. Liu and P. Chen, Ultra-broadband, high speed, and high-quantum-efficiency photodetectors based on black phosphorus, Adv. Mater., 2019, 22, 1808283 CrossRef PubMed.
- M. K. Nazeeruddin, D. Censo, R. Humphry-Baker and M. Grätzel, Highly Selective and Reversible Optical, Colorimetric, and electrochemical detection of mercury (ii) by amphiphilic ruthenium complexes anchored onto mesoporous oxide films, Adv. Funct. Mater., 2006, 16, 189–194 CrossRef CAS.
- M. V. Prabhagar, M. O. Kumar, C. Takahashi, S. Kundu, T. N. Narayan and D. K. Pattanayak, Boosting photocatalytic activity using reduced graphene oxide (RGO)/semiconductor nanocomposites: issues and future scope, New J. Chem., 2019, 510, 587–593 Search PubMed.
- M. Buzaglo, M. Shtein and O. Regev, Thermally conductive graphene-polymer composites: size, percolation, and synergy effects, Carbon, 2018, 130, 369–376 CrossRef.
- S. Zhu, J. Zhang, S. Tang, C. Qiao, L. Wang and H. Wang, Surface chemistry routes to modulate the photoluminescence of graphene quantum dots, Adv. Funct. Mater., 2012, 22, 4732–4740 CrossRef CAS.
- M. L. Mueller, X. Yan, B. Dragnea and L. Li, Slow hot-carrier relaxation in colloidal graphene quantum dots, Nano Lett., 2011, 11, 56–64 CrossRef CAS PubMed.
- S. Zhu, J. Zhang, C. Qiao, S. Tang, Y. Li, W. Yuan, B. Li, L. Tian, F. Liu, R. Hu, H. Gao, H. Wei, H. Zhang and H. Sun, Deciphering a nanocarbon-based artificial peroxidase: chemical identification of the catalytically active and substrate-binding sites on graphene quantum dots, j. Yang, Angew. Chem., Int. Ed., 2015, 54, 7176 CrossRef PubMed.
- X. Jiang, D. Qui, G. Mo, J. Feng, C. Yu and W. Mo, Novel enzymatic graphene oxide based biosensor for the detection of glutathione in biological body fluids, Materials, 2019, 164, 514–519 CAS.
- G. Rajendar, U. Goswami and P. K. Giri, Solvent dependent synthesis of edge-controlled graphene quantum dots with high photoluminescence quantum yield and their application in confocal imaging of cancer cells, J. Colloid Interface Sci., 2017, 541, 387–398 CrossRef PubMed.
- C. Qu, D. Zhang, R. Yang, J. Hu and L. Qu, Nitrogen and sulfur co-doped graphene quantum dots for the highly sensitive and selective detection of mercury ion in living cells, Spectrochim. Acta, Part A, 2019, 206, 588–596 CrossRef CAS PubMed.
- J. Sun, S. Yang, Z. Wang, H. Shen, T. Xu, L. Sun, H. Li, W. Chen, X. Jiang, G. Ding, X. Xie and M. Jiang, Doping: versatile graphene quantum dots with tunable nitrogen doping, Part. Part. Syst. Charact., 2014, 45, 92620–92628 Search PubMed.
- D. Jiang, Y. Chen, N. W. Li, Z. Wang, J. Zhu, H. Zhang, B. Liu and S. Xu, High-Resolution Analyses of Human Leukocyte Antigens Allele and Haplotype Frequencies Based on 169,995 Volunteers from the China Bone Marrow Donor Registry, PLoS One, 2015, 11(9), e1005171 Search PubMed.
- J. Xue, X. Xu, Y. Zhu and D. Yang, Graphene/polyaniline nanorod arrays: synthesis and excellent electromagnetic absorption properties, J. Mater. Chem. C, 2012, 42, 1–3 Search PubMed.
- K. Ghosh, M. Kumar, T. Maruyama and Y. Ando, Tailoring the field emission property of nitrogen-doped carbon nanotubes by controlling the graphitic/pyridinic substitution, Carbon, 2010, 48(1), 191–200 CrossRef CAS.
- A. Ferrari, J. Meyer, V. Scardaci, C. Casiraghi, M. Lazzeri, F. Mauri, S. Piscanec, D. Jiang, K. Novoselov, S. Roth and A. Geim, Phys. Rev. Lett., 2006, 97, 187401 CrossRef CAS PubMed.
- L. Li, G. Wu, G. Yang, J. Peng, J. Zhao and J. J. Zhu, Nanoscale, 2013, 5, 4015–4039 RSC.
- Y. Dong, H. Pang, H. B. Yang, C. Guo, J. Shao, Y. Chi, C. M. Li and T. Yu, Angew. Chem., Int. Ed., 2013, 52, 7800–7804 CrossRef CAS PubMed.
- S. Kadian, G. Manik, S. M. Ashish and R. P. Chouhan, Nanotechnology, 2019, 30(43), 435704 CrossRef CAS PubMed.
- S. Xue, P. Wang and K. Chen, Spectrochim. Acta, Part A, 2010, 20, 10716–10723 Search PubMed.
- B. T. Hoan, P. V. Huan, H. N. Van, D. H. Nguyen, P. D. Tam, K. T. Nguyen and Y. H. Pham, Luminescence, 2017, 55, 51–57 Search PubMed.
- Y. Dong, J. Shao, C. Chen, H. Li, R. Wang, Y. Chi, X. Lin and G. Chen, Carbon, 2012, 50, 4738–4743 CrossRef CAS.
- X. Yan, X. Cui, B. Li and L. S. Li, Nano Lett., 2010, 10, 1869–1873 CrossRef CAS PubMed.
- J. Zhu, M. Xu, M. Gao, Z. Zhang, Y. Xu and T. Xia, ACS Nano, 2017, 11, 2637–2651 CrossRef CAS PubMed.
- Z. L. Wu, M. X. Gao, T. T. Wang, X. Y. Wan, L. L. Zheng and C. Z. Huang, Nanoscale, 2014, 6, 3868–3874 RSC.
- Y. Shen, M. Rong, X. Qu, B. Zhao, J. Zha, Z. Liu, Y. Bao, Y. He, S. Li, X. Wang, M. Chen, K. Chen, Y. Zheng and L. Niu, Talanta, 2022, 241, 123224 CrossRef CAS PubMed.
Footnote |
| † Electronic supplementary information (ESI) available. See DOI: https://doi.org/10.1039/d2ra05275j. |
| This journal is © The Royal Society of Chemistry 2023 |

