DOI:
10.1039/D2RA06574F
(Paper)
RSC Adv., 2023,
13, 478-498
Insights into the adsorption and corrosion inhibition properties of newly synthesized diazinyl derivatives for mild steel in hydrochloric acid: synthesis, electrochemical, SRB biological resistivity and quantum chemical calculations
Received
18th October 2022
, Accepted 6th December 2022
First published on 22nd December 2022
Abstract
Two azo derivatives, 4-((4-hydroxy-3-((4-oxo-2-thioxothiazolidin-5-ylidene)methyl)phenyl) diazinyl) benzenesulfonic acid (TODB) and 4-((3-((4,4-dimethyl-2,6-dioxocyclohexylidene) methyl)-4-hydroxyphenyl)diazinyl) benzenesulfonic acid (DODB) were synthesized and characterized using Fourier-transform infrared spectroscopy (FTIR), proton nuclear magnetic resonance (1H-NMR) and mass spectral studies. Gravimetric methods, potentiodynamic polarization (PDP), electrochemical impedance spectroscopy (EIS), electrochemical frequency modulation (EFM) techniques and inductive coupled plasma-optical emission spectroscopy were used to verify the above two compounds' ability to operate as mild steel (MS) corrosion inhibitors in 1 M HCl. Tafel data suggest that TODB and DODB have mixed-type characteristics, and EIS findings demonstrate that increasing their concentration not only alters the charge transfer (Rct) of mild steel from 6.88 Ω cm2 to 112.9 Ω cm2 but also changes the capacitance of the adsorbed double layer (Cdl) from 225.36 to 348.36 μF cm−2. At 7.5 × 10⁻⁴ M concentration, the azo derivatives showed the highest corrosion inhibition of 94.9% and 93.6%. The inhibitory molecule adsorption on the metal substrate followed the Langmuir isotherm. The thermodynamic activation functions of the dissolution process were also calculated as a function of inhibitor concentration. UV-vis, scanning electron microscopy (SEM), and energy dispersive X-ray spectroscopy (EDX) techniques were used to confirm the adsorption phenomenon. The quantum chemical parameters, inductively coupled plasma atomic emission spectroscopy (ICPE) measurements, and the anti-bacterial effect of these new derivatives against sulfate-reducing bacteria (SRB) were also investigated. Taken together, the acquired results demonstrate that these compounds can create an appropriate preventing surface and regulate the corrosion rate.
1. Introduction
Mild steel (MS) is a material with small carbon content that is solid and tough but not easily tempered. It is known as low-carbon steel, and it is currently the most well-known type of steel because of its relatively low cost while providing mechanical characteristics that are sufficient for certain implementations.1,2 Mineral acids, especially corrosive hydrochloric acid, are regularly utilized for mechanical purposes, such as corrosive cleaning, corrosive pickling, corrosive descaling, and oil well acidizing. Such acids create highly corrosive surroundings for MS. As a direct consequence, the study of steel protection against corrosion is always a topic of great theoretical and practical importance. Moreover, because MS is susceptible to corrosion like other metallic materials, its surface must be protected from such undesirable process. Corrosion inhibitors have recently been used to eliminate/reduce corrosion of metal parts in home appliances and industrial machines. Aside from the use of traditional inhibitors,3,4 metals can be also protected through chemical or electrochemical surface functionalization, such as SAMs (Self-assembled Monolayers) formed from silanes,5,6 phosphonic acids,7 or electrochemical reduction of aryldiazonium salts on metals.8,9 Organic compounds with π-electron systems, atoms with lone pair electrons (P, S, N, O), and plane-conjugated structures including benzene rings are the most effective organic inhibitors.10–12 The electrical connections between the organic inhibitors and the metal surface are facilitated by certain sets of atoms or bonds, which allows the inhibitors to adhere to the base metal. It has been asserted that the efficiency of these molecules for corrosion protection increases in the following order: O > N > S > P.8,13 In most cases, the efficiencies of these organic inhibitors are determined by the components of the environment in which they act, such as the nature of the metal substrate, the electrochemical potential at the metal/solution interface, the metal surface protected area, the inhibitor's molecular size, manner of adsorption, its concentration, and its structure.14 The choice of any inhibitor, on the other hand, is heavily influenced by its economic allocation, efficiency in inhibiting the substrate material, and environmental side effects.15 In general, organic dyes have especially gained significant attention due to their multipurpose applications in a variety of fields, such as cosmetics, textiles, food, and pharmaceuticals.16 Because of their distinct chemical structures, they are also used in the protection of metals and alloys against corrosion. Azo-dyes have shown significant inhibition efficiencies17,18 and are one of the most commonly used organic compounds as inhibitors. These compounds' inhibition process has been shown to implement an inhibitor adsorption isotherm,17,18 whereas their efficiency is dependent on the structure and chemical properties of the adsorbed inhibitor film formed on the steel surface. Density functional theory (DFT) has become a helpful strategy in deriving the electronic properties, allowing researchers to obtain solid basic parameters for the atoms.19,20 In corrosion studies, this strategy makes it conceivable to precisely anticipate the hindrance productivity of natural erosion inhibitors on the premise of the electronic and atomic properties, as well as the reactivity records. Many studies have been conducted and published previously on the use of conceptual models for predicting and supporting the corrosion inhibitive potentials of molecules, including azo dyes.21–23 In light of this, two azo derivatives, TODB and DODB compounds were evaluated as novel inhibitors of MS corrosion in a corrosive media of HCl (1.0 M) solution. TODB and DODB compounds were thoroughly characterized using FTIR, proton nuclear magnetic resonance (1H-NMR), and mass spectral studies. At a constant temperature, various techniques such as PDP, EIS, and SEM were used to assess the inhibition efficiencies (% IEs) of the examined organic molecules.
2. Experimental
2.1. Synthesis of TODB and DODB compounds
4-((3-Formyl-4-hydroxyphenyl) diazenyl) benzenesulfonic acid (0.013 mol) was prepared and mixed with two cyclic ketones, rhodanine (0.013 mol) and dimedone (0.021 mol), in a round bottom flask with a few drops of piperidine, acetic acid and ethanol as the solvent (100 ml). The reaction mixture was refluxed with stirring for 2 h, and filtered to omit the solvent. The recrystallization of the precipitate was performed using ethanol, then left to dry to give the final product (Fig. 1). TODB; brown powder, yield: 90.84%, mp: over 300 °C. DODB; yellow powder, low yield: 15.43%, mp: over 300 °C.
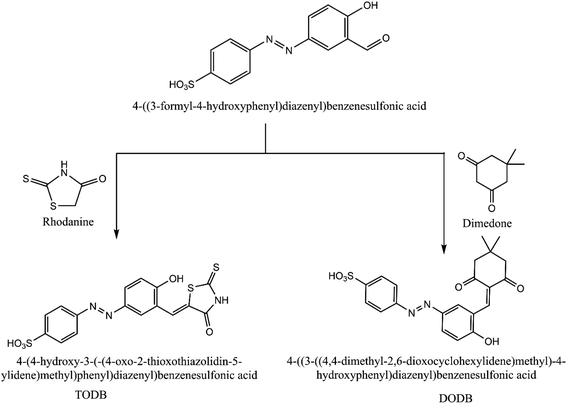 |
| | Fig. 1 Scheme for synthesized inhibitors TODB and DODB. | |
2.2. Corrosive environment
One molar HCl stock solution was made by dilution with double-distilled water. Furthermore, the concentration varieties of the studied compounds were (0.50 × 10⁻⁴–7.50 × 10⁻⁴) and were prepared using ethanol.
2.3. Gravimetric measurements
Weight loss (WL) tests were carried by inserting the tested sheets into an aerated acidic solution HCl (0.1 M) with and without various concentrations of the prepared TODB and DODB at warm temperatures from 298 to 318 K. After a 6 hour soaking, the samples were immediately removed, washed, dried, and weighed. The assessed weight loss was used to quantify the degree of surface coverage (θ) and the inhibition efficiency (% IE) using eqn (1) and (2):24| | |
% IE = [(Wo − Winh)/ Wo] × 100
| (2) |
where Wo and Winh are the weight loss values (mg) without and with inhibitors. Using eqn (3), the corrosion rate, CR (mg cm−2 h−1) was assessed;25where S is the surface area of the metal samples (cm2), and t is the exposure time (h).
2.4. Electrochemical measurements
For studying the inhibition of MS corrosion using TODB and DODB, three distinct electrochemical techniques were used: PDP, EIS, and electrochemical frequency modulation (EFM). At 25 °C, a standard electrochemical cell fabricated from MS (1 cm2 exposed area), a saturated calomel electrode (SCE) and a Pt sheet as the working, reference, and counter electrodes, respectively, was used for electrochemical studies.
2.4.1. PDP technique. Utilizing Gamry framework devices, potentiodynamic current–potential graphs were documented by instantaneously shifting the electrode potential from −1500 mV to +500 mV at a scanning rate of 1 mV s−1 (version 3.20). Corrosion current densities (Icorr) and corrosion potential (Ecorr) were assessed from the interplay of the correlation anodic and cathodic sections of Tafel plots in the absence and presence of various inhibitor concentrations. Using the degree of surface coverage (θ) from eqn (4), the percentage inhibition efficiency (percent IE) was quantified:4,26| | |
% IE = θ × 100 = [1 − (Icorr/Iocorr)] × 100
| (4) |
where Iocorr and Icorr are the corrosion current densities without and with TODB and DODB derivatives, respectively.
2.4.2. EIS measurements. After immersing the electrode for 15 minutes, the EIS spectra were collected at the open circuit potential, OCP. The peak-to-peak voltage of the AC signal was 10 mV, and the resonant frequency evaluated was 0.1–105 Hz. Nyquist and Bode plots were used to present the results. The important variables derived from the analysis of the Nyquist diagram are the resistance of charge transfer (Rct) and the capacity of the double layer (Cdl), which are estimated using eqn (5):27| |
 | (5) |
where fmax is the maximum frequency. The terms (θ) and (% IE) were also estimated using eqn (6):28| | |
%IE = θ × 100 = [1 − (Roct/Rct)]
| (6) |
where Roct and Rct are the charge transfer resistances without and in presence of different concentrations of TODB and DODB, respectively.
2.4.3. EFM technique. EFM was used with 2 and 5 Hz frequencies. Because the reference frequency was 1 Hz, the waveform repeated after 1 second. The higher frequency should be slow enough that the charging of the double layer does not make a contribution to the current approach. Before initiating the readings, the electrode potential was stabilized for 30 minutes. Gamry reference 3000 Potentiostat/Galvanostat/ZRA analyzer, DC 105 corrosion, EIS 300, EFM 140, and Echem Analyst 5.21 software were used for data plotting, graphing, data fitting, and calculating.
2.5. ICPE technique
In this research, the content of dissolved MS in HCl (1.0 M) solutions with and without various amounts of TODB and DODB was determined by ICPE. The ICPE-9820 from SHIMADZU used for our studies was standardized using 1, 5, and 10 ppm made from a 1000 ppm Scharlau iron standard stock solution. The MS coupons were submerged in various doses of the newly synthesized compounds for 24 hours. The content of dissolved iron was then measured in the solutions after dilution with ultra-pure demineralized water to obtain results that were plotted on the calibration graph for the instrument.29
2.6. UV-analysis
An ultraviolet-visible spectrophotometer (Thermo Fisher Scientific) was employed to examine the shift in wavelength following MS immersion in HCl (1.0 M) for 24 h, both with and without the addition of TODB and DODB. A shift in wavelength was a strong indicator that a combination between the inhibitor molecules and the Fe2+ on the electrode had formed.30
2.7. SEM and EDX tests
The MS surface was studied using the SEM JEOL JSM-IT200 apparatus with and without the application of an appropriate molarity of TODB and DODB after being submerged in HCl (1.0 M) for one day. The quantitative concentration of the constituents from the solutions adsorbed on the MS surface was also determined using EDX.
2.8. Biological activity
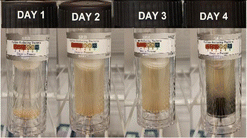
H2S is produced by a kind of anaerobic bacteria (SRB), which can speed up the corrosion process. The test was conducted using SRB-BART™ testers from Droycon Bioconcepts, Inc. (DBI). The test time is 11 days, and the test results can be obtained by counting the number of bacterial colonies present when the test vials first turn black. Each day refers to a certain quantity of germs that are present.31
2.9. Theoretical chemical parameters
Using Gaussian 09 with Gauss View 06 software with different basis sets (semi-empirical PM6, Hartree–Fock 631G, DFT 6311G and MP2-6-311G), the optimized chemical calculations were performed. Different parameters were obtained via the calculations. The highest (EHOMO) occupied and lowest (ELUMO) unoccupied molecular orbitals energies, and the energy gap (ΔE) between them were calculated. Other parameters were also optimized, including IP (ionization potential), EA (electron affinity), χ (electronegativity), ω (electrophilicity), ΔN (transferred electrons), σ (softness), η (hardness), μ (dipole moment), MV (molecular volume) and TNC (total negative charge). According to the following equations, the different parameters can be calculated as follows:32–35| |
 | (13) |
The interactions between the TODB and DODB molecules (either in neutral or protonated phase) and the mild steel surface were theoretically investigated by Monte Carlo simulations using adsorption locator module in Material studio 2017 software. The acidic aqueous conditions were brought by adding 200 H2O, 20 H3O+ and Cl−. Fe was cleaved over the most stable (110) plane. The Fe (110) was expanded to a (10 × 10) super cell, and a vacuum with 30 Å was formed above the Fe (110) plane. To find the equilibrium adsorption configurations, the COMPASS force field was used.
3. Results and discussions
3.1. Structure confirmation of the prepared compounds
3.1.1. FTIR spectrum (KBr, νmax, cm−1). The IR spectrum revealed characteristic bands of the two synthesized compounds, as shown in Fig. 2. The infrared spectrum of TODB revealed clear absorption bands at 2849.04 and 2964.92 cm−1 related to the bending vibration of the (Aliphatic C–H) group. The band at 3054.29 cm−1 is attributed to the stretching vibration of the (Aromatic C–H). The bands at 3137.68 and 1620.01 cm−1 refer to the stretching vibration of (NH). The band at 1433.65 cm−1 is attributed to the stretching vibration of the azo group (N![[double bond, length as m-dash]](https://www.rsc.org/images/entities/char_e001.gif) N). The band at 1688.74 cm−1 is attributed to the stretching vibration of (C
N). The band at 1688.74 cm−1 is attributed to the stretching vibration of (C![[double bond, length as m-dash]](https://www.rsc.org/images/entities/char_e001.gif) O). The band at 1620.01 cm−1 is attributed to the stretching vibration of ν (C
O). The band at 1620.01 cm−1 is attributed to the stretching vibration of ν (C![[double bond, length as m-dash]](https://www.rsc.org/images/entities/char_e001.gif) C) arylidene group and overlapped with (C
C) arylidene group and overlapped with (C![[double bond, length as m-dash]](https://www.rsc.org/images/entities/char_e001.gif) O) at 1688.74 cm−1. The band at 1030.84 cm−1 is attributed to the stretching vibration of (C
O) at 1688.74 cm−1. The band at 1030.84 cm−1 is attributed to the stretching vibration of (C![[double bond, length as m-dash]](https://www.rsc.org/images/entities/char_e001.gif) S). Finally, the band at 3404.59 cm−1 is attributed to the (Phenolic OH, SO3H) groups.
S). Finally, the band at 3404.59 cm−1 is attributed to the (Phenolic OH, SO3H) groups.
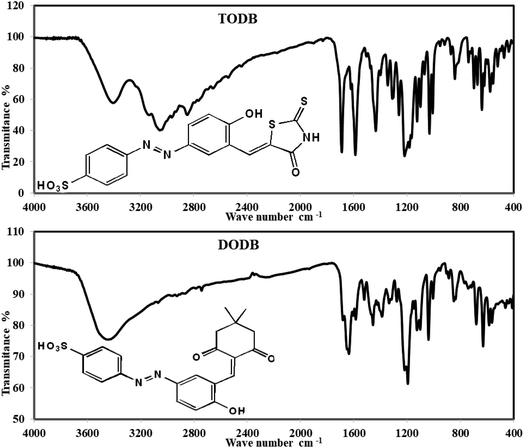 |
| | Fig. 2 FTIR spectrum for synthesized inhibitors TODB and DODB. | |
On the other hand, the infrared spectrum of DODB revealed clear absorption bands at 2742.55, 2866.72, 2931.48 cm−1, which were attributed to the bending vibration of the (Aliphatic C–H) group. The band at 3066.88 cm−1 owing to the stretching vibration of (Aromatic C–H), and the bands at 1637.73 cm−1 referred to the stretching vibration of the (C![[double bond, length as m-dash]](https://www.rsc.org/images/entities/char_e001.gif) O) ketone. The band at 1457.45 cm−1 is attributed to the stretching vibration of the azo group (N
O) ketone. The band at 1457.45 cm−1 is attributed to the stretching vibration of the azo group (N![[double bond, length as m-dash]](https://www.rsc.org/images/entities/char_e001.gif) N). The band at 1683.41 cm−1 is attributed to the stretching vibration of ν (C
N). The band at 1683.41 cm−1 is attributed to the stretching vibration of ν (C![[double bond, length as m-dash]](https://www.rsc.org/images/entities/char_e001.gif) C) arylidene group and overlapped with (C
C) arylidene group and overlapped with (C![[double bond, length as m-dash]](https://www.rsc.org/images/entities/char_e001.gif) O) at 1637.73 cm−1. Finally, the band at 3448.31 cm−1 is attributed to (Phenolic OH, SO3H) groups.
O) at 1637.73 cm−1. Finally, the band at 3448.31 cm−1 is attributed to (Phenolic OH, SO3H) groups.
The frequency calculations were performed on the TODB and DODB compounds using DFT/B3LYP/6-311+G and HF-631G basis sets. The calculated frequencies and scale factors are listed in Table 1. The calculated data were compatible with the experimental frequencies, as the scale factor values were close to unity.
Table 1 Frequencies and scale factor of the IR-active vibrational modes of TODB and DODB resulting from DFT, HF calculations and experiment
| Assignment |
TODB (IR frequencies cm−1) |
DODB (IR frequencies cm−1) |
| Experimental |
Scale factor |
DFT/B3LYP/6-311+G |
Scale factor |
HF-631G |
Experimental |
Scale factor |
DFT/B3LYP/6-311+G |
Scale factor |
HF-631G |
| Phenolic OH |
3404.59 |
0.9190 |
3704.73 |
0.8839 |
3851.88 |
3448.31 |
0.9317 |
3701.22 |
0.8477 |
4068.08 |
| NH |
3137.68 |
0.8713 |
3601.05 |
0.8259 |
3799.26 |
— |
— |
— |
— |
— |
| Aromatic CH |
3054.29 |
0.9516 |
3209.48 |
0.8977 |
3402.37 |
3066.88 |
0.9556 |
3209.30 |
0.9007 |
3404.91 |
| Aliphatic CH |
2964.92 |
0.9510 |
3117.71 |
0.8730 |
3396.27 |
2931.48 |
0.9505 |
3084.10 |
0.9236 |
3173.92 |
C![[double bond, length as m-dash]](https://www.rsc.org/images/entities/char_e001.gif) O O |
1688.74 |
0.9999 |
1688.86 |
0.9833 |
1717.44 |
1683.41 |
1.0029 |
1678.58 |
0.9104 |
1849.08 |
N![[double bond, length as m-dash]](https://www.rsc.org/images/entities/char_e001.gif) N N |
1433.65 |
0.9720 |
1475.01 |
0.9968 |
1438.23 |
1457.45 |
0.9860 |
1478.21 |
0.8309 |
1753.96 |
C![[double bond, length as m-dash]](https://www.rsc.org/images/entities/char_e001.gif) S S |
1030.84 |
1.0043 |
1026.46 |
0.9120 |
1130.30 |
— |
— |
— |
— |
— |
3.1.2. 1H0 NMR (DMSO-d6). Fig. 3 shows the 1HNMR for TODB, which is 400 MHz; at: δ = 3.1 ppm (1H, s, NH), 7.14 ppm (1H, s, HC![[double bond, length as m-dash]](https://www.rsc.org/images/entities/char_e001.gif) C) (Arylidene), 1.91 ppm (1H, s, Phenolic OH), δ = 10.37 ppm (SO3H)), δ = 7.9–8.20 ppm (7H, multiplet, Ar–H). 1HNMR for DODB is 400 MHz; at: δ = 7.18, 7.15 (1H, d, J = 12 Hz, HC
C) (Arylidene), 1.91 ppm (1H, s, Phenolic OH), δ = 10.37 ppm (SO3H)), δ = 7.9–8.20 ppm (7H, multiplet, Ar–H). 1HNMR for DODB is 400 MHz; at: δ = 7.18, 7.15 (1H, d, J = 12 Hz, HC![[double bond, length as m-dash]](https://www.rsc.org/images/entities/char_e001.gif) C) (Arylidene), δ = 1.91 ppm (Phenolic OH), δ = 10.39 ppm (SO3H), δ = 7.86–7.78 ppm (7H, multiplet, Ar–H), δ = 5.17 ppm ((1H,s, –OH
C) (Arylidene), δ = 1.91 ppm (Phenolic OH), δ = 10.39 ppm (SO3H), δ = 7.86–7.78 ppm (7H, multiplet, Ar–H), δ = 5.17 ppm ((1H,s, –OH![[double bond, length as m-dash]](https://www.rsc.org/images/entities/char_e001.gif) CH–(CH3)2), δ = 0.89, 1.0 ppm ((CH3)2).
CH–(CH3)2), δ = 0.89, 1.0 ppm ((CH3)2).
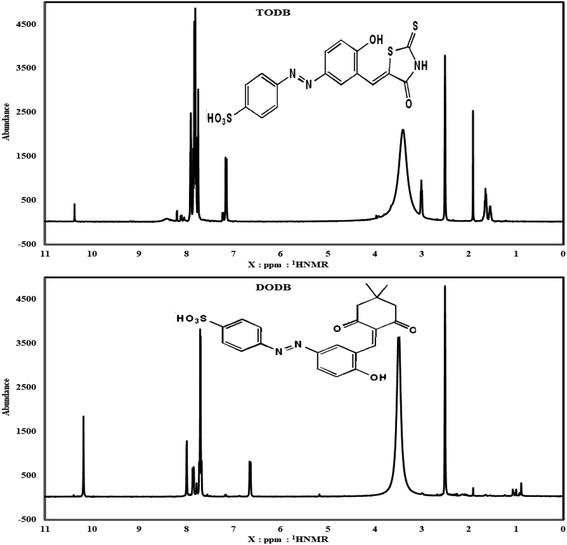 |
| | Fig. 3 HNMR spectrum for synthesized inhibitors TODB and DODB. | |
3.1.3. Mass spectrum. The mass spectrum (Fig. 4) for TODB showed that m/z (M+.) = 421 (25.60%) and the molecular ion peak as the base peak at m/z (%); 152 (100%) together with other peaks at m/z (%); 330 (17.75%), 249 (24.10%), 56 (88.34%), 306 (33.70%), 334 (60.97%), 286 (0%), M + 1 = 287 (35.64%) &194 (17.82%). The mass spectrum for DODB (Fig. 4) showed that the m/z (M+.) = 428 (0%), (M+. +1) = 429 (34.93%), (M+. −1) = 427 (20.39%) and molecular ion peak as the base peak at m/z (%); 319 (100%) together with other peaks at m/z (%); 244 (25.83%), 185 (9.88%) &101 (14.02%).
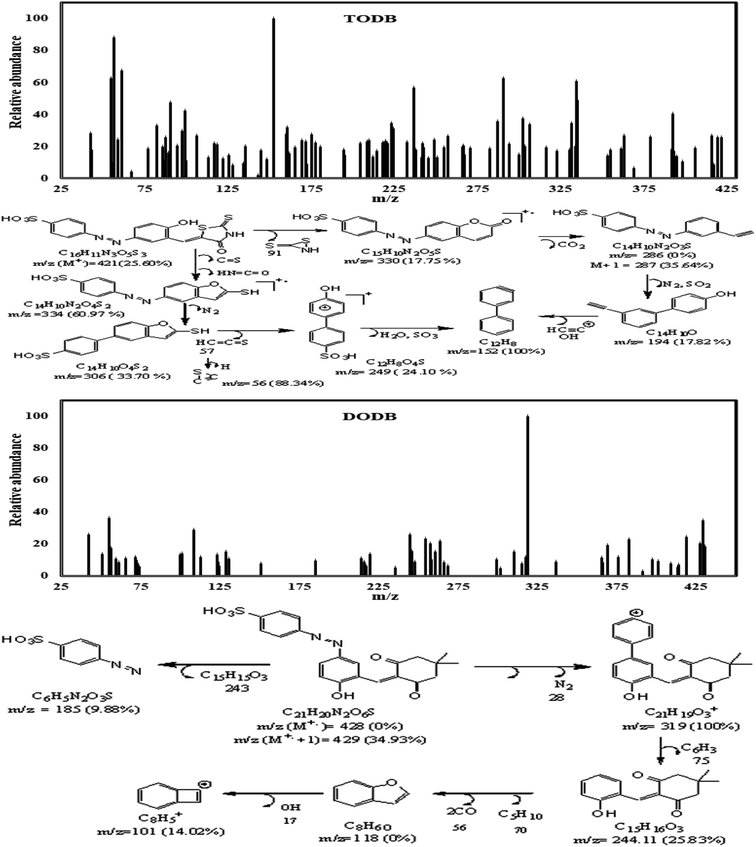 |
| | Fig. 4 Mass spectrum and fragmentations for synthesized inhibitors TODB and DODB. | |
3.2. Evaluation techniques
3.2.1. Gravimetric results. The weight loss (WL) measurements of MS in HCl (1.0 M) solution were accomplished at different time intervals and temperatures (298 K–318 K) in the presence of corrosive medium-free inhibitors and 0.5 × 10⁻⁴ and 7.5 × 10⁻⁴ of TODB and DODB, respectively. Fig. 5 depicts the relationship among the arithmetic values for both the corrosion rate (CR) and the inhibition efficiency (percent IE) of the prepared TODB and DODB against log C at various temperatures (298 K–318 K). Table 2 also includes the average values of the CR, and percent IE of the studied organic compounds. Table 2 shows that as the inhibitor concentrations increased and the temperature remained constant, the values of CR decreased while the percent IEs increased. This can be attributed to the increased adsorption coverage of the inhibitor molecules on the metal substrate with increasing concentrations, which decreased the MS dissolution rates. As an outcome, the investigated organic molecules are recognized as capable inhibitors of MS corrosion in HCl (1.0 M) solutions. In contrast, at constant inhibitor concentration and rising temperature, the value of CR rose marginally while the percent IE grew exponentially. These research results unequivocally prove that the adsorption mechanism of prepared TODB and DODB on the metallic substrate in HCl (1.0 M) solutions was characteristic of chemical adsorption. Fiori-Bimbi et al.36 discovered similar results while inhibiting M − steel corrosion in HCl solutions with pectin. The values of % IE obtained for the inhibitor TODB were often greater than those for the inhibitor DODB. The physicochemical properties of the molecules, such as the functional groups, steric factor, molecular (size, weight, and structure) and aromaticity,37–39 determine the adsorption of any corrosion inhibitors. Since the investigated azo compounds (TODB and DODB) have these characteristics, they have a good adsorption capacity and thus can behave as effective corrosion inhibitors. By comparison with previous publications, it was noticed that the currently investigated compounds had higher percentage of IEs than other reported organic dyes as corrosion inhibitors of various steel alloys in acidic environment.40–42
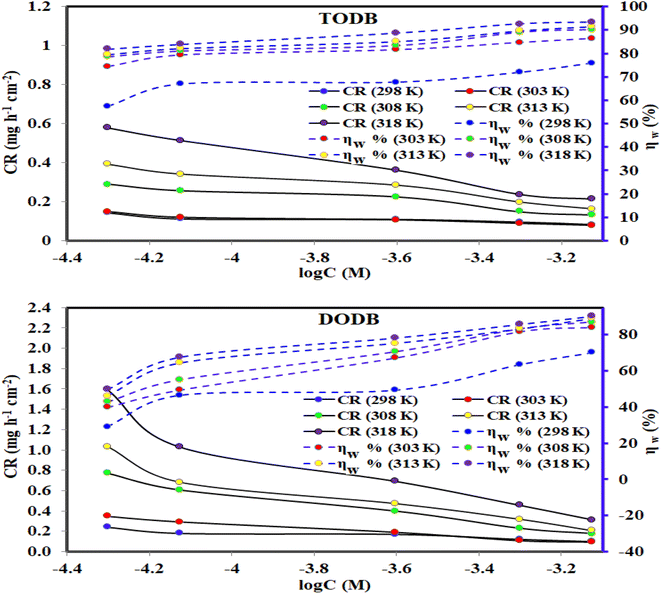 |
| | Fig. 5 Effect of various temperatures and concentrations for synthesized inhibitors TODB and DODB on CR of steel in 1 M HCl using WL method. | |
Table 2 Corrosion rate (CR), surface coverage (θ) and percentage of inhibition efficiency (η) of MS in 1.0 M HCl of the TODB and DODB derivatives at different temperatures
| Inhibitor |
Inhibitor conc. (M) |
25 °C |
30 °C |
35 °C |
40 °C |
45 °C |
| CR, (mg cm−2 h−1) |
θ |
ηw (%) |
CR, (mg cm−2 h−1) |
θ |
ηw (%) |
CR, (mg cm−2 h−1) |
θ |
ηw (%) |
CR, (mg cm−2 h−1) |
θ |
ηw (%) |
CR, (mg cm−2 h−1) |
θ |
ηw (%) |
| Blank |
0.00 × 10⁻⁴ |
0.3365 |
— |
— |
0.5765 |
— |
— |
1.3534 |
— |
— |
1.9141 |
— |
— |
3.1736 |
— |
— |
| TODB |
0.50 × 10⁻⁴ |
0.1432 |
0.574 |
57.45 |
0.1479 |
0.743 |
74.34 |
0.2894 |
0.786 |
78.62 |
0.3917 |
0.795 |
79.54 |
0.5776 |
0.818 |
81.80 |
| 0.75 × 10⁻⁴ |
0.1113 |
0.669 |
66.93 |
0.1194 |
0.793 |
79.29 |
0.2565 |
0.810 |
81.04 |
0.3418 |
0.821 |
82.14 |
0.5134 |
0.838 |
83.82 |
| 2.50 × 10⁻⁴ |
0.1087 |
0.677 |
67.71 |
0.1065 |
0.815 |
81.53 |
0.2254 |
0.833 |
83.34 |
0.2846 |
0.851 |
85.13 |
0.3612 |
0.886 |
88.62 |
| 5.00 × 10⁻⁴ |
0.0945 |
0.719 |
71.93 |
0.0882 |
0.847 |
84.69 |
0.1494 |
0.890 |
88.96 |
0.1976 |
0.897 |
89.68 |
0.2365 |
0.925 |
92.55 |
| 7.50 × 10⁻⁴ |
0.0812 |
0.759 |
75.88 |
0.0783 |
0.864 |
86.42 |
0.1334 |
0.901 |
90.14 |
0.1622 |
0.915 |
91.52 |
0.2126 |
0.933 |
93.30 |
| DODB |
0.50 × 10⁻⁴ |
0.2389 |
0.290 |
29.00 |
0.3473 |
0.398 |
39.76 |
0.7732 |
0.429 |
42.87 |
1.0309 |
0.461 |
46.14 |
1.5949 |
0.497 |
49.75 |
| 0.75 × 10⁻⁴ |
0.1802 |
0.464 |
46.44 |
0.2920 |
0.493 |
49.34 |
0.6071 |
0.551 |
55.14 |
0.6816 |
0.644 |
64.39 |
1.0283 |
0.676 |
67.60 |
| 2.50 × 10⁻⁴ |
0.1707 |
0.493 |
49.28 |
0.1898 |
0.671 |
67.08 |
0.3978 |
0.706 |
70.61 |
0.4721 |
0.753 |
75.34 |
0.6908 |
0.782 |
78.23 |
| 5.00 × 10⁻⁴ |
0.1230 |
0.635 |
63.46 |
0.1063 |
0.816 |
81.56 |
0.2277 |
0.832 |
83.17 |
0.3187 |
0.834 |
83.35 |
0.4545 |
0.857 |
85.68 |
| 7.50 × 10⁻⁴ |
0.1006 |
0.701 |
70.10 |
0.0922 |
0.840 |
84.00 |
0.1759 |
0.870 |
87.00 |
0.2067 |
0.892 |
89.20 |
0.3124 |
0.902 |
90.16 |
3.2.2. PDP measurements. This method was used to study both cathodic and anodic reactions of TODB and DODB at 298 K in HCl (1.0 M) without and with inhibitor on the MS electrode after performing the OCP test, and approaching the steady state potential. Fig. 6 shows the polarization profiles that were acquired. It was also found in the literature43 that when the corrosion potential (Ecorr) shift is greater than ±85 mV vs. the Ecorr of the uninhibited sample, the inhibitor is classified as cathodic or anodic, while it is classified as mixed-type when the shift is less than ±85 mV. The introduction of TODB and DODB in HCl (1.0 M) solution markedly decreased the Tafel sections in the current study, and the movement in the Ecorr was less than ±85 mV, indicating that the prepared azo derivatives are mixed-type inhibitors.44 The electrochemical variables like Ecorr, Tafel constants for both anode (βa) and cathode (βc), corrosion current density (Icorr), polarization resistance (Rp), (θ), (CR), and (% IE) were calculated from the Tafel graphs and are listed in Table 3.
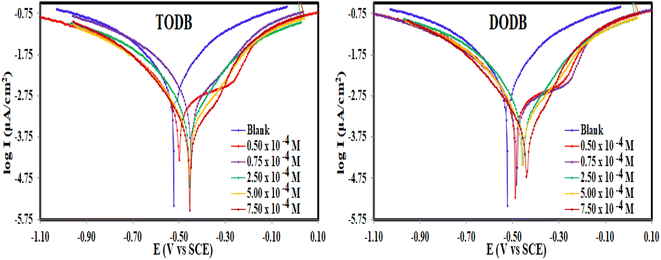 |
| | Fig. 6 PDP curves for the corrosion of MS in 1 M HCl with and without different concentrations of synthesized inhibitors TODB and DODB at 25 °C. | |
Table 3 Electrochemical parametersa for MS dissolution in 1.0 M HCl solution containing different concentrations of the (DODB–TODB) inhibitors obtained from PDP measurements at 30 °C
| Inhibitor name |
Conc. (M) |
Ecorr vs. SCE (mV) |
Icorr (μA cm−2) |
βa (mV dec−1) |
βc (mV dec−1) |
CR (mpy) |
θ |
ηp% |
| Ecorr is the corrosion potential; Icorr is the corrosion current density: βa and βc are Tafel constants for both anode and cathode; (CR) is the corrosion rate; θ is the surface coverage; ηp is the inhibition efficiency. |
| Blank |
— |
−523 |
8624 |
305 |
333 |
4137 |
— |
— |
| DODB |
0.50 × 10⁻⁴ |
−489 |
3990 |
607.1 |
599.7 |
1825 |
0.537 |
53.71 |
| 0.75 × 10⁻⁴ |
−484 |
3290 |
578.9 |
564.1 |
1504 |
0.618 |
61.83 |
| 2.50 × 10⁻⁴ |
−454 |
1540 |
230 |
243 |
702.9 |
0.821 |
82.13 |
| 5.00 × 10⁻⁴ |
−458 |
945 |
211.3 |
217.6 |
431.6 |
0.890 |
89.04 |
| 7.50 × 10⁻⁴ |
−439 |
553 |
175.6 |
204.7 |
252.8 |
0.936 |
93.58 |
| TODB |
0.50 × 10⁻⁴ |
−499 |
3730 |
625.2 |
590.2 |
1704 |
0.567 |
56.73 |
| 0.75 × 10⁻⁴ |
−448 |
2560 |
239.6 |
259.2 |
1170 |
0.703 |
70.30 |
| 2.50 × 10⁻⁴ |
−456 |
1330 |
232.7 |
245.9 |
606.7 |
0.846 |
84.57 |
| 5.00 × 10⁻⁴ |
−457 |
713 |
201.7 |
217.6 |
325.9 |
0.917 |
91.73 |
| 7.50 × 10⁻⁴ |
−454 |
436 |
177.6 |
192.5 |
199.1 |
0.949 |
94.94 |
By extrapolating the linear parts of the Tafel branches to the relevant values of (Ecorr), the values of (Icorr) were computed. The analysis of the results showed that, in comparison to the uninhibited solution, the (Icorr) and (CR) decreased in the presence of TODB and DODB, demonstrating that these substances were adsorbed on the MS surface and delayed the dissolving of the metal in the acidic environment (Table 3). Furthermore, when compared to the inhibitor-free sample, the azo derivatives reduced the oxidation reaction of MS and delayed the hydrogen ion reduction on the surface of the cathode. Moreover, the equivalent form of the Tafel curves suggests that the inhibition mechanism is activation-controlled in the existence of the evaluated inhibitors.45 The (Icorr) values are much lower in the presence of the inhibitors (0.436 mA cm−2 for TODB and 0.55 mA cm−2 for DODB) than in the absence of the inhibitors (0.86 mA cm−2), with maximum efficiency (94.9% and 93.6%), respectively, at concentrations of 7.50 × 10⁻⁴ M for TODB and DODB, indicating that these materials mitigate corrosion and preserve MS. The involvement of more hetero atoms (S and N) with lone pair of electrons in the framework of the (TODB) molecule, which increases adsorption, may explain the higher η for the (TODB) molecule compared to the (DODB) molecule.
3.2.3. EIS study. EIS readings were used to prove the previously mentioned corrosion behavior, as well as to investigate the capacitive characteristics at the MS/solution interface. The Nyquist and Bode plots of the MS in HCl (1.0 M) without and in the existence of different molarities of (TODB and DODB) are seen in Fig. 7a, after the OCP test and approaching the steady state potential. The documented Nyquist plots resembled each other, indicating that the addition of (TODB and DODB) inhibited MS corrosion without influencing the mechanism.46 At low frequency, the Nyquist plots are best described by only single semicircles, suggesting that the corrosion process is under charge transfer control.47 The increasing values of (n) (Table 4) for (TODB and DODB) versus the blank sample clearly show that the inhibitor increases surface uniformity via adsorption. Fig. 7b shows the correlating Bode plots for the MS electrode immersed in HCl (1.0 M) with and without various concentration levels. As shown by these figures, there is an increase in the absolute impedance |Z| at low frequencies. This increase confirms the higher (percent η) obtained at high concentration, which is due to adsorption of (TODB and DODB) on the MS surface and blocking its active sites. Furthermore, the shift in phase angle values in the negative direction demonstrates that TODB and DODB primarily perform by providing a thin film over the MS surface.48,49
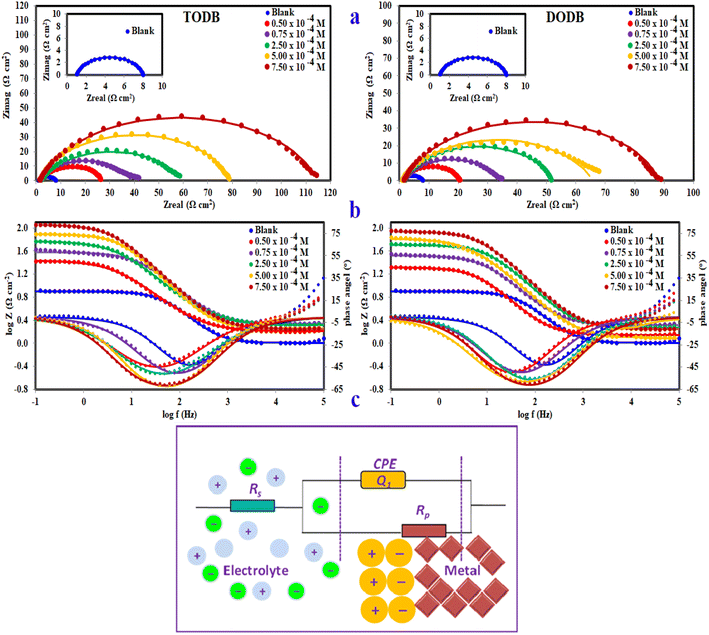 |
| | Fig. 7 Nyquist plots (a), Bode & phase angle (b) and the equivalent circuit model (c) for fitting EIS data for MS in 1 M HCl with and without different concentrations of synthesized inhibitors TODB and DODB at 25 °C. | |
Table 4 EIS parameters for corrosion of MS in 1.0 M HCl in the absence and presence of different concentrations of (DODB–TODB) inhibitors at 30 °Ca
| Inhibitor |
Conc. (M) |
Rs (Ru) (Ω cm2) |
Rct (Rp) (Ω cm2) |
Yo (μΩ −1 sn cm−2) |
n |
Cdl (μF cm−2) |
Chi squared |
S |
α |
θ |
ηz % |
| Rs = solution resistance, Rct = charge transfer resistance, Y0, n = constant phase elements, Cdl = double layer capacitance, θ = surface coverage, ηz = inhibition efficiency. |
| Blank |
— |
1.082 |
6.884 |
478.50 |
0.8836 |
225.363 |
2.25 × 10⁻² |
−0.365 |
−42.07 |
— |
— |
| DODB |
0.50 × 10⁻⁴ |
1.385 |
19.42 |
2129.00 |
0.8493 |
1209.689 |
9.14 × 10 −3 |
−0.449 |
−49.67 |
0.6455 |
64.55 |
| 0.75 × 10⁻⁴ |
2.077 |
31.98 |
1049.00 |
0.8299 |
523.103 |
4.97 × 10 −3 |
−0.511 |
−49.78 |
0.7847 |
78.47 |
| 2.50 × 10⁻⁴ |
1.877 |
50.2 |
536.60 |
0.8453 |
276.941 |
3.99 × 10 −3 |
−0.627 |
−55.48 |
0.8629 |
86.29 |
| 5.00 × 10⁻⁴ |
1.203 |
64.43 |
128.10 |
0.7983 |
38.121 |
1.55 × 10⁻³ |
−0.652 |
−58.38 |
0.8932 |
89.32 |
| 7.50 × 10⁻⁴ |
1.761 |
86.56 |
457.50 |
0.8416 |
249.150 |
4.74 × 10 −3 |
−0.679 |
−60.15 |
0.9205 |
92.05 |
| TODB |
0.50 × 10⁻⁴ |
1.601 |
26.16 |
2717.00 |
0.757 |
1162.759 |
6.88 × 10 −3 |
−0.426 |
−44.38 |
0.7369 |
73.69 |
| 0.75 × 10⁻⁴ |
2.149 |
36.49 |
635.30 |
0.8237 |
283.835 |
6.16 × 10 −3 |
−0.564 |
−50.62 |
0.8113 |
81.13 |
| 2.50 × 10⁻⁴ |
2.066 |
57.41 |
1164.00 |
0.77 |
518.754 |
5.30 × 10 −3 |
−0.523 |
−51.41 |
0.8801 |
88.01 |
| 5.00 × 10⁻⁴ |
1.807 |
77.04 |
548.40 |
0.8708 |
342.934 |
4.82 × 10 −3 |
−0.662 |
−61.68 |
0.9106 |
91.06 |
| 7.50 × 10⁻⁴ |
1.773 |
112.9 |
598.40 |
0.8328 |
348.361 |
5.03 × 10 −3 |
−0.662 |
−61.31 |
0.9390 |
93.90 |
Fig. 7a and b show a comparison of the experimental EIS data recorded for (TODB and DODB) in the presence of various concentrations in comparison to the blank. The well-fitted data were collected by employing the equivalent circuit shown inset (Fig. 7c), where Rs (the solution resistance), Rct, and Cdl are recorded in Table 4. The EIS variables determined with this circuit indicate that Rct is directly related to the molarity of the inhibitor, whereas the (Cdl) values show the inverse correlation. This concept could be caused by either H2O molecule desorption from the surface of MS or inhibitor adsorption on the metal substrate.50,51 In agreement with previous techniques, the % η of the evaluated azo derivatives is as follows: (TODB) > (DODB), with optimum inhibition values of 93.9% and 92.05%. This EIS-observed attitude corresponds to the polarization data. The electron donating impact of the sulfonyl (–SO3H) and hydroxyl (–OH) groups bonded to the aromatic ring increases the electron density on the benzene ring, inhibiting the corrosion process.
3.2.4. EFM technique. EFM is a nondestructive technique that can provide (Icorr) values without the need for previous information of Tafel constants (βc and βa). EFM, like EIS, is a technique that employs small AC signals. In contrast to EIS, two sine waves (at different frequencies) are implemented to the cell all at once. Icorr can be calculated from the intermodulation spectra at the tallest altitude employing EFM instead of using Tafel slope values (βc and βa). We can also use the causality factors [CF-2 and CF-3] to verify the information generated by this technique.52 The EFM intermodulation spectra are a relationship of the current feedback as a function of input frequency that includes current feedback reflecting harmonic and intermodulation peaks. All kinetic components derived from EFM, such as corrosion current, Tafel slopes, and causality factors, were calculated using the highest peaks and are shown in Table 4. EFM measurements were used to calculate the (% η) and (θ) of the studied compounds from the following equation:53| | |
% ηEFM = θ × 100 = [(iocorr − icorr)/iocorr t] × 100
| (14) |
The intermodulation spectra of the two prepared azo derivative (TODB and DODB) obtained in this study are shown in Fig. 8. The data in Table 5 show that the icorr values for the studied molecules are lower than those for the aggressive solution HCl (1.0 M), indicating that they inhibited corrosion. It was also discovered that icorr changed with concentration, reaching its lowest value at the highest concentration (7.50 × 10⁻⁴ M), indicating that the (ηEFM percent) increases with azo derivative concentrations. Table 5 also shows that the surface coverage values of the TODB molecules are greater than those of DODB, implying that the inhibition of TODB is greater than that of DODB. Finally, as a result, we can conclude and guarantee the method's and result's validity.
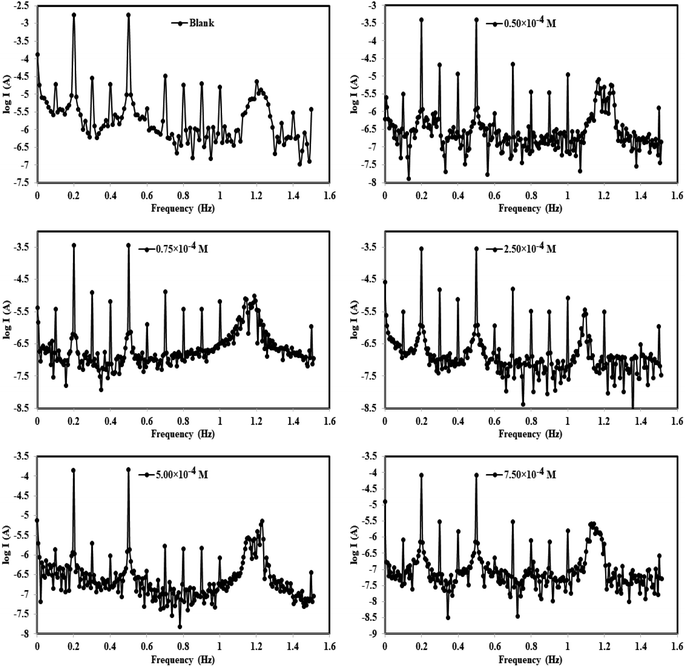 |
| | Fig. 8 EFM curves for the corrosion of MS in 1 M HCl with and without different concentrations of synthesized inhibitor (DODB for example) at 25 °C. | |
Table 5 Electrochemical kinetic parametersa obtained by EFM technique for MS in the absence and presence of various concentrations of (DODB–TODB) inhibitors in 1.0 M HCl at 30 °C
| Inhibitor name |
Conc. (M) |
Icorr (μA cm−2) |
βa (mV dec−1) |
−βc (mV dec−1) |
CF-2 |
CF-3 |
k (mpy) |
θ |
ηEFM% |
| Ecorr is the corrosion potential; Icorr is the corrosion current density: βa and βc are Tafel constants for both anode and cathode; k is the corrosion rate; θ is the surface coverage; ηEFM is the inhibition efficiency. |
| Blank |
— |
2791 |
100.4 |
113.1 |
1.763 |
3.155 |
1275.00 |
— |
— |
| DODB |
0.50 × 10⁻⁴ |
755.2 |
103.4 |
158.5 |
1.905 |
3.534 |
345.1 |
0.7294 |
72.94 |
| 0.75 × 10⁻⁴ |
649.8 |
103.5 |
133.1 |
1.976 |
3.136 |
296.90 |
0.7672 |
76.72 |
| 2.50 × 10⁻⁴ |
496.8 |
96.22 |
142.8 |
1.956 |
2.789 |
227.00 |
0.8220 |
82.20 |
| 5.00 × 10⁻⁴ |
270.1 |
116.5 |
128.1 |
2.009 |
3.467 |
123.4 |
0.9032 |
90.32 |
| 7.50 × 10⁻⁴ |
166.3 |
112.2 |
148.3 |
1.958 |
2.925 |
76.01 |
0.9404 |
94.04 |
| TODB |
0.50 × 10⁻⁴ |
694.4 |
108.2 |
131.1 |
1.948 |
2.930 |
317.30 |
0.7512 |
75.12 |
| 0.75 × 10⁻⁴ |
550.4 |
119.5 |
192.6 |
1.967 |
3.061 |
251.50 |
0.8028 |
80.28 |
| 2.50 × 10⁻⁴ |
416.1 |
100 |
109.9 |
2.143 |
3.093 |
190.1 |
0.8509 |
85.09 |
| 5.00 × 10⁻⁴ |
203.4 |
100.8 |
105.5 |
1.547 |
3.76 |
92.94 |
0.9271 |
92.71 |
| 7.50 × 10⁻⁴ |
133.3 |
114.3 |
146.9 |
1.980 |
2.914 |
60.91 |
0.9522 |
95.22 |
3.3. Adsorption isotherm
The examined TODB and DODB involve heteroatoms like O, S, and N in TODB and O and S in DODB, as well as aromatic rings and azo groups that can be adsorbed on the steel surface to generate protective layers.53 These layers can be created using one of the adsorption modes listed as follows:54 (1) physical: arises as a result of electrostatic forces between the protonated groups of organic molecules and the charged metal surface; (2) chemical: by forming coordination bonds between the vacant d orbital of the substrate and the lone pair of electrons of the heteroatoms; or (3) integration of two adsorption types. To observe and analyze the better adsorption isotherm (Langmuir, Flory–Huggins, Temkin, Frumkin, Freundlich type and Kinetic model) of experimented azo compounds, graphs of each adsorption isotherms were evaluated separately (Fig. 9). The regression correlation coefficient (R2) values listed in Table 6 show that the adsorption behavior of TODB and DODB on the MS surface correlated well with the Langmuir isotherm,55 which is given by the formula:56| | |
Cinh/θ = (1/Kads) + Cinh
| (15) |
where Cinh is the molarity of the tested TODB and DODB inhibitors, Kads is the adsorption–desorption equilibrium constant for the metal substrate processes, and (θ) is estimated using electrochemical methods. The graph of C against C/θ demonstrates a straight fitting line with a slope and correlation coefficient near 1 (Fig. 9). Formula (8) was used to quantify (Kads) from the standard free energy of adsorption ( ):57
):57| |
 | (16) |
where Csolvent denotes the molarity of water in solution, T denotes the absolute temperature, and R denotes the universal gas constant. Table 6 shows the thermodynamics for the adsorption process of the experimented molecules (TODB and DODB). The fact that the  is negative implies that the tested molecules (TODB and DODB) adsorb spontaneously on the surface of MS. Furthermore, higher Kads values indicate a strong adsorption property, and as a result, a better inhibition property.58 In general, absolute values of
  of (−20 kJ mol−1) or less indicate electrostatic interaction (i.e., physisorption). Values around −40 kJ mol−1 or more negative values, on the other hand, indicate charge sharing and bond formation (chemisorption),59 although there is little difference between the
  values (between −20 and −40 kJ mol−1). This shows that TODB and DODB are physically and chemically adsorbed on the surface of MS, with physical adsorption having a particularly strong adsorption effect.60 It also appeared from Table 6 that the Kads values of TODB molecules are higher than that of DODB, which can be interpreted as the inhibition of TODB < DODB.
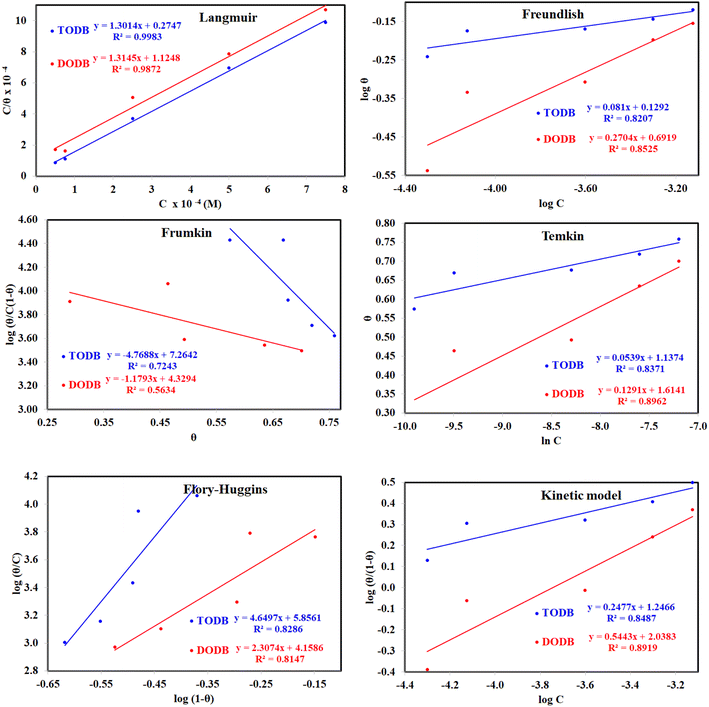 |
| | Fig. 9 Different adsorption isotherms for synthesized inhibitors TODB and DODB using WL method. | |
Table 6 Adsorption isotherm models of the inhibitorsa with values of R2, slopes, intercepts, Kads, and  obtained by using data from WL measurements
3.4. Effect of temperature and activation parameters
The activation energy (Ea) and other thermodynamic activation functions can be calculated using mass loss experiments at different temperatures with and without inhibitors. The findings can help to explain the mechanism of inhibition. This study adds to our understanding of the adsorption mechanism by analyzing the thermodynamic parameters for MS dissolution in HCl (1.0 M) without and in the presence of different molarities of TODB and DODB. The Arrhenius and transition-state equations61 were used to obtain these thermodynamic functions:| |
CR = A![[thin space (1/6-em)]](https://www.rsc.org/images/entities/char_2009.gif) exp(−Ea/RT) exp(−Ea/RT)
| (17) |
| |
 | (18) |
where  and
and  are the apparent entropy of activation and enthalpy of activation, respectively, and h and N are Planck's constant and Avogadro's number, respectively. In the case of heterogeneous chemical reactions, the constant A is known as the pre-exponential factor because it is related to the number of active centers. For MS in HCl (1.0 M) solutions containing different molarities of the two investigated inhibitors in the temperature range of 298 K to 318 K, the Arrhenius and transition state plots were constructed using chemical and electrochemical measurements. The Arrhenius and transition state plots of MS in HCl (1.0 M) solution without and with different molarities (0.50 × 10⁻⁴ to 7.50 × 10⁻⁴ M) are shown in Fig. 10. Table 7 shows the values of the thermodynamic activation functions calculated from these plots as a function of the inhibitor concentration. The rise in inhibition efficiency values with increasing temperature (see Table 2), and the gradual decrease in
  with increasing molar concentration of the inhibitor (Table 7) can be explained on the basis of chemical adsorption. According to Amin et al.,60 it is clear from the data in Table 6 that the process of MS dissolution is defined by
  , which is lower in the presence of these molecules (TODB and DODB) than it is in the uncontrolled HCl (1.0 M). A review of the results in Table 10 showed that the activation parameters
  and
and  of the MS dissolving reaction are higher in their absence than in their presence. The positive sign for the enthalpy value indicates that the process of dissolving steel is endothermic, which makes it challenging.62 As shown in Table 11, values for (
 ) increased in both tested media when the TODB and DODB were present relative to a free aggressive solution. Such fluctuation is connected to the phenomenon of inhibitor molecule ordering and disordering on the MS surface. According to the growing
  in the presence of the inhibitor, disordering is intensified as the reactant moves from the reactant to the activated complex. In other words, the catalyst for the adsorption of the inhibitor onto the MS surface is the rise in entropy that occurs throughout the adsorption process.63
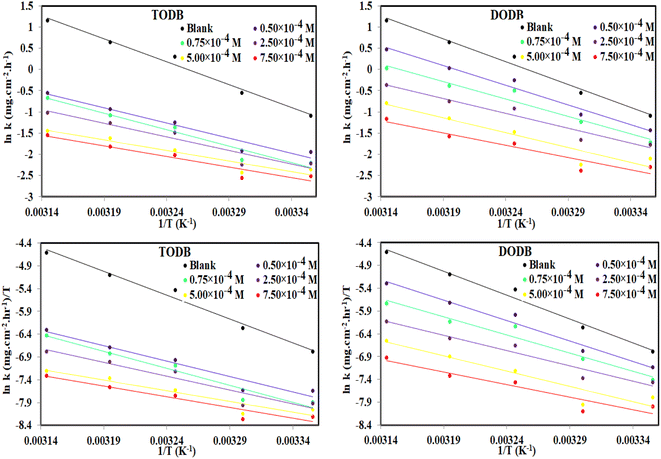 |
| | Fig. 10 Arrhenius and Transition state plots for MS dissolution with and without various dosages of synthesized inhibitors TODB and DODB in 1 M HCl solution. | |
Table 7 Activation parameter values for steel in 1.0 M HCl in the absence and presence of different concentrations of the TODB and DODB derivatives
| Inhibitor |
Conc., (M) |

kJ mol−1 |
ΔH* kJ mol−1 |
ΔS* J mol−1 K−1 |
| Blank |
0.00 × 10⁻⁴ |
89.76 |
87.20 |
38.86 |
| TODB |
0.50 × 10⁻⁴ |
59.20 |
56.64 |
−72.14 |
| 0.75 × 10⁻⁴ |
64.69 |
62.13 |
−55.70 |
| 2.50 × 10⁻⁴ |
53.32 |
50.76 |
−93.96 |
| 5.00 × 10⁻⁴ |
41.54 |
38.99 |
−134.75 |
| 7.50 × 10⁻⁴ |
41.73 |
39.17 |
−135.30 |
| DODB |
0.50 × 10⁻⁴ |
77.06 |
74.50 |
−6.91 |
| 0.75 × 10⁻⁴ |
68.42 |
65.86 |
−37.54 |
| 2.50 × 10⁻⁴ |
58.40 |
55.85 |
−72.86 |
| 5.00 × 10⁻⁴ |
58.33 |
55.77 |
−76.90 |
| 7.50 × 10⁻⁴ |
48.29 |
45.73 |
−111.86 |
3.5. ICPE test
The corrosion rate for the two synthetic inhibitors TODB and DODB was determined by quantifying the total iron ions for the MS after immersion for 24 hours in HCl corrosive medium (1.0 M) at various doses of prepared inhibitors (0.5, 0.75, 2.5, 5, and 7.5 × 10⁻⁴ M), as well as for the MS in the exact corrosive medium with no inhibitors. The total concentration of iron ions in solution for MS in HCl (1.0 M) without any inhibitor is 3104 ppm, and 468 ppm and 546 ppm for TODB and DODB at higher tested concentrations, respectively. By increasing the concentration of TODB and DODB, as demonstrated in Table 8, the effectiveness of inhibition increased.
Table 8 Determination of iron concentration (ppm) using ICPE in 1.0 M HCl without and with different concentrations of TODB and DODB derivatives at room temperature
| Inhibitor |
[Inhibitor] M |
Total iron ions in solution (ppm) |
CR mg cm−2 hr−1 |
θ |
ηICPE% |
| Blank |
— |
3104 |
3.685 |
— |
— |
| TODB |
0.50 × 10⁻⁴ |
792 |
0.940 |
0.7448 |
74.48 |
| 0.75 × 10⁻⁴ |
640 |
0.760 |
0.7938 |
79.38 |
| 2.50 × 10⁻⁴ |
600 |
0.712 |
0.8067 |
80.67 |
| 5.00 × 10⁻⁴ |
548 |
0.651 |
0.8235 |
82.35 |
| 7.50 × 10⁻⁴ |
468 |
0.556 |
0.8492 |
84.92 |
| DODB |
0.50 × 10⁻⁴ |
1540 |
1.828 |
0.5039 |
50.39 |
| 0.75 × 10⁻⁴ |
1442 |
1.712 |
0.5354 |
53.54 |
| 2.50 × 10⁻⁴ |
840 |
0.997 |
0.7294 |
72.94 |
| 5.00 × 10⁻⁴ |
670 |
0.795 |
0.7841 |
78.41 |
| 7.50 × 10⁻⁴ |
546 |
0.648 |
0.8241 |
82.41 |
3.6. UV-analysis
Metal and inhibitor molecule interactions were studied via UV-visible spectroscopy64 for steel in HCl (1.0 M) without and in the presence of 7.50 × 10⁻⁴ M of the investigated inhibitors (TODB and DODB) at 25 °C after immersion for 24 h, in addition to 7.50 × 10⁻⁴ M of inhibitors in HCl (1.0 M) prior to immersion of MS. The UV-visible absorption spectra were recorded and the results are shown in Fig. 11. Following a 24 hour immersion in HCl, a typical band for steel at 205 nm (1 molar) was obtained. The levels of absorbance were adjusted to 340 nm and 336 nm for TODB and DODB, respectively, when 7.50 × 10⁻⁴ M of the two tested inhibitors were immersed with MS in HCl (1.0 M) for 24 hours. Due to the creation of a protective covering from the TODB and DODB molecules on the MS surface, the variation in the absorption values can provide conclusive proof for interaction between the evaluated inhibitors and the steel surface.
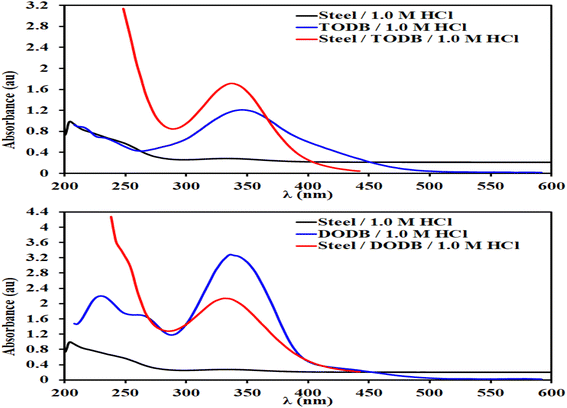 |
| | Fig. 11 UV-visible spectra of MS in HCl, inhibitor + HCl and MS + inhibitor + HCl at 25 °C after immersion for 24 h. | |
3.7. SEM and EDX spectroscopy
To evaluate whether the surface morphology was altered by employing a certain concentration of the TODB and DODB molecules, the MS surface was investigated using SEM. The steel was examined following a 24 hour immersion in HCl (1.0 M) both with and without the use of 7.5 × 10⁻⁴ M from TODB and DODB. Without any inhibitor, corrosion severely degraded the surface of the MS in HCl (1.0 M). When the MS surface was examined after employing the inhibitors, it was smooth and pit-free (Fig. 12). We can infer from the SEM results that when the inhibitors were used, a protective coating formed on the MS surface. The inhibition efficiency studies conducted using chemical and electrochemical methods demonstrate the protective nature of this film. Additional proof of the components adhering to the surface of MS following immersion in corrosive solution with and without inhibitors can be determined using the EDX technique. However, when the steel surface was analyzed for samples immersed with 7.5 × 10⁻⁴ M of the TODB and DODB inhibitor molecules, respectively, new signals for O, S, N, and C were detected with significant concentration (Table 9) due to the formation of a protective layer on the surface after using the inhibitors (Fig. 12). In the case of steel immersed in HCl (1.0 M) alone, only Fe and Cl can be detected. These findings strongly support the use of TODB and DODB as MS corrosion inhibitors in HCl.
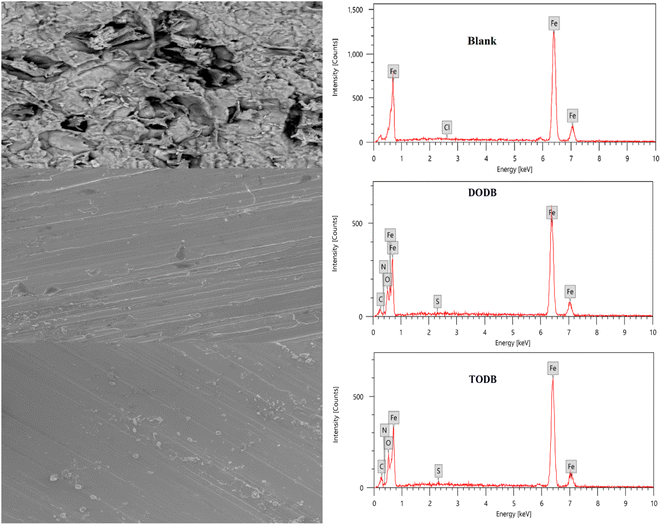 |
| | Fig. 12 SEM images and EDX spectra for MS surface after immersion in 1.0 M HCl for 24 h in the absence and presence of synthesized inhibitors TODB and DODB at 25 °C. | |
Table 9 Quantitative analysis for the MS surface after 24 hours immersion in 1.0 M HCl in the presence and absence of the prepared inhibitors (TODB and DODB) from EDX
| Element |
Blank (HCl–Fe) |
DODB–Fe |
TODB–Fe |
| Mass% |
Atom% |
Mass% |
Mass% |
Mass% |
Atom% |
| Cl |
0.06 |
0.10 |
— |
— |
— |
— |
| C |
— |
— |
4.09 |
13.49 |
6.45 |
20.06 |
| N |
— |
— |
1.16 |
3.27 |
0.46 |
1.23 |
| O |
— |
— |
9.06 |
22.44 |
9.68 |
22.62 |
| S |
— |
— |
0.07 |
0.09 |
0.55 |
0.64 |
| Fe |
99.94 |
99.90 |
85.61 |
60.71 |
82.86 |
55.45 |
| Total |
100 |
100 |
100 |
100 |
100 |
100 |
3.8. Biological activity
A sample solution containing Sulfate Reducing Bacteria (SRB) from one of the networks of fire hydrants on the Zohr Gas Field in Egypt was used for this test. The SRB BART vials were filled with 15 ml of this water, both with and without the addition of 1 ml of the tested inhibitors at a concentration of 1 ppm mol (TODB and DODB). For the entire test period of 11 days, the color to first black sign was monitored daily in order to estimate the matching population SRB reading shown in Table 10. The first black sign for the blank sample, which was not inhibited, appeared after 4 days of incubation with a population of roughly 27![[thin space (1/6-em)]](https://www.rsc.org/images/entities/char_2009.gif) 000 SRB cfu ml−1, and it is regarded as aggressive. When the tested inhibitors were used, the first black indication for DODB and TODB showed after 7 and 8 days, respectively. According to Table 10, the approximate SRB populations were 325 cfu ml−1 and 75 cfu ml−1 for DODB (considered moderate) and TODB (considered low), respectively. These findings suggest that SRB can reduce corrosion formation, indicating that the inhibitor compounds TODB and DODB have good biological activity against SRB.65
000 SRB cfu ml−1, and it is regarded as aggressive. When the tested inhibitors were used, the first black indication for DODB and TODB showed after 7 and 8 days, respectively. According to Table 10, the approximate SRB populations were 325 cfu ml−1 and 75 cfu ml−1 for DODB (considered moderate) and TODB (considered low), respectively. These findings suggest that SRB can reduce corrosion formation, indicating that the inhibitor compounds TODB and DODB have good biological activity against SRB.65
Table 10 Approximate SRB Population for tested inhibitors
| Inhibitor |
Days of reaction |
Approximate SRB Population (cfu ml−1) |
| Blank |
 |
27![[thin space (1/6-em)]](https://www.rsc.org/images/entities/char_2009.gif) 000 000 |
 |
| DODB |
 |
325 |
 |
| TODB |
 |
75 |
 |
3.9. Relation between quantum calculations and corrosion inhibition
Various theoretical quantum chemical parameters were calculated using different methods to investigate the adsorption behavior and interaction between MS and the synthesized inhibitors TODB and DODB, semi-empirical PM6, HF-631G, DFT/B3LYP/6-311+G and MP2-6-311G basis sets were applied.66,67 The resulting values for the different calculated parameters are summarized in Table 11. Fig. 13 also shows the optimized molecular structures, HOMO, LUMO and ESP obtained from the DFT calculations with the B3LYP/6-311+G basis set. The HOMO is typically used to show how well an organic molecule can transfer electrons. In general, the EHOMO value increases with the strength of a molecule's ability to donate electrons.68 From the summarized results in Table 11, the EHOMO values equal −9.1237, −8.8766, −6.7038 and −9.1057 eV for TODB, and also equal −9.4758, −8.8374, −6.8554 and −8.8807 eV for DODB using the semi-empirical PM6, HF-631G, DFT/B3LYP/6-311+G and MP2-6-311G basis sets, respectively. From these results, it is clear that TODB has higher EHOMO values than DODB via semi-empirical PM6 and DFT/B3LYP/6-311+G basis sets. As a result of this, it has the greatest ability to donate electrons to the MS surface, indicating that a protective film will be formed more readily with TODB than with DODB. It is known that the numerical number resulting from the difference between the LUMO and HOMO energies is called the energy gap, ΔE. As motioned in Table 11, TODB has the lowest ΔE values. As a result of this, it can deposit successfully on the mild steel surface more readily than DODB because the electrons located in the outer orbitals will be easier to donate.69 The ΔE values equal 7.2235, 9.0785, 3.1274 and 8.9139 eV for TODB, and 7.9966, 9.3270, 3.4741 and 9.0524 eV for DODB using the semi-empirical PM6, HF-631G, DFT/B3LYP/6-311+G and MP2-6-311G, respectively. In addition, the ionization potentials for TODB equal 9.123 and 6.703 eV, which are lower than the DODB values using the same basis sets semi-empirical PM6 and DFT/B3LYP/6-311+G, respectively. It is clear, from the resulting (IP) and (ΔE) values that TODB has the lowest values at the same calculated basis sets compared with DODB. Thus, TODB will have the higher ability to adsorb on the mild steel surface than the DODB inhibitor. Furthermore, the hardness (η) and softness (σ) related to each other and the lowest hardness compound have the highest softness value.70 From the mentioned results in Table 11, the softness (σ) values are equal to 0.2769, 0.2203, 0.6395 and 0.2244 eV−1 for TODB, and the DODB values are equal to 0.2501, 0.2144, 0.5757 and 0.2209 eV−1 using the semi-empirical PM6, HF-631G, DFT/B3LYP/6-311+G and MP2-6-311G basis sets, respectively. In addition, the hardness (η) results are equal to 3.611, 4.539, 1.563 and 4.457 eV for TODB, and the DODB values are equal to 3.998, 4.663, 1.737 and 4.526 eV using semi-empirical PM6, HF-631G, DFT/B3LYP/6-311+G and MP2-6-311G basis sets, respectively. From these mentioned values, TODB shows softness results higher than DODB and the opposite is detected for hardness. This indicates that the ability of TODB to protect the steel surface is greater than DODB. The transferred (ΔN) electrons give significant proof for the inhibition ability by electron donation from the inhibitor (Lewis base) to the surface of the metal (Lewis acid). From the resulting values in Table 11, the ability of TODB to donate electrons is higher than DODB, and the calculated values are 0.5947 and 0.5416 (e) using DFT/B3LYP/6-311+, respectively. As a result of this ΔN effect, a coordination bond is formed between the inhibitor and the (vacant d orbitals) metal surface.71–73 In addition, other parameters are shown in Table 11, including the electronegativity (χ), total negative charge (TNC), molecular volume (M. V.) and electrophilicity (ω). The theoretical values are in good agreement with the experimental values, and also suggest that TODB has higher inhibition ability than DODB.
Table 11 The calculated quantum chemical parameters using several optimization bases sets: semi empirical PM6, HF-631G, DFT-B3LYP/6-311G and MP2-6-311G
| OPT |
Molecule |
EHOMO |
ELUMO |
ΔE |
IP |
μ |
M. V. |
TNC |
σ |
ω |
χ |
η |
ΔN |
ηPDP |
| (eV) |
(eV) |
(eV) |
(eV) |
(D) |
(cm3 mol−1) |
(e) |
(eV−1) |
(eV) |
(eV) |
(eV) |
(e) |
(%) |
| Semi empirical-PM6 |
TODB |
−9.1237 |
−1.9002 |
7.2235 |
9.1237 |
2.8692 |
299.301 |
−6.7216 |
0.2769 |
4.2059 |
5.5119 |
3.611 |
0.2060 |
94.94 |
| DODB |
−9.4758 |
−1.4792 |
7.9966 |
9.4758 |
8.3631 |
412.278 |
−8.8698 |
0.2501 |
3.7520 |
5.4775 |
3.998 |
0.1904 |
93.58 |
| HF-631G |
TODB |
−8.8766 |
0.2019 |
9.0785 |
8.8766 |
6.4045 |
308.450 |
−7.4865 |
0.2203 |
2.0722 |
4.3374 |
4.539 |
0.2933 |
94.94 |
| DODB |
−8.8374 |
0.4895 |
9.3270 |
8.8374 |
8.2401 |
252.661 |
−8.2896 |
0.2144 |
1.8679 |
4.1740 |
4.663 |
0.3030 |
93.58 |
| DFT -B3LYP/6-311G |
TODB |
−6.7038 |
−3.5764 |
3.1274 |
6.703 |
5.0238 |
280.103 |
−5.498 |
0.6395 |
8.4481 |
5.1401 |
1.563 |
0.5947 |
94.94 |
| DODB |
−6.8554 |
−3.3813 |
3.4741 |
6.855 |
7.3262 |
330.502 |
−6.536 |
0.5757 |
7.5408 |
5.1183 |
1.737 |
0.5416 |
93.58 |
| MP2-6-311G |
TODB |
−9.1057 |
−0.1918 |
8.9139 |
9.1057 |
4.4017 |
240.277 |
−6.5932 |
0.2244 |
2.4244 |
4.6488 |
4.457 |
0.2638 |
94.94 |
| DODB |
−8.8807 |
0.1717 |
9.0524 |
8.8807 |
9.7925 |
296.3680 |
−7.6450 |
0.2209 |
2.0947 |
4.3545 |
4.526 |
0.2922 |
93.58 |
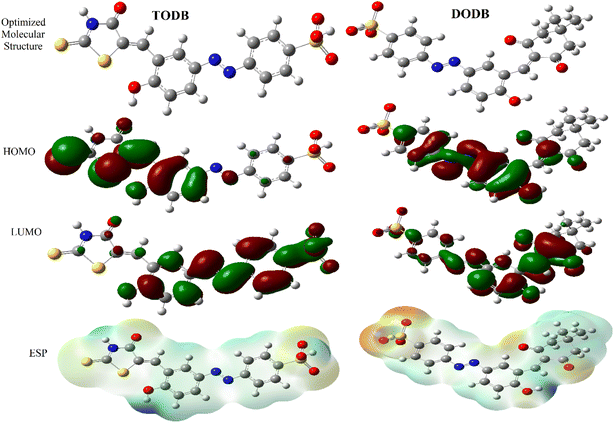 |
| | Fig. 13 Optimized structures, HOMO, LUMO and ESP for synthesized inhibitors TODB and DODB using DFT/B3LYP/6-311 + G. | |
3.10. Monte Carlo simulations
The adsorption of the two inhibitor molecules (either neutral TODB and DODB, or protonated TODB-H+ and DODB-H+) was simulated in vacuum and aqueous phases. Fig. 14 depicts the most stable configurations of TODB-H+ and DODB-H+ on the Fe (110) surface in the aqueous conditions. Table 12 shows the final result output descriptors of the MC simulation for the adsorption process in both vacuum and aqueous phases. The inhibitor molecules were clearly adsorbed on the Fe surface in a parallel adsorption arrangement, which guaranteed maximum surface coverage and optimum protection from corrosive particles. All adsorption energies are negative values, indicating spontaneous and stable adsorption. This finding might be related to the electron contributions from oxygen, nitrogen, sulfur, lone pairs and π electrons to the vacant d-orbitals of Fe (110), resulting in the formation of a protective coating on the metal surface. The Eads values show that TODB is superior to the DODB molecule, which is in agreement with the DFT and the experimental findings. This can be attributed to the stronger electron-donating effect of the extra C![[double bond, length as m-dash]](https://www.rsc.org/images/entities/char_e001.gif) S, S and N–H groups in the TODB molecule, which promotes stronger adsorption on Fe (110), as compared to the (C
S, S and N–H groups in the TODB molecule, which promotes stronger adsorption on Fe (110), as compared to the (C![[double bond, length as m-dash]](https://www.rsc.org/images/entities/char_e001.gif) O) and methoxy groups in DODB.
O) and methoxy groups in DODB.
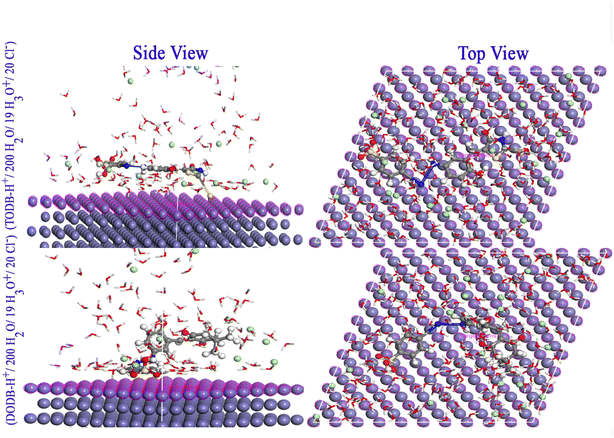 |
| | Fig. 14 Monte Carlo simulations for the most favorable modes of adsorption obtained for TODB-H+ and DODB-H+ on Fe (1 1 0) surface, side and top view. | |
Table 12 The outputs and descriptors calculated by the Monte Carlo simulations for adsorption of TODB and DODB on Fe (110) (in kcal mol−1)
| Phase |
Inhibitor |
Total energy (kcal mol−1) |
Adsorption energy (kcal mol−1) |
Rigid adsorption energy (kcal mol−1) |
Deformation energy (kcal mol−1) |
(dEads/dNi) (kcal mol−1) |
Binding energy (kcal mol−1) |
ηPDP (%) |
| Gas phase |
TODB |
−267.348 |
−3647.916 |
−217.758 |
−3430.157 |
−3647.916 |
3647.916 |
94.94 |
| DODB |
−314.846 |
−3025.009 |
−219.216 |
−2805.793 |
−3025.009 |
3025.009 |
93.58 |
| TODB–H+ |
−279.357 |
−1839.355 |
−217.128 |
−1622.226 |
−1839.355 |
1839.355 |
94.94 |
| DODN-H+ |
−344.996 |
−1567.746 |
−223.388 |
−1344.358 |
−1567.746 |
1567.746 |
93.58 |
| Aqueous phase |
TODB |
- 6089.077 |
- 9629.112 |
−6183.978 |
−3445.134 |
−3534.668 |
3534.668 |
94.94 |
| DODB |
−6187.867 |
−9057.498 |
−6231.939 |
−2825.560 |
−2962.374 |
2962.374 |
93.58 |
| TODB–H+ |
−6129.486 |
−7854.973 |
−6215.992 |
−1638.982 |
−1869.789 |
1869.789 |
94.94 |
| DODB-H+ |
−6115.986 |
−7504.225 |
−6129.681 |
−1374.544 |
−1508.008 |
1508.008 |
93.58 |
4. Conclusions
From our theoretical and experimental obtained values, the following conclusions can be made:
1. Two novels azo arylidene derivatives were synthesized and characterized.
2. By increasing the temperature and the inhibitor concentration, the inhibition efficiency increases.
3. The PDP curves indicate that these derivatives behave as mixed type inhibitors.
4. The adsorption of these derivatives on the MS surface is a mixed one, i.e., physical and chemical, and obeyed the Langmuir model.
5. UV, SEM and EDX measurements supported the formation of a preventive film from the inhibitors on the MS surface.
6. Gravimetric, ICPE, electrochemical measurements and theoretical quantum calculations are in agreement.
7. The bio-corrosion related to the presence of SRB can be controlled by the current azo arylidene derivatives.
Conflicts of interest
The authors declare that they have no known competing financial interests or personal relationships that could have appeared to influence the work reported in this paper.
Acknowledgements
The authors extend their appreciation to the Deanship for Research & Innovation, Ministry of Education in Saudi Arabia for funding this research work through the project Number: IFP22UQU4320745DSR221.
References
- X. Su, Int. J. Electrochem. Sci., 2016, 4828–4839 CrossRef CAS.
- A. Gangan, M. ElSabbagh, M. Bedair, M. El-Sabbah and A. Fahmy, Al-Azhar Bull. Sci., 2020, 31, 51–58 CrossRef.
- A. Berisha, F. Podvorica, V. Mehmeti, F. Syla and D. Vataj, Maced. J. Chem. Chem. Eng., 2015, 34, 287 CrossRef CAS.
- Q. A. Yousif, M. N. Majeed and M. A. Bedair, RSC Adv., 2022, 12, 33725–33736 RSC.
- P. Balan, M. J. Shelton, D. O. L. Ching, G. C. Han and L. K. Palniandy, Procedia Mater. Sci., 2014, 6, 244–248 CrossRef CAS.
- A. Fahmy, M. El Sabbagh, M. Bedair, A. Gangan, M. El-Sabbah, S. M. El-Bahy and J. F. Friedrich, J. Adhes. Sci. Technol., 2021, 35, 1734–1751 CrossRef CAS.
- M. Kosian, M. M. J. Smulders and H. Zuilhof, Langmuir, 2016, 32, 1047–1057 CrossRef CAS PubMed.
- F. I. Podvorica, C. Combellas, M. Delamar, F. Kanoufi and J. Pinson, in Passivation of Metals and Semiconductors, and Properties of Thin Oxide Layers, Elsevier, 2006, pp. 697–702 Search PubMed.
- A. Adenier, M.-C. Bernard, M. M. Chehimi, E. Cabet-Deliry, B. Desbat, O. Fagebaume, J. Pinson and F. Podvorica, J. Am. Chem. Soc., 2001, 123, 4541–4549 CrossRef CAS PubMed.
- S. S. Alarfaji, I. H. Ali, M. Z. Bani-Fwaz and M. A. Bedair, Molecules, 2021, 26, 3183 CrossRef CAS PubMed.
- M. M. Abdelsalam, M. A. Bedair, A. M. Hassan, B. H. Heakal, A. Younis, Z. I. Elbialy, M. A. Badawy, H. E.-D. Fawzy and S. A. Fareed, Arabian J. Chem., 2022, 15, 103491 CrossRef CAS.
- M. A. Abbas, M. A. Bedair, O. E. El-Azabawy and E. S. Gad, ACS Omega, 2021, 6, 15089–15102 CrossRef CAS PubMed.
- M. A. Bedair, A. M. Abuelela, W. M. Zoghaib and T. A. Mohamed, J. Mol. Struct., 2021, 1244, 130927 CrossRef CAS.
- A. Chetouani, A. Aouniti, B. Hammouti, N. Benchat, T. Benhadda and S. Kertit, Corros. Sci., 2003, 45, 1675–1684 CrossRef CAS.
- R. Haldhar, S.-C. Kim, D. Prasad, M. A. Bedair, I. Bahadur, S. Kaya, O. Dagdag and L. Guo, J. Mol. Struct., 2021, 1242, 130822 CrossRef CAS.
- R. I. Alsantali, Q. A. Raja, A. Y. A. Alzahrani, A. Sadiq, N. Naeem, E. U. Mughal, M. M. Al-Rooqi, N. El Guesmi, Z. Moussa and S. A. Ahmed, Dyes Pigm., 2022, 199, 110050 CrossRef CAS.
- M. A. Gebril, M. A. Bedair, S. A. Soliman, M. F. Bakr and M. B. I. Mohamed, J. Mol. Liq., 2022, 349, 118445 CrossRef CAS.
- M. A. Bedair, M. M. B. El-Sabbah, A. S. Fouda and H. M. Elaryian, Corros. Sci., 2017, 128, 54–72 CrossRef CAS.
- M. A. Bedair, J. Mol. Liq., 2016, 219, 128–141 CrossRef CAS.
- M. M. Elsenety, B. A. Elsayed, I. A. Ibrahem and M. A. Bedair, Inorg. Chem. Commun., 2020, 121, 108213 CrossRef CAS.
- M. A. Abbas, E. I. Arafa, E. S. Gad, M. A. Bedair, O. E. El-Azabawy and H. I. Al-Shafey, Inorg. Chem. Commun., 2022, 143, 109758 CrossRef CAS.
- M. M. Abdou, O. Younis and E. E. El-Katori, J. Mol. Liq., 2022, 360, 119506 CrossRef CAS.
- A. Singh, K. R. Ansari, M. A. Quraishi, H. Lgaz and Y. Lin, J. Alloys Compd., 2018, 762, 347–362 CrossRef CAS.
- M. Bedair, M. Metwally, S. Soliman, A. Al-Sabagh, A. Salem and T. Mohamed, Al-Azhar Bull. Sci., 2015, 26, 1–14 CrossRef.
- A. Hassan, B. Heakal, A. Younis, M. Bedair, Z. El-Billy and M. Mohamed, Egypt. J. Chem., 2019, 62(9), 1603–1624 Search PubMed.
- M. N. Majeed, Q. A. Yousif and M. A. Bedair, ACS Omega, 2022, 7, 29850–29857 CrossRef CAS PubMed.
- A. Gangan, M. ElSabbagh, M. A. Bedair, H. M. Ahmed, M. El-Sabbah, S. M. El-Bahy and A. Fahmy, Arabian J. Chem., 2021, 14, 103391 CrossRef CAS.
- A. M. Ashmawy, R. Said, I. A. Naguib, B. Yao and M. A. Bedair, ACS Omega, 2022, 7, 17849–17860 CrossRef CAS PubMed.
- S. Leleu, B. Rives, N. Causse and N. Pébère, J. Magnesium Alloys, 2019, 7, 47–57 CrossRef CAS.
- W. Zhang, B. Nie, M. Wang, S. Shi, L. Gong, W. Gong, H. Pang, X. Liu, B. Li, Y. Feng and Y.-C. Wu, J. Mol. Liq., 2021, 343, 117672 CrossRef CAS.
- H. M. Elaryian, M. A. Bedair, A. H. Bedair, R. M. Aboushahba and A. E.-A. S. Fouda, J. Mol. Liq., 2022, 346, 118310 CrossRef CAS.
- J. Foresman, Lancet, 1973, 2, 139–141 Search PubMed.
- L. Pauling, The Nature of the Chemical Bond: An Introduction to Modern Structural Chemistry, Cornell University Press, 3rd edn, 1960 Search PubMed.
- P. Senet, Chem. Phys. Lett., 1997, 275, 527–532 CrossRef CAS.
- R. G. Parr, L. v. Szentpály and S. Liu, J. Am. Chem. Soc., 1999, 121, 1922–1924 CrossRef CAS.
- M. V. Fiori-Bimbi, P. E. Alvarez, H. Vaca and C. A. Gervasi, Corros. Sci., 2015, 92, 192–199 CrossRef CAS.
- S. Tamil Selvi, V. Raman and N. Rajendran, J. Appl. Electrochem., 2003, 33, 1175–1182 CrossRef CAS.
- M. M. El-Naggar, Corros. Sci., 2007, 49, 2226–2236 CrossRef CAS.
- İ. Dehri and M. Özcan, Mater. Chem. Phys., 2006, 98, 316–323 CrossRef.
- A. S. Fouda, A. H. El-Azaly, R. S. Awad and A. M. Ahmed, Int. J. Electrochem. Sci., 2014, 9, 1117–1131 Search PubMed.
- E. M. Mabrouk, S. Eid and M. M. Attia, J. Basic Environ. Sci., 2017, 4, 351–355 Search PubMed.
- A. Fawzy and A. Toghan, ACS Omega, 2021, 6, 4051–4061 CrossRef CAS PubMed.
- M. A. Bedair, E. H. Alosaimi and S. Melhi, J. Adhes. Sci. Technol., 2021, 1–31 CrossRef.
- R. K. Mehta, S. K. Gupta and M. Yadav, J. Environ. Chem. Eng., 2022, 10, 108499 CrossRef CAS.
- A. Singh, V. K. Singh and M. A. Quraishi, Arabian J. Sci. Eng., 2013, 38, 85–97 CrossRef CAS.
- M. A. Mostafa, A. M. Ashmawy, M. A. M. A. Reheim, M. A. Bedair and A. M. Abuelela, J. Mol. Struct., 2021, 1236, 130292 CrossRef CAS.
- K. Zakaria, M. A. Abbas and M. A. Bedair, J. Mol. Liq., 2022, 352, 118689 CrossRef CAS.
- K. Palanisamy, P. Kannan and A. Sekar, Surf. Interfaces, 2018, 12, 50–60 CrossRef CAS.
- X. Ma, J. Wang, J. Xu, J. Jing, J. Li, H. Zhu, S. Yu and Z. Hu, ACS Omega, 2019, 4, 21148–21160 CrossRef CAS PubMed.
- M. A. Abbas and M. A. Bedair, Z. Phys. Chem., 2019, 233, 225–254 CrossRef CAS.
- S. Y. Sayed, M. S. El-Deab, B. E. El-Anadouli and B. G. Ateya, J. Phys. Chem. B, 2003, 107, 5575–5585 CrossRef CAS.
- M. A. Bedair, A. S. Fouda, M. A. Ismail and A. Mostafa, Ionics, 2019, 25, 2913–2933 CrossRef CAS.
- M. A. Bedair, S. A. Soliman, M. F. Bakr, E. S. Gad, H. Lgaz, I.-M. Chung, M. Salama and F. Z. Alqahtany, J. Mol. Liq., 2020, 317, 114015 CrossRef CAS.
- A. K. N. R. John and O. ’M. Bockris, Modern Electrochemistry 1, Springer, New York, NY, Boston, 1970 Search PubMed.
- M. M. B. El-Sabbah, M. A. Bedair, M. A. Abbas, A. Fahmy, S. Hassaballa and A. A. Moustafa, Z. Phys. Chem., 2019, 233, 627–649 CrossRef CAS.
- Q. Wang, L. Liu, Q. Zhang, X. Wu, H. Zheng, P. Gao, G. Zeng, Z. Yan, Y. Sun, Z. Li and X. Li, Sustainable Chem. Pharm., 2022, 27, 100710 CrossRef CAS.
- M. A. Bedair, S. A. Soliman, M. A. Hegazy, I. B. Obot and A. S. Ahmed, J. Adhes. Sci. Technol., 2019, 33, 1139–1168 CrossRef CAS.
- K. Azgaou, M. Damej, S. El Hajjaji, N. K. Sebbar, H. Elmsellem, B. El Ibrahimi and M. Benmessaoud, J. Mol. Struct., 2022, 1266, 133451 CrossRef CAS.
- A. M. Abuelela, M. A. Bedair, W. M. Zoghaib, L. D. Wilson and T. A. Mohamed, J. Mol. Struct., 2021, 1230, 129647 CrossRef CAS.
- M. A. Amin, M. A. Ahmed, H. A. Arida, T. Arslan, M. Saracoglu and F. Kandemirli, Corros. Sci., 2011, 53, 540–548 CrossRef CAS.
- M. A. Bedair, S. A. Soliman and M. S. Metwally, J. Ind. Eng. Chem., 2016, 41, 10–22 CrossRef CAS.
- A. H. Ahmed, E.-S. M. Sherif, H. S. Abdo and E. S. Gad, ACS Omega, 2021, 6, 14525–14532 CrossRef CAS PubMed.
- E. A. Badr, M. A. Bedair and S. M. Shaban, Mater. Chem. Phys., 2018, 219, 444–460 CrossRef CAS.
- M. Yadav, S. Kumar, N. Tiwari, I. Bahadur and E. E. Ebenso, J. Mol. Liq., 2015, 212, 151–167 CrossRef CAS.
- H. M. Elaryian, M. A. Bedair, A. H. Bedair, R. M. Aboushahba and A. E.-A. S. Fouda, RSC Adv., 2022, 12, 29350–29374 RSC.
- M. M. Khalaf, A. H. Tantawy, K. A. Soliman and H. M. Abd El-Lateef, J. Mol. Struct., 2020, 1203, 127442 CrossRef CAS.
- S. A. Soliman, M. S. Metwally, S. R. Selim, M. A. Bedair and M. A. Abbas, J. Ind. Eng. Chem., 2014, 20, 4311–4320 CrossRef CAS.
- S. Melhi, M. A. Bedair, E. H. Alosaimi, A. A. O. Younes, W. H. El-Shwiniy and A. M. Abuelela, RSC Adv., 2022, 12, 32488–32507 RSC.
- Y. Y. Li, Z. N. Jiang, X. Wang, X. Q. Zeng, C. F. Dong, H. F. Liu and G. A. Zhang, Corros. Sci., 2022, 110695 CrossRef CAS.
- Ö. Uğuz, M. Gümüş, Y. Sert, İ. Koca and A. Koca, J. Mol. Struct., 2022, 1262, 133025 CrossRef.
- M. K. Awad, M. S. Metwally, S. A. Soliman, A. A. El-Zomrawy and M. A. Bedair, J. Ind. Eng. Chem., 2014, 20, 796–808 CrossRef CAS.
- W. Zhang, H.-J. Li, M. Wang, L.-J. Wang, F. Shang and Y.-C. Wu, J. Phys. Chem. C, 2018, 122, 25349–25364 CrossRef CAS.
- P. Preethi Kumari, P. Shetty and S. A. Rao, Arabian J. Chem., 2017, 10, 653–663 CrossRef CAS.
|
| This journal is © The Royal Society of Chemistry 2023 |
Click here to see how this site uses Cookies. View our privacy policy here.  Open Access Article
 *ab,
Hani M. Elaryian
 ac,
Ehab S. Gadda,
Mubark Alshareef
 *e,
Ahmed H. Bedaira,
Rabab M. Aboushahbaf and
Abd El-Aziz S. Fouda*g


![[double bond, length as m-dash]](https://www.rsc.org/images/entities/char_e001.gif) N). The band at 1688.74 cm−1 is attributed to the stretching vibration of (C
N). The band at 1688.74 cm−1 is attributed to the stretching vibration of (C![[double bond, length as m-dash]](https://www.rsc.org/images/entities/char_e001.gif) O). The band at 1620.01 cm−1 is attributed to the stretching vibration of ν (C
O). The band at 1620.01 cm−1 is attributed to the stretching vibration of ν (C![[double bond, length as m-dash]](https://www.rsc.org/images/entities/char_e001.gif) C) arylidene group and overlapped with (C
C) arylidene group and overlapped with (C![[double bond, length as m-dash]](https://www.rsc.org/images/entities/char_e001.gif) O) at 1688.74 cm−1. The band at 1030.84 cm−1 is attributed to the stretching vibration of (C
O) at 1688.74 cm−1. The band at 1030.84 cm−1 is attributed to the stretching vibration of (C![[double bond, length as m-dash]](https://www.rsc.org/images/entities/char_e001.gif) S). Finally, the band at 3404.59 cm−1 is attributed to the (Phenolic OH, SO3H) groups.
S). Finally, the band at 3404.59 cm−1 is attributed to the (Phenolic OH, SO3H) groups.
![[double bond, length as m-dash]](https://www.rsc.org/images/entities/char_e001.gif) O) ketone. The band at 1457.45 cm−1 is attributed to the stretching vibration of the azo group (N
O) ketone. The band at 1457.45 cm−1 is attributed to the stretching vibration of the azo group (N![[double bond, length as m-dash]](https://www.rsc.org/images/entities/char_e001.gif) N). The band at 1683.41 cm−1 is attributed to the stretching vibration of ν (C
N). The band at 1683.41 cm−1 is attributed to the stretching vibration of ν (C![[double bond, length as m-dash]](https://www.rsc.org/images/entities/char_e001.gif) C) arylidene group and overlapped with (C
C) arylidene group and overlapped with (C![[double bond, length as m-dash]](https://www.rsc.org/images/entities/char_e001.gif) O) at 1637.73 cm−1. Finally, the band at 3448.31 cm−1 is attributed to (Phenolic OH, SO3H) groups.
O) at 1637.73 cm−1. Finally, the band at 3448.31 cm−1 is attributed to (Phenolic OH, SO3H) groups.![[double bond, length as m-dash]](https://www.rsc.org/images/entities/char_e001.gif) O
O![[double bond, length as m-dash]](https://www.rsc.org/images/entities/char_e001.gif) N
N![[double bond, length as m-dash]](https://www.rsc.org/images/entities/char_e001.gif) S
S![[double bond, length as m-dash]](https://www.rsc.org/images/entities/char_e001.gif) C) (Arylidene), 1.91 ppm (1H, s, Phenolic OH), δ = 10.37 ppm (SO3H)), δ = 7.9–8.20 ppm (7H, multiplet, Ar–H). 1HNMR for DODB is 400 MHz; at: δ = 7.18, 7.15 (1H, d, J = 12 Hz, HC
C) (Arylidene), 1.91 ppm (1H, s, Phenolic OH), δ = 10.37 ppm (SO3H)), δ = 7.9–8.20 ppm (7H, multiplet, Ar–H). 1HNMR for DODB is 400 MHz; at: δ = 7.18, 7.15 (1H, d, J = 12 Hz, HC![[double bond, length as m-dash]](https://www.rsc.org/images/entities/char_e001.gif) C) (Arylidene), δ = 1.91 ppm (Phenolic OH), δ = 10.39 ppm (SO3H), δ = 7.86–7.78 ppm (7H, multiplet, Ar–H), δ = 5.17 ppm ((1H,s, –OH
C) (Arylidene), δ = 1.91 ppm (Phenolic OH), δ = 10.39 ppm (SO3H), δ = 7.86–7.78 ppm (7H, multiplet, Ar–H), δ = 5.17 ppm ((1H,s, –OH![[double bond, length as m-dash]](https://www.rsc.org/images/entities/char_e001.gif) CH–(CH3)2), δ = 0.89, 1.0 ppm ((CH3)2).
CH–(CH3)2), δ = 0.89, 1.0 ppm ((CH3)2).


 ):57
):57
 is negative implies that the tested molecules (TODB and DODB) adsorb spontaneously on the surface of MS. Furthermore, higher Kads values indicate a strong adsorption property, and as a result, a better inhibition property.58 In general, absolute values of
  of (−20 kJ mol−1) or less indicate electrostatic interaction (i.e., physisorption). Values around −40 kJ mol−1 or more negative values, on the other hand, indicate charge sharing and bond formation (chemisorption),59 although there is little difference between the
  values (between −20 and −40 kJ mol−1). This shows that TODB and DODB are physically and chemically adsorbed on the surface of MS, with physical adsorption having a particularly strong adsorption effect.60 It also appeared from Table 6 that the Kads values of TODB molecules are higher than that of DODB, which can be interpreted as the inhibition of TODB < DODB.
 obtained by using data from WL measurements
![[thin space (1/6-em)]](https://www.rsc.org/images/entities/char_2009.gif) θ = log
θ = log![[thin space (1/6-em)]](https://www.rsc.org/images/entities/char_2009.gif) K + 1/n
K + 1/n![[thin space (1/6-em)]](https://www.rsc.org/images/entities/char_2009.gif) log
log![[thin space (1/6-em)]](https://www.rsc.org/images/entities/char_2009.gif) C
C
![[thin space (1/6-em)]](https://www.rsc.org/images/entities/char_2009.gif) 404
404![[thin space (1/6-em)]](https://www.rsc.org/images/entities/char_2009.gif) 575
575![[thin space (1/6-em)]](https://www.rsc.org/images/entities/char_2009.gif) 878
878![[thin space (1/6-em)]](https://www.rsc.org/images/entities/char_2009.gif) 240
240![[thin space (1/6-em)]](https://www.rsc.org/images/entities/char_2009.gif) 909
909![[thin space (1/6-em)]](https://www.rsc.org/images/entities/char_2009.gif) 951
951![[thin space (1/6-em)]](https://www.rsc.org/images/entities/char_2009.gif) 864
864![[thin space (1/6-em)]](https://www.rsc.org/images/entities/char_2009.gif) 377
377![[thin space (1/6-em)]](https://www.rsc.org/images/entities/char_2009.gif) 265
265


![[thin space (1/6-em)]](https://www.rsc.org/images/entities/char_2009.gif) exp(−Ea/RT)
exp(−Ea/RT)

 and
and  are the apparent entropy of activation and enthalpy of activation, respectively, and h and N are Planck's constant and Avogadro's number, respectively. In the case of heterogeneous chemical reactions, the constant A is known as the pre-exponential factor because it is related to the number of active centers. For MS in HCl (1.0 M) solutions containing different molarities of the two investigated inhibitors in the temperature range of 298 K to 318 K, the Arrhenius and transition state plots were constructed using chemical and electrochemical measurements. The Arrhenius and transition state plots of MS in HCl (1.0 M) solution without and with different molarities (0.50 × 10⁻⁴ to 7.50 × 10⁻⁴ M) are shown in Fig. 10. Table 7 shows the values of the thermodynamic activation functions calculated from these plots as a function of the inhibitor concentration. The rise in inhibition efficiency values with increasing temperature (see Table 2), and the gradual decrease in
  with increasing molar concentration of the inhibitor (Table 7) can be explained on the basis of chemical adsorption. According to Amin et al.,60 it is clear from the data in Table 6 that the process of MS dissolution is defined by
  , which is lower in the presence of these molecules (TODB and DODB) than it is in the uncontrolled HCl (1.0 M). A review of the results in Table 10 showed that the activation parameters
  and
and  of the MS dissolving reaction are higher in their absence than in their presence. The positive sign for the enthalpy value indicates that the process of dissolving steel is endothermic, which makes it challenging.62 As shown in Table 11, values for (
 ) increased in both tested media when the TODB and DODB were present relative to a free aggressive solution. Such fluctuation is connected to the phenomenon of inhibitor molecule ordering and disordering on the MS surface. According to the growing
  in the presence of the inhibitor, disordering is intensified as the reactant moves from the reactant to the activated complex. In other words, the catalyst for the adsorption of the inhibitor onto the MS surface is the rise in entropy that occurs throughout the adsorption process.63


![[thin space (1/6-em)]](https://www.rsc.org/images/entities/char_2009.gif) 000 SRB cfu ml−1, and it is regarded as aggressive. When the tested inhibitors were used, the first black indication for DODB and TODB showed after 7 and 8 days, respectively. According to Table 10, the approximate SRB populations were 325 cfu ml−1 and 75 cfu ml−1 for DODB (considered moderate) and TODB (considered low), respectively. These findings suggest that SRB can reduce corrosion formation, indicating that the inhibitor compounds TODB and DODB have good biological activity against SRB.65
000 SRB cfu ml−1, and it is regarded as aggressive. When the tested inhibitors were used, the first black indication for DODB and TODB showed after 7 and 8 days, respectively. According to Table 10, the approximate SRB populations were 325 cfu ml−1 and 75 cfu ml−1 for DODB (considered moderate) and TODB (considered low), respectively. These findings suggest that SRB can reduce corrosion formation, indicating that the inhibitor compounds TODB and DODB have good biological activity against SRB.65

![[double bond, length as m-dash]](https://www.rsc.org/images/entities/char_e001.gif) S, S and N–H groups in the TODB molecule, which promotes stronger adsorption on Fe (110), as compared to the (C
S, S and N–H groups in the TODB molecule, which promotes stronger adsorption on Fe (110), as compared to the (C![[double bond, length as m-dash]](https://www.rsc.org/images/entities/char_e001.gif) O) and methoxy groups in DODB.
O) and methoxy groups in DODB.


