 Open Access Article
Catalytic ozonation of sulfamethoxazole using low-cost natural silicate ore supported Fe2O3: influencing factors, reaction mechanisms and degradation pathways†
Lisha Luo ab,
Zhiyu Sunb,
Yuxi Chena,
Hui Zhangb,
Yinkun Sunb,
Dongwei Lu
 *b and
Jun Ma
 b
b
aJilin Institute of Chemical Technology, Jilin 130022, P. R. China
bState Key Laboratory of Urban Water Resource and Environment, Harbin Institute of Technology, Harbin 150090, PR China. E-mail: lvdongwei@hit.edu.cn
First published on 11th January 2023
Abstract
A low-cost natural silicate ore supported Fe2O3 (FeSO) was synthesized for catalytic ozonation of sulfamethoxazole (SMX). XRD, SEM-EDS, BET, FTIR and XPS results of the FeSO catalyst confirmed that the natural silicate ore was successfully modified with iron oxide. The effects of key factors, such as catalyst dosage, initial solution pH, reaction temperature, inorganic anions and initial concentration, on ozonation degradation were systemically investigated. The degradation rate of SMX (20 mg L−1) was 88.1% after 30 min, compared with only 35.1% SMX degradation rate in the absence of the catalyst, and the total organic carbon (TOC) removal reached 49.1% after 60 min. Reaction mechanisms revealed that surface hydroxyl groups of FeSO were a critical factor for hydroxyl radical (˙OH) production leading to fast SMX degradation in the ozone decomposition process. The degradation products were detected, and the possible pathways of SMX were then proposed. This study provides guidance for preparing a low-cost catalyst and analyzing the degradation products and pathways of SMX in the ozonation process, which is of significance in practical industrial applications.
1. Introduction
Sulfamethoxazole (SMX) is a synthetic antimicrobial that is used worldwide as a medicine for the prevention and treatment of infections, as well as in feed additives.1 The frequent detection of SMX in natural aquatic environments has prompted growing public concern due to its potential risks to the ecosystem and humans, even at trace concentrations.2 SMX has been repeatedly detected at concentrations as high as 24.8 μg L−1 in wastewater treatment plant (WWTP) secondary effluent and 940 ng L−1 in surface water.3 Moreover, the traditional sewage biological treatment technology (STP) cannot effectively remove sulfonamide antibiotics due to its poor biodegradability.4 These pollutants can end up in the receiving waters and even in drinking water.5 The discharge standard of SMX for mariculture wastewater is lower than 0.02 μg L−1 (DB 21/T 2428-2015). Therefore, it is of great significance to exploit effective technologies to degrade SMX in aqueous solution.Advanced Oxidation Process (AOPs) is based on the generation of highly active species, such as hydroxyl radical (˙OH, redox potential = 2.80 V), which can rapidly remove the organic pollutants in water. Currently, it has been successfully applied to remove SMX.6–10 Typical advanced oxidation technologies include wet catalytic oxidation,7 electrochemical oxidation,8 photocatalytic oxidation9 and Fenton methods,10 as well as rapidly developing ozone catalytic technologies.11 The residual problem of H2O2, the solid–liquid separation problem of nano photocatalyst, the cost and practicability of UV lamp have seriously affected the application of AOPs in the actual wastewater treatment process. Ozone as a kind of strong oxidizer (2.07 V) has the powerful oxidation ability for the organic pollutants. It can degrade the organic pollutants by two pathways of the direct oxidation by ozone molecules and indirect oxidation of the reactive oxygen species generated by ozone during organics decomposition process.12 Compared to homogeneous catalytic ozonization, the solid catalyst of heterogeneous catalytic ozonization can adsorb organics on the catalyst surface to accelerate the subsequent reaction between pollutant and ozone. This process can improve the utilization rate of ozone and enhance decomposition of ozone to product more hydroxyl radicals.7 Moreover, the solid catalysts for heterogeneous catalytic ozonization are easily separated from aqueous and reused, and thus have overall lower-cost.13,14
Several types of catalysts have been widely used such as metal oxides (TiO2, CeO2 and Fe2O3), natural and artificial minerals (zeolites and honeycomb), carbonaceous matters (carbon nanotubes and activated carbon) and metal supported compounds (metal supported minerals or metal oxides) for catalytic ozonation application.15–17 Recently, Fe-based metal oxidation catalysts have received more attention due to the high oxygen storage capacity, easy synthesis and non-toxic and abundant in nature.18 In addition, some porous materials of carbon based material, molecular sieve, honeycomb ceramics have been used as supporters in order to improve the stability or the specific surface area of catalysts.19–21 Compared to the artificial materials, the natural silicate ore is relatively cheap, innocuous, eco-friendly and more accessible, thus an ideal support for Fe-based metal oxidation catalysts.22–25 Moreover, it has the advantages of developed pore structure, high specific surface area and perfect reusability according to our previous work.7,26 Overall, natural silicate ore supported Fe2O3 (FeSO) could be a low-cost and efficient catalyst. However, the catalytic performance of the iron modified silicate ore (FeSO) in ozonation process of SMX has not been reported, and its influencing factors, catalytic mechanisms and degradation pathways still remain unrevealed.
In this work, natural silicate ore supported Fe2O3 (FeSO) has been successfully synthesized for catalytic ozonation of SMX as the model refractory micropollutant. The key factors during catalytic process and catalyst stability were investigated in the catalytic ozonation system. Moreover, the degradation intermediates were detected and the possible pathways of SMX were proposed for better guiding the real application of the catalytic ozonation of FeSO system.
2. Materials and methods
2.1 Materials and instruments
Silicate ore were obtained from Heilongjiang province. Fe(NO3)3·9H2O and tert-butyl alcohol (TBA) were purchased from Sinopharm Chemical Reagent Co. Ltd (Shanghai, China). SMX was purchased from Tokyo Chemical Industry Co., Ltd (Tokyo, Japan). Sodium hydroxide, sodium hydrogen sulfite, sodium bicarbonate, sodium phosphate, benzoic acid, hydroxybenzoic acid, and hydrochloric acid were from Tianjin Damao Chemical Agent Factory (Tianjin, China). Methanol and acetic acid were of HPLC grade. Deionized water (18 MΩ cm) was used for the experiments. The pH value of the solution was adjusted with diluted HCl and NaOH. The information of instruments was present in the ESI (Table S1†).2.2 Preparation and characterization of FeSO catalyst
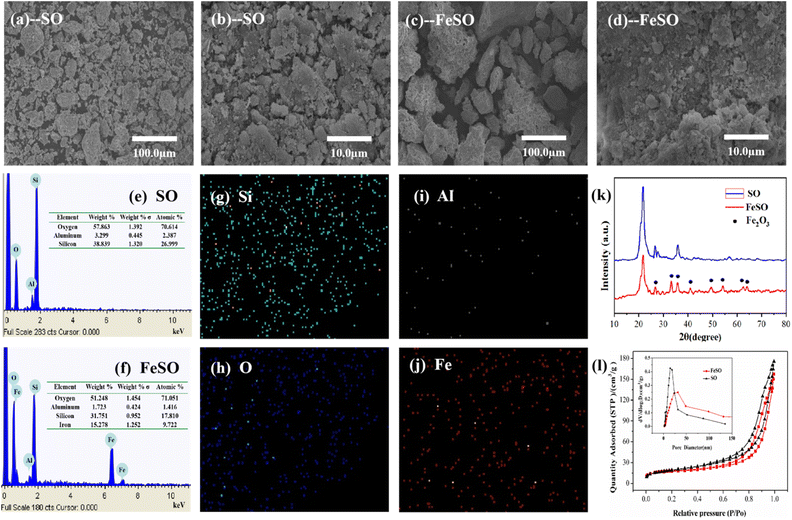
The mesoporous catalyst FeSO was prepared by impregnating iron metal into silicate ore (SO) using wetness impregnation method. The natural SO particles were firstly washed and grinded. Ferric nitrate (Fe(NO3)3·9H2O) of 0.5 mol L−1 as precursor, was dissolved in deionized water of 100 mL, and then SO of 5.0 g was added to the above solution. The mixture was stirred for 24 h, followed by filtration and dried in an oven at 105 °C overnight. It was finally calcined at 500 °C for 4 h to obtain a FeSO catalyst.The morphology and element distribution of the obtained sample were characterized by scanning electron microscope (SEM) and energy dispersive X-ray detector (EDS). X-ray powder diffraction (XRD) analysis was carried out using a XRD instrument. The N2 adsorption–desorption isotherms were attained at 77 K on a Quantasorb surface area analyzer. The pore size distribution, pore volume, and average pore diameter were determined by the Barrett–Joyner–Halenda (BJH) and Brunauer–Emmett–Teller (BET) methods. The element contents of FeSO and SO were determined by X-ray photoelectron spectroscopy (XPS).
2.3 Catalytic ozonation procedure
The experimental set up for catalytic ozonation process was carried out with a semi-batch mode. Ozone was generated from pure oxygen by a 3S-A5 ozone generator (Tonglin Technology, Beijing), and then the ozone was continuously fed into a 0.5 L aqueous solution containing SMX at a flow rate of 200 mL min−1. Usually, ozone concentration was 0.4 mg min−1, catalyst dosage was 1.0 g L−1 and SMX concentration was 20 mg L−1, respectively. The solution was stirred by a magnetic stirrer. The reaction temperature kept at 293 ± 1 K. The initial pH of the solution was about 7.2.4 Analytical method
The samples were withdrawn through cellulose acetate filters (pore size 0.22 μm) for analysis at given time intervals, and the reaction was quenched by 0.1 M Na2S2O3 solution. The SMX concentration was determined using an High Performance Liquid Chromatography (HPLC) (277 nm) (Zorbax extend-C18 column (5 μm × 4.6 mm × 150 mm), 0.8 mL min−1 flow, and mobile phase methanol/acetic acid (1‰) (90/10 in v/v)). A Shimadzu TOC 5000 analyzer was used to measure total organic carbon (TOC). The dissolved ozone concentration in the aqueous phase was measured by the indigo method.14 The gas ozone concentration was measured by the iodometric method.15 The released iron ions from the catalysts in the reaction process were measured using inductively coupled plasma (ICP) (PerkinElmer Optima 5300DV). Fluorescence spectra were investigated using a FP-6500 fluorescence spectrophotometer (JASCO, Japan) at an excitation wavelength of 303 nm. The solution pH was determined by a PHS-3C pH meter (Leici). The oxidation intermediates of SMX were detected by a Liquid Chromatography/Mass spectroscopy (LC/MS) with an electrospray ionization (ESI) source (HPLC/ESIQqQMS, Agilent 1260 HPLC-ABSciex QTrap 5500 MS) in positive ion mode. Sample separation was carried out with a C18 column (Waters XBridge, 3.0 × 100 mm, 2.5 μm particle size) at a flow rate of 0.2 mL min−1. The injection volume of sample was 10 μL, and acetonitrile and ultrapure water (containing 0.1% formic acid) were used as the mobile phase. Gradient mobile phase was shown on Table S2.† Operating parameters of MS were operated as follows: full-scan mode; mass spectra scan range, 40–500 Da; ion spray voltage, 5500 V; source temperature, 550 °C; curtain gas, 35 arbitrary units; ion source gas I, 50 arbitrary units; ion source gas II, 50 arbitrary units; declustering potential, 90 V; collision cell exit potential, 18 V; entrance potential, 10 V.3. Results and discussion
3.1 Characterization of catalysts
According to IUPAC classification, the isotherm of the SO and FeSO exhibited a type IV pattern with a type H3 hysteresis loop, indicating the presence of mesopores.28
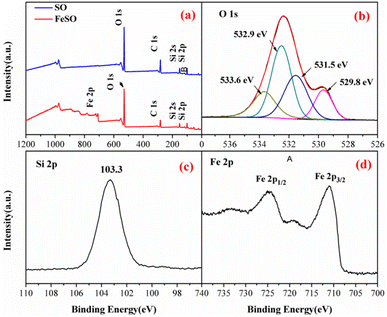 | ||
| Fig. 2 (a) XPS spectra analysis of SO and FeSO, (b) O 1s, (c) Si 2p, and (d) Fe 2p of the FeSO composites. | ||
The peaks at 711, 718.5, and 724.1 eV represented the binding energies of Fe 2p3/2, shake-up satellite Fe 2p3/2, and Fe 2p1/2, respectively.34 The energy separation between Fe 2p3/2 and Fe 2p1/2 was more than 13 eV, indicating the existence of Fe3+.35 In addition, the surface Fe concentration was 25.7 wt% by the data of XPS measurement.
Fig. S1† shown the FTIR spectra of the SO and FeSO. From this figure, the Si–O bonds appeared at the peaks of 1105 cm−1.36 The band observed at 1635 cm−1 correspond to –OH stretching vibration, which proved the presence of adsorbed water on the surface.37 The bands observed at 3419 cm−1 was corresponding to the typical hydroxyl absorption band.38
3.2 Controlled experiment
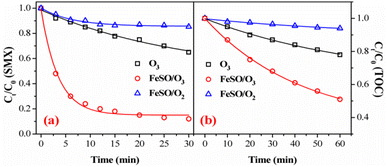
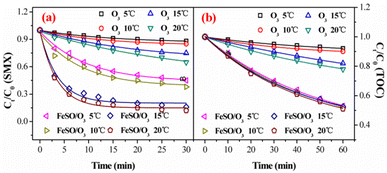
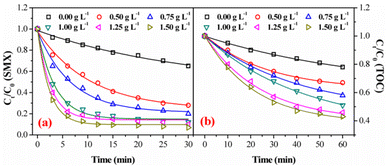
Fig. 3a and b showed the degradation and mineralization curves of SMX as a function time in FeSO/O2, ozone alone and FeSO/O3. Adsorption experiments were first carried out, and the adsorption process leaded to 14.7% SMX removal in 30 min and 5.9% TOC removal in 60 min. Compared with the catalytic ozonation process, SMX removed by adsorption was not much less. Besides, ozonation alone achieved 35.1% SMX degradation in 30 min and 22.0% mineralization in 60 min. Both SMX degradation and mineralization were enhanced significantly when introducing FeSO into ozonation process, which lead to 88.1% SMX degradation in 30 min and 49.1% mineralization in 60 min. As a whole, the SMX degradation efficiency and TOC removal of FeSO/O3 system were much better than those of FeSO/O2 and ozonation alone systems. It indicated that FeSO particles played a critical role in catalyzing ozone oxidation process for SMX removal.3.3 Effects of operating parameters of FeSO catalytic ozonation process
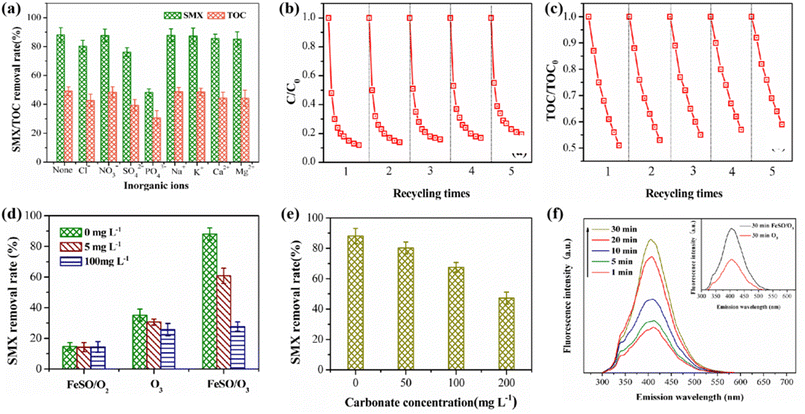
Among these common anions, PO43− has the greatest impact on the ozonation of SMX probably because of the strongest complexation ability. The surface of FeSO catalyst was rich in hydroxyl groups, which can catalyze ozone to produce ˙OH. When PO43−, SO42− and Cl− were added, the hydroxyl groups on the catalyst surface were replaced or complexed by these ions, which reduced available amount of hydroxyl groups and subsequently the catalytic activity. In addition, some research results showed that the metal ions could be used as Lewis acid, and it would be inactivated by occupying the hydroxyl group active site (eqn (1) and (2)).42 In the presence of 50 mg L−1 phosphate, the degradation rate of SMX decreased significantly. It suggested that most of the active sites on the surface of FeSO catalyst were occupied by phosphate, which negatively affected its ability of catalyze ozonation.
| ˙OH + H2PO4− → HO− + H2PO4, k < 105 M−1 s−1 | (1) |
| ˙OH + HPO42− → HO− + HPO−, k < 107 M−1 s−1 | (2) |
3.4 Catalyst stability and re-use potential
In order to investigate the stability of the catalyst, five cycle experiments were carried out under the same experimental conditions. After each experiment, FeSO was cleaned, filtered and dried. As shown in Fig. 7b and c, the degradation and mineralization effects of SMX decreased slightly, and the degradation rates of SMX were 88.1%, 85.7%, 83.2%, 81.7% and 80.5% respectively for the five cycles of experiments. The TOC removal rate decreased from 49.1% to 40.5%. After five times of reuse, the degradation and mineralization effect of FeSO catalytic ozonation system on SMX declined to a small extent, and the catalyst still maintained high catalytic activity. It indicated that FeSO catalyst had good reusability and stability. In addition, the dissolution of iron ions in continuous FeSO catalyzed ozonation reaction system was studied in Table S4.† After repeated experiments, the dissolution concentration of iron ions was less than the national limit concentration of 0.3 mg L−1, and met China's hygienic standard for drinking water (GB5749-2006).3.5 Possible reaction mechanisms
The experiment of the addition of HCO3− further confirmed our conclusion. HCO3− was an another well-known ˙OH capture agent in catalytic ozonation reaction systems. When the pH of the solution was 7, HCO3− mainly exists in the solution, and its reaction rate constant with ˙OH was 1.5 × 10⁷ M−1 s−1.43 As shown in Fig. 7e, when the pH of the aqueous solution was 7, HCO3− had a certain inhibitory effect on the degradation of SMX. With the increase of HCO3− in the solution, the inhibition effect on the degradation of SMX became obvious. Excessive HCO3− can lead to rapid consumption of ˙OH. In the process of heterogeneous catalytic ozonation degradation of SMX, HCO3− and CO32− will compete with SMX to participate in free radical reactions, consuming a large amount of ˙OH, thereby reducing the removal effect of SMX. It can be inferred that the process of FeSO catalyzed ozonation of SMX may follow the oxidation mechanism of ˙OH.
Subsequently, the amount of ˙OH in the different reaction time was analyzed by photoluminescence (PL) spectrum. Hydroxybenzoic acid was generated by using benzoic acid as ˙OH capture agent. The change of its strength can indirectly reflect the amount of ˙OH generated. As shown in Fig. 7f, the fluorescence of the products intensified gradually with the extension of catalytic ozonation time in the FeSO catalytic ozonation system. The amount of ˙OH gradually increased with the extension of reaction time. When the reaction proceeded to 30 min, the amount of ˙OH generated in FeSO/O3 system was the most, significantly higher than that in single ozonation system for 30 min.
| O3 + H2O → 2˙OH + O2, k2 = 1.1 × 10⁻⁴ M−1 s−1 | (3) |
| O3 + OH− → O2˙− + HO2˙, k2 = 70 M−1 s−1 | (4) |
| O3 + ˙OH → O2 + HO2˙ ↔ O2˙− + H+ | (5) |
| O3 + HO2˙ → 2O2 + ˙OH, k2 = 1.6 × 10⁹ M−1 s−1 | (6) |
| 2HO2˙ → O2 + H2O2 | (7) |
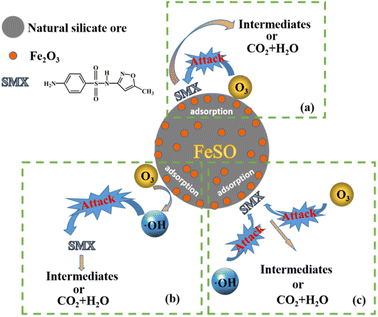
There may be three pathways in the process of FeSO catalyzed ozonation of SMX in this study, as shown in Fig. 8: (a) ozone and organic molecules were simultaneously adsorbed on the surface of FeSO catalyst, resulting in direct oxidation reaction. (b) When FeSO was put into aqueous solution, a dense layer of surface hydroxyl was formed on its surface. It would promote the decomposition of ozone molecules adsorbed on the catalyst surface into ˙OH, which can rapidly oxidize SMX and its intermediates. (c) The organic molecules adsorbed on the catalyst surface, and then they can be oxidized by ozone molecules and ˙OH in aqueous solution.
3.6 Products identification and proposed degradation pathways
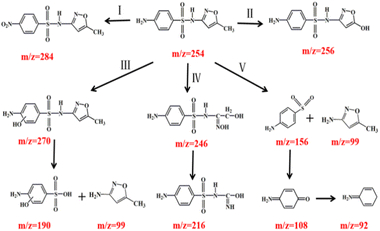
The mineralization of SMX was measured under various systems. Although the removal efficiency of TOC in the constructed system was 49.1%, and adsorption removal (5.9%), suggesting that SMX was mostly degraded into small molecule intermediates rather than complete mineralization.45 To gain an insight into the degradation behavior of SMX, LC-MS technologies were employed to analyze the reaction solution.During the catalytic ozonation process, numerous reaction intermediates may be formed due to the non-selective nature of ˙OH.46 Analytic results of degradation products in SMX were shown in Fig. S3† and summarized in Table S5.† Ten kinds of main intermediates [M + H]+ peaked at m/z 99, 156, 190, 246, 256, 270, 284, 108, 92 and 216 were detected by LC-MS, respectively.
Possible degradation pathways of SMX were proposed in Fig. 9. In pathway I, reactive site N of SMX was attacked by ˙OH and formed DP7 (m/z = 284). In pathway II, intermediate DP5 (m/z = 256) mass units could be attributed to the substitution of the methyl group by ˙OH attacking on the isoxazole ring, resulting in the formation of hydroxylated structure.47 In pathway III, electrophilic replacement on C of the aromatic ring by ˙OH formed DP6 (m/z = 270) as the ortho-hydroxylated SMX. Then ˙OH attacking on S–N bond of phenylcyclic amide resulted in the generation of DP1 (m/z = 99) and DP3 (m/z = 190).48 In pathway IV, the isoxazole ring was cleaved to produce DP4 (m/z = 246). The dehydrogenation reaction on alcohol group and the loss of one carbonyl group formed the intermediate DP10 (m/z = 216). In pathway V, the cleavage of S–N bond resulting from the ˙OH attack on the sulfonamide bond generated DP2 (m/z = 156) and DP1 (m/z = 99). The reason for bond breakage was the S atom in sulfonamide group was easily attacked by reactive oxygen species.49 Meanwhile, ˙OH attacked DP2 and resulted in the generation of DP8 (m/z = 108) and DP9 (m/z = 92).50
4. Conclusions
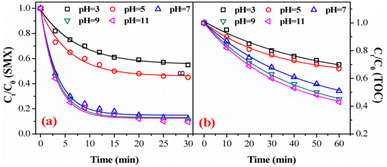
In this work, natural silicate ore supported Fe2O3 (FeSO) was successfully synthesized for catalytic ozonation of sulfamethoxazole (SMX). The degradation and mineralization effects of SMX by FeSO adsorption, ozonation alone and FeSO/O3 systems were compared in detail. Due to the addition of FeSO catalyst, the efficiency of ozonation of SMX was significantly improved, which was 53% higher than that of ozonation of SMX alone. The degradation and mineralization efficiency of SMX increased with the increase of catalyst dosage, initial solution pH and reaction temperature. FeSO catalyst showed the good stability, and the degradation rate of SMX and TOC removal rate slightly decreased after five cycles of experiments. The possible reaction mechanism for the ozone oxidation catalyzed by FeSO was proposed, and the main degradation products for SMX were detected and the corresponding degradation pathways were then speculated.Conflicts of interest
There are no conflicts to declare.Acknowledgements
This work was supported by National Natural Science Foundation of China (Grant No.51908162), Open Project of State Key Laboratory of Urban Water Resource and Environment, Harbin Institute of Technology (No. QAK202109), Science Foundation of Heilongjiang Province (Grant No. LH2020E053) and Major science and technology projects of Jilin Institute of Chemical Technology (Grant NO. 2018027).References
- X. H. Liu, H. P. Li and Y. Fang, et al., Sep. Purif. Technol., 2021, 274, 118945 CrossRef CAS.
- A. Mirzaei, L. Yerushalmi and Z. Chen, et al., J. Hazard. Mater., 2018, 359, 516 CrossRef CAS PubMed.
- S. Gao, Z. Zhao and Y. Xu, et al., J. Hazard. Mater., 2014, 274, 258–269 CrossRef CAS PubMed.
- S. Babić, M. Zrnčić and D. Ljubas, et al., Environ. Sci. Pollut. Res., 2015, 22, 11372 CrossRef PubMed.
- S. Ding, J. Niu, Y. Bao and L. Hu, J. Hazard. Mater., 2013, 262, 812 CrossRef CAS PubMed.
- Y. Lin, C. Yang and Q. Niu, et al., Adv. Funct. Mater., 2022, 32, 2108814 CrossRef CAS.
- L. Luo, D. Zou and D. Lu, et al., RSC Adv., 2018, 58, 33534 RSC.
- A. B. Thomsen and H. H. Kilen, Water Res., 1998, 32, 3353 CrossRef CAS.
- C. Wang, K. Ma, T. Wu, M. Ye and P. K. Tan, Chemosphere, 2016, 149, 219 CrossRef CAS PubMed.
- S. Zha, Y. Cheng and Y. Gao, et al., Chem. Eng. J., 2014, 255, 141 CrossRef CAS.
- Z. Heidari, R. Pelalak and R. E. Malekshah, et al., Chem. Eng. J., 2022, 428, 131230 CrossRef CAS.
- J. L. Wang and Z. Y. Bai, Chem. Eng. J., 2017, 312, 79 CrossRef CAS.
- Z. Q. Liu, J. Tu and Q. Wang, et al., Sep. Purif. Technol., 2018, 200, 51 CrossRef CAS.
- H. M. Jalali, Mater. Sci. Eng., C, 2016, 50, 924 CrossRef PubMed.
- B. Y. Lan, R. H. Huang, L. S. Li, H. H. Yan, G. Z. Liao, X. Wang and Q. Y. Zhang, Chem. Eng. J., 2013, 219, 346 CrossRef CAS.
- D. Yu, M. Wu, Q. Hu, L. Wang, C. Lv and L. Zhang, J. Hazard. Mater., 2019, 367, 456 CrossRef CAS PubMed.
- D. Wang, H. Xu and J. Ma, et al., Water Res., 2019, 149, 136 CrossRef CAS PubMed.
- J. Wang and Z. Bai, Chem. Eng. J., 2016, 312, 79 CrossRef.
- J. Ma, M. Sui, T. Zhang and C. Guan, Water Res., 2005, 39, 779 CrossRef CAS PubMed.
- Y. Xie, S. Peng, Y. Feng and D. Wu, Chemosphere, 2020, 239, 124612 CrossRef CAS PubMed.
- D. Gümüş and F. Akbal, Chemosphere, 2017, 174, 218 CrossRef PubMed.
- X. Yang, X. Cheng and A. A. Elzatahry, et al., Chin. Chem. Lett., 2019, 2, 324 CrossRef.
- D. Wang, H. Xu and J. Ma, et al., Chem. Eng. J., 2018, 354, 113 CrossRef CAS.
- G. Moussavi, R. Khosravi and N. R. Omran, Appl. Catal., A, 2012, 445, 42 CrossRef.
- K. He, Y. Dong, L. Yin, A. Zhang and Z. Li, Acta Geochim., 2006, 159, 587 Search PubMed.
- H. Xiong, D. Zou and D. Zhou, et al., Chem. Eng. J., 2017, 316, 7 CrossRef CAS.
- J. Bing, C. Hu and Y. Nie, et al., Environ. Sci. Technol., 2015, 49, 1690 CrossRef CAS PubMed.
- J. Lu, X. Wei and Y. Chang, et al., J. Chem. Technol. Biotechnol., 2015, 91, 985 CrossRef.
- Y. Ren, H. Zhang and H. An, et al., J. Colloid Interface Sci., 2018, 526, 347 CrossRef CAS PubMed.
- Y. Huang, W. Xu and L. Hu, et al., Catal. Today, 2017, 297, 143 CrossRef CAS.
- M. A. Peluso, L. A. Gambaro and E. Pronsato, et al., Catal. Today, 2008, 133, 487 CrossRef.
- H. Chen, A. Sayari and A. Adnot, et al., Appl. Catal., B, 2001, 32, 195 CrossRef CAS.
- B. M. Reddy, B. Chowdhury and P. G. Smirniotis, Appl. Catal., A, 2001, 221, 397 CrossRef.
- H. Xiong, S. Dong and J. Zhang, et al., Water Res., 2018, 136, 75 CrossRef CAS PubMed.
- W. J. Liu, F. Zeng, H. Jiang, X. S. Zhang and W. W. Li, Chem. Eng. J., 2012, 180, 9 CrossRef CAS.
- Q. Fei, B. Xu and Z. Lun, et al., Appl. Catal., B, 2012, 121, 171 Search PubMed.
- F. Z. Zhang and C. H. Wei, et al., Appl. Catal., A, 2017, 547, 60 CrossRef CAS.
- L. Qi, H. You and Z. Zhang, et al., Int. J. Electrochem. Sci., 2013, 8, 5457 CAS.
- D. Wang, H. Xu and J. Ma, et al., Water Res., 2019, 149, 136 CrossRef CAS PubMed.
- Z. K. Xiong, B. Lai, Y. Yuan, J. Y. Cao, P. Yang and Y. X. Zhou, Chem. Eng. J., 2016, 302, 137 CrossRef CAS.
- J. Nawrocki and B. Kasprzyk-Hordern, Appl. Catal., B, 2010, 99, 27 CrossRef CAS.
- W. J. Masschelein, Environ. Sci. Pollut. Res., 1992, 1, 13 Search PubMed.
- W. Li, Z. Qiang and T. Zhang, et al., Appl. Catal., B, 2012, 113, 290 CrossRef.
- R. Huang, H. Yan, L. Li, D. Deng, Y. Shu and Q. Zhang, Appl. Catal., B, 2011, 106, 264 CAS.
- S. Wu, C. Yang and Y. Lin, et al., J. Environ. Sci., 2022, 115, 330–340 CrossRef CAS PubMed.
- W. Q. Guo, R. L. Yin, X. J. Zhou, J. S. Du, H. O. Cao and S. S. Yang, et al., Ultrason. Sonochem., 2015, 22, 182 CrossRef CAS PubMed.
- A. M. Wang, Y. Y. Li and A. L. Estrada, Appl. Catal., B, 2011, 102, 378 CrossRef CAS.
- J. S. Du, W. Q. Guo and H. Z. Wang, et al., Water Res., 2018, 138, 323–332 CrossRef CAS PubMed.
- X. Fu, Y. Lin and C. Yang, et al., J. Environ. Eng., 2022, 10, 107734 CAS.
- A. G. Trovo, R. F. Nogueira and A. Aguera, et al., Water Res., 2009, 43, 3922 CrossRef CAS PubMed.
Footnote |
| † Electronic supplementary information (ESI) available. See DOI: https://doi.org/10.1039/d2ra06714e |
| This journal is © The Royal Society of Chemistry 2023 |

