 Open Access Article
Experimental investigation of nanofluid enhanced oil recovery by spontaneous imbibition
Jingnan Zhang *ab,
Hai Huangb,
Ming Zhangb and
Wenchang Wang*c
aSchool of Urban Planning and Municipal Engineering, Xi'an Polytechnic University, China
bShaanxi Key Laboratory of Advanced Stimulation Technology for Oil & Gas Reservoirs, Xi'an Shiyou University, China
cSchool of Mechanics and Engineering Science, Shanghai Institute of Applied Mathematics and Mechanics, Shanghai University, China
First published on 30th May 2023
Abstract
Nanofluids have been recently proposed as new chemical agents for enhanced oil recovery. In this study, in order to reflect the effect of nanofluids on imbibition, the imbibition performance of manganese chloride (MnCl2) solution, sodium dodecylbenzene sulfonate (SDBS) solution, and silica (SiO2) nanofluids were studied by a spontaneous imbibition experiment at 25 °C and 0 MPa. The oil production from pores with different sizes and the imbibition efficiency were tested by nuclear magnetic resonance T2 spectroscopy and metering in spontaneous imbibition. In addition, the interfacial tensions between the imbibition liquids and oil were tested. The changes in the contact angle of the core slice before and after immersing in imbibition liquids were measured. The silica nanofluid is used as the imbibition liquid, and the shift of the T2 spectral peak to the left is not obvious and shifted by only 23.95–25.72 ms, the change in the contact angle is 6.63°–12°, the interfacial tension between the nanofluid and the simulated oil is 0.25–0.41 mN m−1, and the imbibition efficiency was slightly improved with increasing nanoparticle concentration, up to 57.40%, which improved by 16.14% and 32.95%, respectively, compared to the surfactant solution and the manganese chloride solution. This shows that the silica nanofluid can effectively improve oil production in small pores, reduce oil–water interfacial tension, and change rock wettability.
Introduction
Low oil recovery has always been the bottleneck in oilfield development. With the increasing advancement and diversification of research methods, scholars have made some progress in studying nanofluid enhanced oil recovery (EOR). The nanofluid flooding oil experiments were conducted with macro homogeneous and heterogeneous cores, and they had a better effect on experiments.1–5 Some experiments show that the nanofluids can enter the rock pore network, change the surface properties of the pore wall, strengthen the attraction between the particles and the pore wall, and effectively increase the oil displacement efficiency.6,7 Moradi et al.8 conducted core displacement experiments by alternating the injection of nanofluids and carbon dioxide gas. It was found that the recovery efficiency of nanofluids was higher than that of regular alternating injection of gas and water. The displacement effect was better in a low permeability core (2.839 mD), and the smaller the nanoparticles, the better the displacement effect. Lei et al.9 tested the effect of nanofluids on expanding the swept volume of an ultralow-permeability core in a core flooding experiment. The experimental results show that nanofluids can weaken the hydrogen bond association between water molecules and effectively change the structure of the water molecular network. Thus, nanofluids enter the small, low-permeability pore area that cannot be swept by conventional water flooding. Jafarbeigi et al.10 evaluated the oil displacement effect of nanofluids on the carbonate reservoir through a core displacement experiment. The results show that the nanofluids can effectively change the wettability of the rock surface in the carbonate reservoir, and the recovery after displacement can increase by 15–23%. Liu et al.11 added Janus-silica nanoparticles to the surfactant and recovery was significantly improved under the same displacement condition, showing good EOR potential. Jalilian et al.12 investigated the feasibility of nano-emulsion flooding as a method for EOR through core flooding experiments and a recovery factor of up to 60%.The above experiments show that nanofluids have an excellent oil displacement effect. Spontaneous imbibition is a process in a porous medium that spontaneously absorbs a wetting liquid driven by capillary force, which plays a vital role in EOR.13 Due to the gradual transition of oil production from a simple homogeneous reservoir to a fractured dual-porosity reservoir,14 spontaneous imbibition has attracted extensive attention from scholars. The spontaneous imbibition experiments were conducted using water or surfactant solutions.15–20 Standnes et al.21 conducted spontaneous imbibition experiments using aqueous solutions of ethoxylated alcohol (EA) and a cationic surfactant (C12TAB). For the short core experiments, about 40–45% of the original oil in place (OOIP) was recovered using C12TAB, while only 10% was the average recovery using EA. Contact angle measurements on oil-wet calcite crystals confirmed that C12TAB was much more effective than EA in altering wettability in water-wet conditions. Habibi et al.22 performed different sets of experiments to investigate surfactants with long and short ethoxylate (EO) chains that enhance imbibition. These experiments show that the wettability alteration is the primary mechanism of the surfactant solution to improve the imbibition efficiency. However, many types of research have shown that nanofluid can effectively change the wettability of the rock.23–28 Caili Dai et al.29 prepared a new kind of self-dispersing silica nanoparticle and used it to enhance oil recovery in spontaneous imbibition experiments of low-permeability cores. The excellent performance of nanofluids was attributed to the fact that nanofluids could significantly change the wettability of rocks. Moghaddam et al.30 investigated the impacts of the nanofluids of zirconium dioxide, calcium carbonate, titanium dioxide, silicon dioxide, magnesium oxide, aluminium oxide, cerium oxide, and carbon nanotube on the wettability of carbonate rocks by spontaneous imbibition. The results of spontaneous imbibition tests confirm the active roles of calcium carbonate and silicon dioxide nanoparticles in EOR.
In this study, a method of spontaneous imbibition experiment was adopted. Manganese chloride solution, sodium dodecylbenzene sulfonate solution, and silica nanofluid with different concentrations were used to enhance oil recovery in spontaneous imbibition. Significantly, the imbibition efficiency of different imbibition liquids in the spontaneous imbibition process was measured by metering and nuclear magnetic resonance T2 spectrum, avoiding the inaccuracy caused by using a single metering method. In addition, the interfacial tensions between different imbibition liquids and oil were tested. The change in the contact angle of the core slices before and after immersing in different imbibition liquids was measured. Furthermore, the mechanism of nanofluids in enhanced oil recovery by spontaneous imbibition was analysed.
Imbibition experiment
Experimental materials
![[thin space (1/6-em)]](https://www.rsc.org/images/entities/char_2009.gif) :
:![[thin space (1/6-em)]](https://www.rsc.org/images/entities/char_2009.gif) 1, and the viscosity was 2.5 mPa s at 25 °C.
1, and the viscosity was 2.5 mPa s at 25 °C.| Number | Length/cm | Diameter/cm | Porosity/% | Permeability/10−3 μm2 | Soi/% | Swi/% | Remarks | Rock type |
|---|---|---|---|---|---|---|---|---|
| 3-2 | 10.00 | 2.52 | 32.25 | 1012.20 | — | — | Core | Sandstone |
| 3-3 | 10.00 | 2.52 | 28.65 | 987.36 | — | — | Core | Sandstone |
| c-3-2-1 | 2.92 | 2.52 | 31.67 | — | 72.78 | 27.22 | Core section | Sandstone |
| c-3-2-2 | 2.88 | 2.52 | 32.05 | — | 76.32 | 23.68 | Core section | Sandstone |
| c-3-2-3 | 2.86 | 2.52 | 31.52 | — | 78.06 | 21.94 | Core section | Sandstone |
| c-3-3-1 | 2.78 | 2.52 | 30.28 | — | 69.52 | 30.48 | Core section | Sandstone |
| c-3-3-2 | 2.96 | 2.52 | 26.32 | — | 66.36 | 33.64 | Core section | Sandstone |
| c-3-3-3 | 2.62 | 2.52 | 27.66 | — | 67.22 | 32.78 | Core section | Sandstone |
| s-3-2-1 | 0.28 | 2.52 | — | — | — | — | Core slice | Sandstone |
| s-3-2-2 | 0.28 | 2.52 | — | — | — | — | Core slice | Sandstone |
| s-3-2-3 | 0.26 | 2.52 | — | — | — | — | Core slice | Sandstone |
| s-3-3-1 | 0.26 | 2.52 | — | — | — | — | Core slice | Sandstone |
| s-3-3-2 | 0.24 | 2.52 | — | — | — | — | Core slice | Sandstone |
| s-3-3-3 | 0.27 | 2.52 | — | — | — | — | Core slice | Sandstone |
Experimental equipment and methods
The experimental steps are as follows:
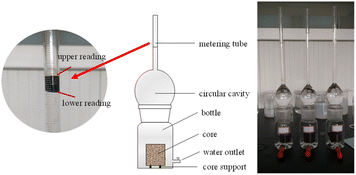
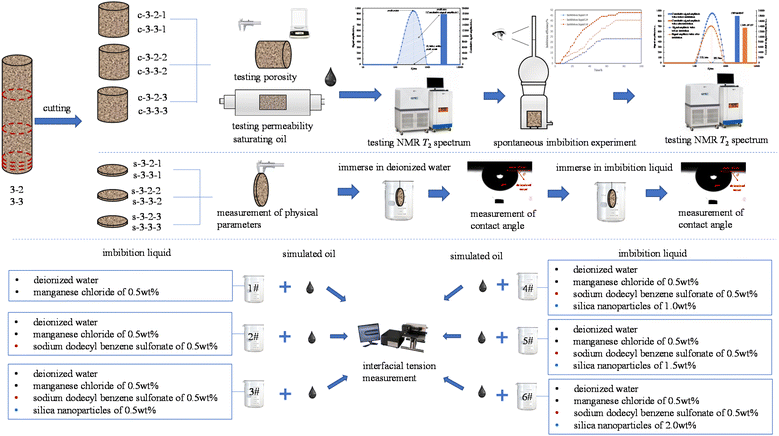
(1) The saturated oil core sections were tested with nuclear magnetic resonance. The experimental devices for spontaneous imbibition were numbered 1#, 2#, 3#, 4#, 5#, and 6#, then the core section c-3-2-1, c-3-2-2, c-3-2-3, c-3-3-1, c-3-3-2, and c-3-3-3 were placed in device 1#, device 2#, device 3#, device 4#, device 5#, and device 6#, respectively. Apply Vaseline evenly to the contact surface between the glass cavity and the bottle, and then closely connect the glass cavity and the bottle.
(2) The prepared imbibition liquid 1#, imbibition liquid 2#, imbibition liquid 3#, imbibition liquid 4#, imbibition liquid 5#, and imbibition liquid 6#, were slowly poured from the top of the metering tube into device 1#, device 2#, and device 3#, device 4#, device 5#, and device 6#, respectively.
(3) Upper and lower readings in the metering tube were recorded every 2 h.
(4) The oil in the tube was sucked out from the top of the metering tube, and the rest of the liquids were drained slowly through the discharge when there was no change in the difference between the upper reading and the lower reading of the metering tube for 10 h. The cores were removed, drained, and wrapped with polyethylene film for use in the next step.
The imbibition efficiency is obtained from the following:
 | (1) |
| Performance | Parameters |
|---|---|
| Magnet type | Permanent magnet |
| Magnetic field intensity | (0.50 ± 0.05) T |
| Magnetic field stability | ≤300 Hz h−1 |
| RF field | Pulse frequency 1–30 MHz, frequency control accuracy 0.1 Hz, pulse accuracy 100 ns |
| RF transmission power | Peak output > 300 W |
| Maximum sampling bandwidth | 2000 kHz |
| Imaging gradient | Peak intensity > 2.5 G cm−1 |
| Probe coil diameter | 60 mm |
| Effective sample detection range | 60 mm diameter sphere |
| Imaging quality | The image signal-to-noise ratio is greater than 20 dB, the image distortion is less than 15%, and the image uniformity is greater than 45% |
| Sampling frequency | 50 MHz |
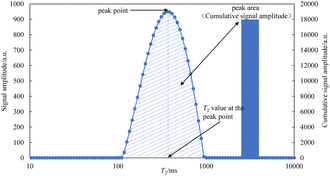
The core was placed in the NMR equipment RF coil to test its T2 spectrum when the core was saturated with oil at the end of imbibition. The schematic diagram of the T2 spectrum is shown in Fig. 2.
The peak area (cumulative signal amplitude in shaded area) in the relaxation curve is directly proportional to the liquid quality in the core, and the T2 value at the peak point is proportional to the size of the pore where the liquid in the core is located. Therefore, the degree of oil production in pores of different sizes can be reflected by the NMR T2 spectrum.18
| Performance | Parameters |
|---|---|
| Tension measurement range | 10−6–500 mN m−1 |
| Rotating shaft speed | 1000 rpm–20![[thin space (1/6-em)]](https://www.rsc.org/images/entities/char_2009.gif) 000 rpm 000 rpm |
| Speed accuracy | 1‰ |
| The inner diameter of the capillary tube for measurement | 4 mm/2 mm |
| Light source | 70 × 19 mm plane tube 12 V |
| T-Head for two kinds of amplification factor measurement | 2 mm/1.1 mm |
The interfacial tensions between the imbibition liquid and the simulated oil were measured by the pendant drop method. During the measurement, the simulated oil and imbibition liquids were added to the sample tube to form the interface. The sample tube rotation speed was set at 2000 rpm, and the temperature was set at 25 °C. Under centrifugal force, gravity, and interfacial tension, the lighter liquid forms a long ellipsoid or cylindrical droplet in the heavier liquid. Under the horizontal condition of the rotation axis, the droplet length of 2x0 and width of 2y0, and the interfacial tension are calculated according to the Bashforth–Adams equation:
 | (2) |
Experimental results and discussion
Imbibition efficiency
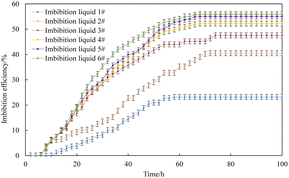
The imbibition efficiency of the core in three kinds of imbibition liquids was studied using metering and T2 spectrum testing. The metering method is the most convenient and intuitive, and it can be obtained directly by reading the scale of the metering tube of the imbibition device. The curve of imbibition efficiency with time obtained by the metering method at 25 °C is shown in Fig. 5.The final imbibition efficiency of imbibition liquid 1#, imbibition liquid 2#, imbibition liquid 3#, imbibition liquid 4#, imbibition liquid 5#, and imbibition liquid 6# is 23.20%, 40.50%, 47.54%, 52.22%, 55.06%, and 55.87%, respectively. It can be seen from the figure that the oil in the imbibition liquid 3#–6# is discharged relatively quickly. This shows that the imbibition liquid 3#–6# has a better performance in imbibition and oil drainage compared to other imbibition liquids.
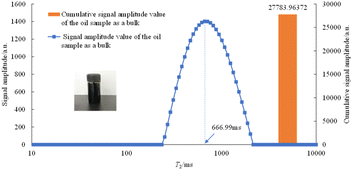
Before saturating the rock with oil, the T2 spectrum of the oil as a bulk is shown in Fig. 6.
As can be seen from Fig. 6, when a large oil droplet exists in the sample bottle, the position of its peak vertex is 666.99 ms, and the peak area is 27![[thin space (1/6-em)]](https://www.rsc.org/images/entities/char_2009.gif) 783.96 a.u.
783.96 a.u.
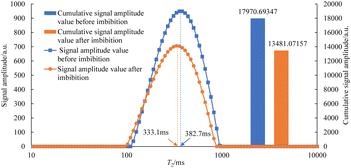
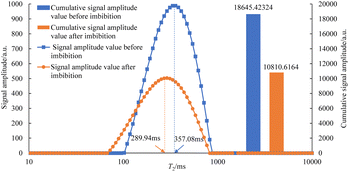
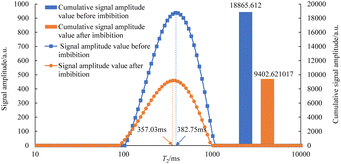
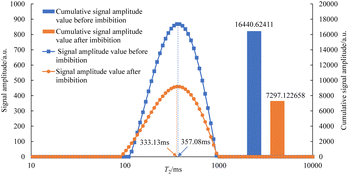
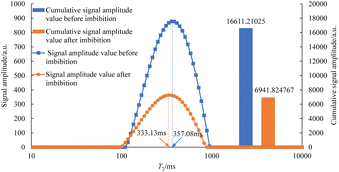
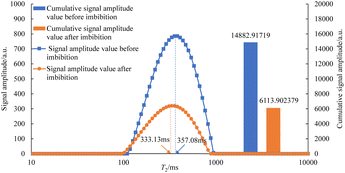
The T2 spectrum of oily cores before and after spontaneous imbibition in three kinds of imbibition liquids is shown in Fig. 7–12. It is worth noting that the core used in this experiment is an artificial sandstone core. If repeated cleaning is performed, the permeability and porosity of the core will be affected, resulting in the differences in the physical parameters of the same sample at different experimental stages. Therefore, two cores (about 10 cm in length) of the same batch with similar physical parameters are selected, and in this study, six core sections (about 3 cm in length) formed after cutting are not reused.
As can be seen in Fig. 7–12, the peak point of the spectrum shifted to the left during imbibition. The peak point of the T2 spectrum for the core c-3-2-2 in imbibition liquid 2# moved to the left obviously during imbibition by 67.14 ms. The peak point of the T2 spectrum for the core c-3-2-3, c-3-3-1, c-3-3-2, and c-3-3-3 in imbibition liquid 3#–6# moving to the left is not obvious during imbibition and shifts by only 23.95–25.67 ms. It shows that the oil in relatively large pores is highly produced under the action of imbibition liquid 2#. The degree of oil production in the core pores under the action of the imbibition liquid 3#–6# is relatively uniform. It also suggests that imbibition liquid 3# can increase the degree of oil production in small pores compared to imbibition liquid 1# and imbibition liquid 2#.
After imbibition, the peak area (the cumulative signal amplitude in the area enclosed by the T2 curve and abscissa) of core c-3-2-1, c-3-2-2, c-3-2-3, c-3-3-1, c-3-3-2, c-3-3-3 decreased by 4489.62, 7834.81, 9462.99, 9152.50, 9669.39, 8769.02 a.u., respectively. The peak area is proportional to the oil saturation, so the decrease in the peak area is the imbibition efficiency of the core in the imbibition process, which can be calculated using the following:
 | (3) |
The imbibition efficiency obtained by the T2 spectrum is shown in Table 4. This indicates that core 3# has the highest imbibition efficiency, which is close to the results obtained by metering. But there are still some differences. This is because the volume of oil floating on the upper surface due to gravity differentiation in the imbibition process was measured by metering, and a small amount of oil dissolved in the imbibition liquid or attached to the vessel was not considered. When the reduction of oil in the core was tested by using the nuclear magnetic resonance T2 spectrum method, the residual oil in the core would run off in the process of core extraction, which will be mistaken for the result of imbibition. Thus, it can be seen that the use of the metering method will get a smaller result than the actual value, while the use of the nuclear magnetic resonance T2 spectrum method will get a larger result than the actual value. So, we need to take the average of the two results in order to obtain more accurate results. The average of the imbibition efficiency is also shown in Table 4.
| Imbibition liquid number | Imbibition efficiency | ||
|---|---|---|---|
| Metering | T2 spectrum | Average value | |
| 1# | 23.20% | 24.98% | 24.09% |
| 2# | 40.50% | 42.02% | 41.26% |
| 3# | 47.54% | 50.16% | 48.85% |
| 4# | 52.22% | 55.67% | 53.95% |
| 5# | 55.06% | 58.21% | 56.64% |
| 6# | 55.87% | 58.92% | 57.40% |
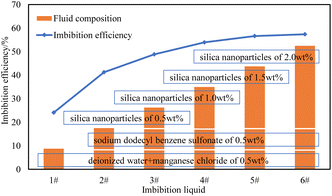
The relationship between fluid composition and imbibition efficiency is shown in Fig. 13.
It can be seen from Fig. 13 that with the increase in composition, the imbibition efficiency is significantly improved. After the composition of nanoparticles is added, the imbibition efficiency is further improved, which shows that the nanofluid used in this study effectively improves the imbibition efficiency. With increasing nanoparticle concentration, the imbibition efficiency was slightly improved.
Interfacial tension between imbibition liquids and oil
The interfacial tension between imbibition liquids and oil is shown in Table 5.| Imbibition liquid | Test 1 interfacial tension/(mN m−1) | Test 2 interfacial tension/(mN m−1) | Test 3 interfacial tension/(mN m−1) | Average interfacial tension/(mN m−1) |
|---|---|---|---|---|
| 1# | 21.01 | 21.24 | 20.75 | 21.00 |
| 2# | 0.89 | 0.46 | 0.51 | 0.62 |
| 3# | 0.43 | 0.55 | 0.25 | 0.41 |
| 4# | 0.52 | 0.28 | 0.36 | 0.35 |
| 5# | 0.48 | 0.16 | 0.22 | 0.29 |
| 6# | 0.27 | 0.31 | 0.18 | 0.25 |
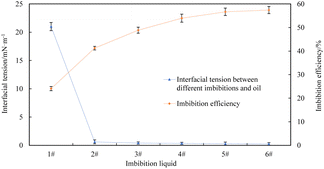
The interfacial tensions between imbibition liquid 2#–6# and oil are significantly reduced compared to the interfacial tension between imbibition liquid 1# and oil because imbibition liquid 3# and imbibition liquid 2# contain the same surfactant composition, which can reduce the oil–water interfacial tension. The interfacial tension between imbibition liquid 3#–6# and oil is closer to that between imbibition liquid 2# and oil. It shows that the composition of the nanoparticle in the imbibition liquid 3#–6# does not have a noticeable effect on reducing the oil–water interfacial tension. The imbibition efficiency and the corresponding interfacial tension values are shown in Fig. 14.
The interfacial tensions of imbibition liquid 2#–6# and oil were significantly lower than those of imbibition liquid 1# and oil, and the imbibition efficiencies of imbibition liquid 2#–6# are also significantly higher than that of imbibition liquid 1#, which indicates that the reduction of the oil–water interfacial tension is one of the main factors to improve the imbibition efficiency in the spontaneous imbibition process. The oil in the core deforms more easily as the oil–water interfacial tension decreases. The ability of oil droplets to pass through the throat of a porous medium will be enhanced. A part of the immovable oil is changed into movable oil and discharged from the core by the action of imbibition. Thus, imbibition efficiency is improved effectively.
The contact angle of core slices
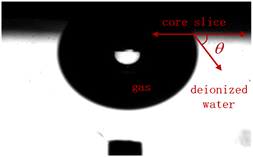
The liquid–solid contact angles of the core slice s-3-2-1, s-3-2-2, s-3-2-3, s-3-3-1, s-3-3-2, and s-3-3-3 immersed in imbibition liquids for 24 h are shown in Table 6.| Core slices | Condition | Test 1 liquid–solid contact angles/° | Test 2 liquid–solid contact angles/° | Test 3 liquid–solid contact angles/° | Average liquid–solid contact angles/° | The change of contact angle/° |
|---|---|---|---|---|---|---|
| s-3-2-1 | Immerse in deionized water for 24 h | 66.51 | 64.25 | 66.43 | 65.73 | 0.68 |
| Immerse in imbibition liquid 1# for 24 h | 66.25 | 67.43 | 65.55 | 66.40 | ||
| s-3-2-2 | Immerse in deionized water for 24 h | 64.76 | 62.85 | 63.49 | 63.70 | 4.27 |
| Immerse in imbibition liquid 2# for 24 h | 68.42 | 67.13 | 68.36 | 67.97 | ||
| s-3-2-3 | Immerse in deionized water for 24 h | 65.12 | 65.26 | 67.32 | 65.90 | 6.63 |
| Immerse in imbibition liquid 3# for 24 h | 72.63 | 71.78 | 73.18 | 72.53 | ||
| s-3-3-1 | Immerse in deionized water for 24 h | 64.68 | 65.81 | 62.27 | 64.25 | 8.81 |
| Immerse in imbibition liquid 4# for 24 h | 71.68 | 72.28 | 75.21 | 73.06 | ||
| s-3-3-2 | Immerse in deionized water for 24 h | 64.92 | 66.32 | 67.62 | 66.3 | 10.98 |
| Immerse in imbibition liquid 5# for 24 h | 75.38 | 76.92 | 79.55 | 77.28 | ||
| s-3-3-3 | Immerse in deionized water for 24 h | 63.21 | 63.31 | 65.52 | 64.01 | 12 |
| Immerse in imbibition liquid 6# for 24 h | 77.82 | 75.98 | 74.22 | 76.01 |
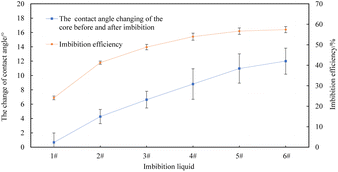
The core slices show water-wet characteristics after immersing in deionized water for 24 h. The contact angles of the core slice after immersing in imbibition liquid 2#–6# have increased compared to those after immersing in deionized water, which indicates that the wettability of the core surface can be changed by imbibition liquid 2#–6#. The relationships between the change value of the contact angle and the imbibition efficiency of the core slices before and after immersion in different imbibition liquids are shown in Fig. 15.
The higher the value of contact angle change before and after the core slices are immersed in different imbibition liquids, the higher the imbibition efficiency, indicating that the change in rock wettability is one of the factors in improving the imbibition efficiency in the process of spontaneous imbibition. In addition, it can be seen from Fig. 14 and 15 that the interfacial tension between oil and imbibition liquid 2#–6# are relatively close. The wettability changes of the core slice immersed in liquid 2#–6# are also not obvious. But the imbibition efficiency of the core section in imbibition liquid 2# is lower than that of imbibition liquid 3#–6#. This is because the imbibition liquid 3#–6# contains nanoparticles. Wasan and Nikolov et al. found that the nanoparticles were arranged spontaneously and orderly in the three-phase contact wedge region, which generated structural disjoining pressure. The nanofluid film continuously diffused to the centre of the contact region between oil droplets and the solid phase surface under the action of structural disjoining pressure. Finally, the oil droplets were driven away.32–34 Zhang Hua et al.35 performed a series of flooding experiments on EOR using a nanofluid at different capillary numbers. Additional oil recovery of around 15% may be achieved by a nanofluid compared to brine at a Ca = 10−7 insufficient time for the nanofluid film to advance through structural disjoining pressure and displace oil. Compared to oil recovery by the SDS solution and the nanofluid with the same IFT, the additional oil by the nanofluid is 12.6% and is also due to the structural disjoining pressure. Dai Caili et al.29 measured the contact angle and interfacial tension to investigate the mechanism of nanoparticles for enhanced oil recovery. The results showed that the adsorption of silica nanoparticles can change the surface wettability from oil-wet to water-wet and silica nanoparticles showed little influence on oil/water interfacial tension. In addition, the change of the oil droplet shape on the hydrophobic surface was monitored through dynamic contact angle measurement. It was shown that silica nanoparticles can gradually detach the oil droplet from the hydrophobic surface, which is consistent with the structural disjoining pressure mechanism proposed by Wasan and Nikolov. Similarly, the nanofluids used in this experiment have no significant effect on the wettability of sandstone core slices and the interfacial tension between oil and water. However, the imbibition efficiency was increased using nanofluids in comparison to that of saline and surfactant solutions. This is also consistent with the structural disjoining pressure mechanism. Therefore, the reduction of the interfacial tension and the change in rock wettability are the two significant factors in improving the imbibition efficiency of the surfactant solution and the nanofluid. At the same time, nanofluids have a strong ability to peel oil droplets and achieve a better imbibition effect due to the structural disjoining pressure.
This study shows that nanofluids have good performance and great potential to improve imbibition efficiency. Overall, the contact angle is around 70, indicating water-wet conditions, and the reduction in IFT is not high, which indicates poor chemical performance. Oil-wet samples such as carbonate are worth studying. The factors influencing the imbibition efficiency and the optimal formula of nanofluids need to be further studied in order to promote the improvement, popularization, and industrial application of nanofluids for EOR.
Conclusions
The manganese chloride solution, sodium dodecylbenzene sulfonate solution, and silica nanofluid were used to investigate their performance for imbibition. The imbibition efficiency was the best and reached 57.40% when the core was immersed in 2.0 wt% silica nanofluid under the conditions used in this paper. With increasing nanoparticle concentration, the imbibition efficiency was slightly improved. The NMR T2 spectrum showed that the degree of oil production in the small pores of the core was increased in the imbibition process with a silica nanofluid. During imbibition, the interfacial tension between oil and water can be reduced, and the wettability of the rock can be changed by sodium dodecylbenzene sulfonate solution and silica nanofluid, which are two dominant factors in improving the efficiency of core imbibition. In addition, silica nanofluid has a strong ability to peel off oil droplets due to the structural disjoining pressure, which can achieve better imbibition efficiency compared to sodium dodecylbenzene sulfonate solution (no silica particles). We hope that this work can be helpful to the applications of nanofluids for EOR.Author contributions
Jingnan Zhang: conceptualization, data curation, formal analysis, and writing – original draft; Wenchang Wang: data curation, methodology, writing – review & editing; Hai Huang: formal analysis, funding acquisition; Ming Zhang: methodology, investigation.Conflicts of interest
There are no conflicts to declare.Acknowledgements
This research is supported by the Open Fund Project of the Shaanxi Key Laboratory of Advanced Stimulation Technology for Oil & Gas Reservoirs (kfjj-tz-2020-5), Initial Scientific Research Fund of Doctoral in Xi'an Polytechnic University (201933), National Natural Science Foundation of China (51874240), Natural Science Basic Research Program of Shaanxi (2022-JQ-057), Key Research and Development Program of Shaanxi (2020kw-027), Natural Science Basic Research Program of Shaanxi (2023-JC-QN-0400).Notes and references
- B. Suleimanov, F. Ismailov and E. Veliyev, J. Pet. Sci. Eng., 2011, 78, 431–437 CrossRef CAS.
- Z. Hu, S. M. Azmi, G. Raza, P. W. Glover and D. Wen, Energy Fuels, 2016, 30, 2791–2804 CrossRef CAS.
- M. Zargartalebi, R. Kharrat and N. Barati, Fuel, 2015, 143, 21–27 CrossRef CAS.
- H. Ehtesabi, M. M. Ahadian, V. Taghikhani and M. H. Ghazanfari, Energy Fuels, 2014, 28, 423–430 CrossRef CAS.
- H. Ehtesabi, M. M. Ahadian and V. Taghikhani, Energy Fuels, 2015, 29, 1–8 CrossRef CAS.
- L. Hendraningrat, S. Li and O. Torsæter, J. Pet. Sci. Eng., 2013, 111, 128–138 CrossRef CAS.
- H. Reza, P. Peyman, V. Ali and S. Abdolhamid, Pet. Explor. Dev., 2017, 44, 802–810 CAS.
- B. Moradi, P. Pourafshary, F. Jalali, M. Mohammadi and M. Emadi, J. Nat. Gas Sci. Eng., 2015, 27, 64–73 CrossRef CAS.
- Q. Lei, J. Luo, B. Peng, X. Wang, P. Xiao, P. Wang, L. He, B. Ding and X. Geng, Pet. Explor. Dev., 2019, 46, 937–942 Search PubMed.
- E. Jafarbeigi, E. Kamari, F. Salimi and A. Mohammadidoust, J. Pet. Sci. Eng., 2020, 195, 12 CrossRef.
- P. Liu, H. Yu, L. Niu, D. Ni, Q. Zhao, X. Li and Z. Zhang, Chem. Eng. Sci., 2020, 228, 11 Search PubMed.
- M. Jalilian, A. Tabzar, V. Ghasemi, O. Mohammadzadeh, P. Pourafshary, N. Rezaei and S. Zendehboudi, Fuel, 2019, 251, 754–762 CrossRef CAS.
- W. Tian, K. Wu, Y. Gao, Z. Chen, Y. Gao and J. Li, Energy Fuels, 2021, 35, 5643–5670 CrossRef CAS.
- J. Gong and W. R. Rossen, Fuel, 2018, 223, 470–485 CrossRef CAS.
- C. Wang, H. Gao, Y. Gao and H. Fan, Energy Fuels, 2020, 34, 9275–9282 CrossRef CAS.
- Z. Yang, X. Liu, H. Li, Q. Lei and X. Wang, Pet. Explor. Dev., 2019, 46, 739–745 CrossRef.
- L. Yang, H. Wang, Z. Zou, Q. Jiang, J. Zhang, J. Xu and J. Cai, Energy Fuels, 2021, 35, 15995–16006 CrossRef CAS.
- H. Umeobi, Q. Li, L. Xu, Y. Tan, L. Xu, Y. Zhong and C. C. Onyekwena, Energy Fuels, 2021, 35, 15856–15866 CrossRef CAS.
- B. Hou, F. Zhang, S. Wang, H. Fan, D. Wen, S. Gao, Y. Tian, X. Yang, H. He and X. Zhang, Energy Fuels, 2022, 36, 1316–1325 CrossRef CAS.
- Y. Ding, X. Yu, X. Liu, L. Liang and J. Xiong, Energy Fuels, 2021, 35, 18518–18532 CrossRef CAS.
- D. C. Standnes, L. A. D. Nogaret, C. Hung-lung and T. Austad, Energy Fuels, 2002, 16, 1557–1564 CrossRef CAS.
- A. Habibi, Y. Esparza, Y. Boluk and H. Dehghanpour, Energy Fuels, 2020, 34, 12301–12313 CrossRef CAS.
- J. Zhang, L. Tian and H. Zhang, Oilfield Chem., 2021, 38, 184–190 CAS.
- A. Karimi, Z. Fakhroueian, A. Bahramian, N. Pour Khiabani, J. B. Darabad, R. Azin and S. Arya, Energy Fuels, 2012, 26, 1028–1036 CrossRef CAS.
- J. Giraldo, P. Benjumea, S. Lopera, F. B. Cortés and M. A. Ruiz, Energy Fuels, 2013, 27, 3659–3665 CrossRef CAS.
- L. Hendraningrat and O. Torsæter, Energy Fuels, 2014, 28, 6228–6241 CrossRef CAS.
- S. Lim, H. Horiuchi, A. D. Nikolov and D. Wasan, Langmuir, 2015, 31, 5827–5835 CrossRef CAS PubMed.
- S. Al-Anssari, A. Barifcani, S. Wang, L. Maxim and S. Iglauer, J. Colloid Interface Sci., 2016, 461, 435–442 CrossRef CAS PubMed.
- C. Dai, X. Wang, Y. Li, W. Lv, C. Zou, M. Gao and M. Zhao, Energy Fuels, 2017, 31, 2663–2668 CrossRef CAS.
- R. N. Moghaddam, A. Bahramian, Z. Fakhroueian, A. Karimi and S. Arya, Energy Fuels, 2015, 29, 2111–2119 CrossRef.
- J. Zhang, Q. Di, S. Hua, F. Ye, Y. Li and W. Wang, Pet. Explor. Dev., 2018, 45, 910–917 CrossRef.
- D. T. Wasan and A. D. Nikolov, Nature, 2003, 423, 156–159 CrossRef CAS PubMed.
- A. Nikolov, K. Kondiparty and D. Wasan, Langmuir, 2010, 26, 7665–7670 CrossRef CAS PubMed.
- K. Kondiparty, A. D. Nikolov, S. Wu and D. T. Wasan, Langmuir, 2011, 27, 3324–3335 CrossRef CAS PubMed.
- H. Zhang, T. S. Ramakrishnan and A. Nikolov, J. Colloid Interface Sci., 2017, 511, 48–56 CrossRef PubMed.
| This journal is © The Royal Society of Chemistry 2023 |

