DOI:
10.1039/D2RA06844C
(Paper)
RSC Adv., 2023,
13, 7372-7379
Simultaneous precipitation and discharge plasma processing for one-step synthesis of α-Fe2O3–Fe3O4/graphene visible light magnetically separable photocatalysts†
Received
29th October 2022
, Accepted 21st February 2023
First published on 7th March 2023
Abstract
A novel facile combination of precipitation and plasma discharge reaction is successfully employed for one-step synthesis of an α-Fe2O3–Fe3O4 graphene nanocomposite (GFs). The co-existence and anchoring of hematite (α-Fe2O3) and magnetite (Fe3O4) nanoparticles onto a graphene sheet in the as synthesized GFs were verified by results of XRD, Raman, SEM, TEM, and XPS. HRTEM characterization was used for confirming the bonding between α-Fe2O3/Fe3O4 nanoparticles and the graphene sheet. Consequently, GFs shows superior photodegrading performance towards methylene blue (MB), compared to individual α-Fe2O3/Fe3O4 nanoparticles, as a result of band gap narrowing and the electron–hole pair recombination rate reducing. Moreover, GFs allows a good possibility of separating and recycling under an external-magnetic field, suggesting potential in visible-light-promoted photocatalytic applications.
1. Introduction
In recent years, magnetic metal oxides such as Fe3O4 and Fe2O3 have drawn increased attention, which is attributed to their high saturation magnetization and wide light absorption area.1,2 Due to these properties, magnetic materials can be used for magnetic separation and photocatalysis. However, there are bottle necks remaining such as a fast electron–hole recombination rate and poor conductivity which have limited them for application in many sectors.3–5 Therefore, many approaches to improve FexOy photocatalytic ability under visible light irradiation have been offered such as creating defects in the material structure,6 doping with metal or non-metal atoms7 and/or coupling with carbon-based materials.8–10 The synergistic effects of two different materials coexist which enlarge their properties compared to those of individual components.11,12 Among them, graphene/metal oxide nanocomposites (GMOs) have been intensively studied as photocatalysts for removing pollutants from water owing to the improving of the photocatalytic activity and enhancing of the stability and suppressing the photo-corrosion.13–15 For example, a core-satellite and dumbbell-like Fe3O4@C–Ag composites were reported by Wang et al. using a solvothermal process. The metal–carbon interfaces were contributed in the high catalytic recyclable performance for the degradation of RhB.16 In another research, the Fe3O4/rGO was prepared by a co-precipitation and reduction process.17 This composite revealed 3.7 times higher adsorption capacity for RhB and 30 times faster adsorption rates than those of activated carbon. For further improvement, ternary materials based on iron oxide were also explored using various methods to take advantage of the superior properties of the individual materials.10,18 For example, B. Saiphaneendra and his group reported the rGO supported (α-Fe2O3 and Fe3O4) nanocomposite material which revealed the good absorption and high reusability of the composites due to the synergistic of hematite and magnetite nanoparticles on graphene sheet.10 Typically, a lot of methods is designed to prepare the above-mentioned nanocomposite, such as solution mixing,19 sol–gel,20,21 hydrothermal/solvothermal method,22 self-assembly,23,24 etc. However, these aforementioned methods still have obvious drawbacks such as complicated procedure, long-time reaction, high temperature, and high-pressure requirements. For example, the sol–gel or solvothermal/hydrothermal routes typically require complicated conditions and high temperatures. Sol–gel approach has the time limitations. In addition, the Hummers' method required to prepare GO (rGO), a precursor material, often causes secondary pollution due to the involvement of redox agents or toxic solvents. Hence, the development of an one-step method for preparing GMOs at room temperature and under mild conditions is currently a technical challenge.
In this study, we propose a novel coupling precipitation reaction and discharge plasma processing for one-step synthesis of an α-Fe2O3–Fe3O4/graphene nanocomposite (GFs). This synthesis approach enables the in situ formation and decoration of α-Fe2O3–Fe3O4 onto the surface of the electrochemically exfoliated graphene sheets under an atmospheric environment. The as-synthesized GFs exhibited improved in visible-light absorption and charge separation through DRS, PL, EIS and methylene blue photodegradation of GFs under visible light irradiation with highly efficient magnetic separation. This simple approach opens the suitable and economically viable production of visible-light driven and magnetically recyclable nanocomposites for the various applications.
2. Materials and methods
2.1. Materials
All chemicals used are analytical chemicals: iron(III) sulfate hydrate (Fe2(SO4)3·xH2O), iron(II) sulfate heptahydrate (FeSO4·7H2O), sodium hydroxide (NaOH), sodium sulfate (Na2SO4), methylene blue (MB) dyes, high purity graphite rod (99.999%, 150 mm length and radius of 6 mm) was purchased from Sigma-Aldrich.
2.2. Fabrication of iron oxides
Fe2(SO4)3·xH2O (7.99 g) and FeSO4·7H2O (2.78 g) were dissolved in 150 mL of distilled water, followed by magnetic stirring at 60 °C for 30 minutes. The mixture was then slowly dripped into a beaker containing 200 mL NaOH 0.5 M, which was ultrasonically vibrated for 2 hours. After the reaction time, the reddish brown resulting mixture was filtered, and the solid product was washed several times with distilled water and dried at 80 °C for 24 hours. This material is identified as FexOy (iron oxide), and it is stored and used in further experiments.
2.3. Fabrication of graphene/iron oxide composites
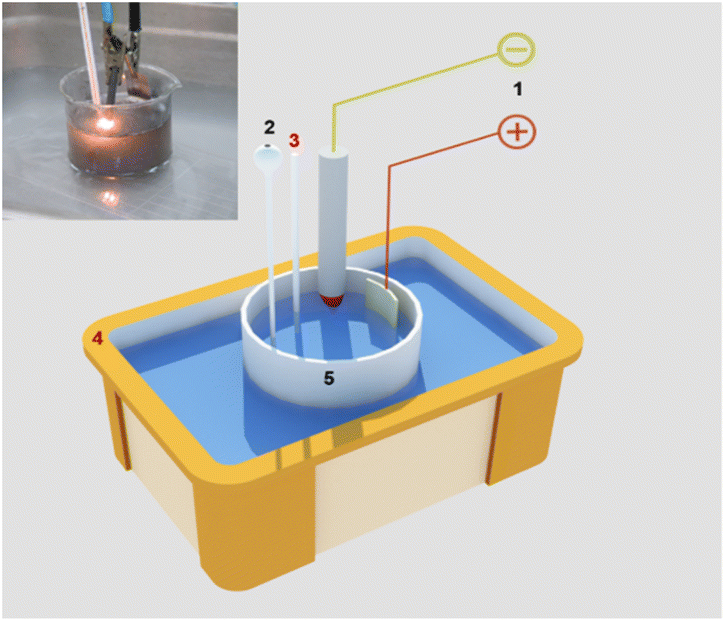
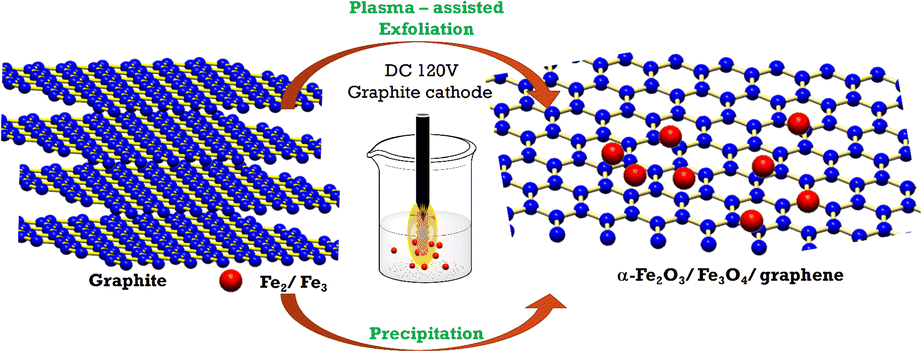
Fig. 1 illustrates the graphene/iron oxide composite fabrication model. Accordingly, the entire two electrode electrochemical system includes a cathodic graphite rod and anodic platinum foils set into a flask of electrolyte solution which is placed in an ultrasonic vibrating tank. In the meantime, the mixture of Fe2(SO4)3·xH2O (7.99 g) and FeSO4·7H2O (2.78 g) was dissolved in 150 mL of distilled water. We maintained this mixture solution at 60 °C for 30 min under a slight stirring level of 100 RPM. First, the sharpened graphite rod is located about 1 mm to 2 mm above the electrolyte solution level. The anode platinum foil was embedded at 5 cm depth in the electrolyte solution. The using electrolyte solution is 200 mL NaOH 0.5 M. Secondly, a direct current (DC) source with a voltage of 120 V was applied to two electrodes. The sharpened tip of the graphite rod was descended gradually into electrolytes which induced the plasma zone at the electrolyte touching position under the high asymmetric electric field. Then, the mixture solution of Fe3+ and Fe2+ was slowly added to the electrolyte solution at a drop rate of 2 mL min−1 when the plasma discharge and ultrasonic vibration were performing. The composites materials of GFs were simultaneously generated by the flow of electrons from the negative electrode to be discharged directly and the solution plasma conditions. This experiment was performed in 75 min. The as-prepared materials were collected by the filtration system using the PVDF membrane with the pore size of 0.2 μm. The resulting powder was washed in distilled water at least 3 times and then dried 24 hours at 80 °C in air. The obtained composite material is denoted as GF and using for further characterization.
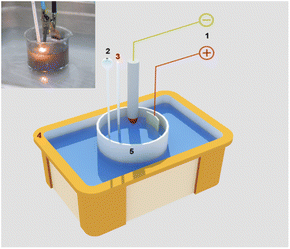 |
| | Fig. 1 Illustration of the experimental setup for graphene/iron oxide composites material fabrication. | |
2.4. Measuring equipment
X-ray diffraction patterns were used to investigate the structural changes of the fabricated samples (D2 PHASER Machine). The morphology of the samples was investigated by a scanning electron microscope (JEOL JSM – 6700F) and a transmission electron microscope (JEM-F200). The covalent and atomic bonds in the material were analyzed by X-ray photoelectron spectroscopy method (09A2 U5-spectroscopy beam line for XPS, Hsinchu, Taiwan). Raman spectroscopy was performed using a Labram HR evolution raman spectrometer (Horiba, Japan). The optical properties of samples were characterized by V770 UV-vis spectrophotometer (Jasco, Japan), Nicolet iS50 FTIR spectrometer (Thermo scientific, American), and Fluorolog-QM fluorescence spectrophotometer (Horiba, Japan). The magnetic properties and saturation magnetization were recorded using a VSM (MicroSence EZ9). Electrochemical impedance spectra (EIS) were conducted using an Autolab workstation PGS 302N assembly with Pt counter electrode, Ag/AgCl electrode, reference electrode, and GF-coated carbon paper working electrode. The working electrode was fabricated by dripping 100 μL of a mixed solution of GF, carbon black and polyvinylidene difluoride (PVDF) with the ratio 80![[thin space (1/6-em)]](https://www.rsc.org/images/entities/char_2009.gif) :10:10 in N-methyl pyrrolidinone solvent at a concentration of 10 mg mL−1 on carbon paper substrate (with the surface area of 1 cm2) then dried at 50 °C for 12 hours. The solution used in the EIS measurements is Na2SO4 1 M.
:10:10 in N-methyl pyrrolidinone solvent at a concentration of 10 mg mL−1 on carbon paper substrate (with the surface area of 1 cm2) then dried at 50 °C for 12 hours. The solution used in the EIS measurements is Na2SO4 1 M.
2.5. Photocatalytic experiments
A small amount of methylene blue – MB (3 mg) was dissolved in 150 mL of distilled water to generate a solution with a concentration of 20 ppm. After that an amount of 0.02 g as-prepared materials (FexOy or GF) was added into the MB solution. Then, the mixture was magnetically stirred for 30 minutes to achieve adsorption–desorption equilibrium. After that, the photocatalytic experiment was performed by illuminating a 400 W xenon lamp coupling with 400 nm UV filter into the mixture solution. A little volume of the reaction mixture (1.5 mL) was collected at every 15 minutes, centrifuged for 10 minutes at 6000 rpm, and analyzed by UV-vis absorption spectra to determine the concentration of MB in solution through absorbance measurements at 664 nm.
3. Results and discussion
3.1. Structural and morphological characterizations
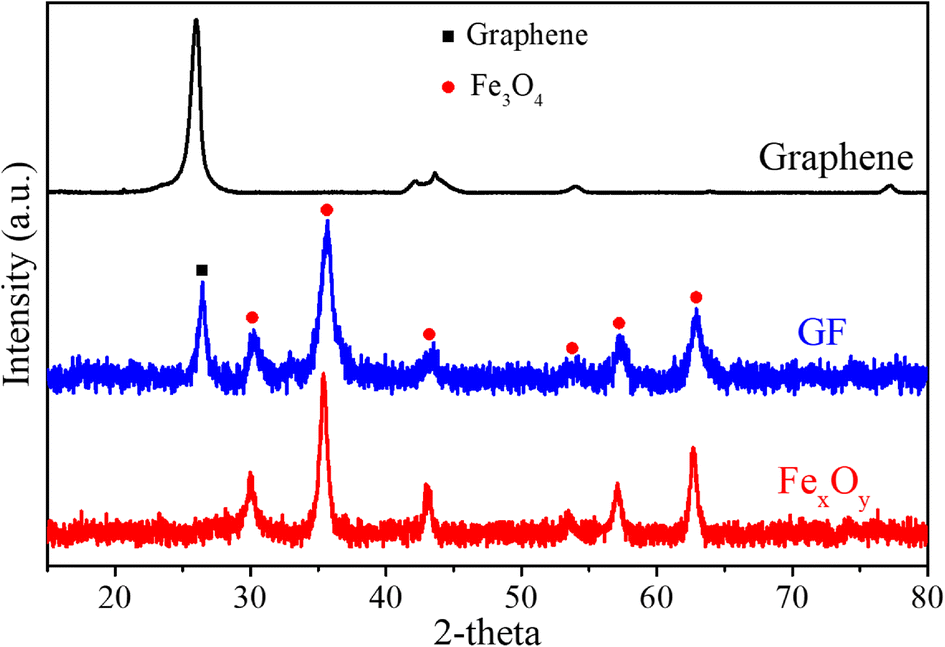
Fig. 2 shows XRD pattern of graphene, FexOy and GF composite samples, respectively, measured in the 2 theta angle range of 10° to 80°. The evidence diffraction peaks located at 26° reveals the purity of graphene corresponded to (002) plane of graphene structure.25,26 As compared to the FexOy pattern, the peaks at 26° reflected the existence of graphene in GF samples. On the other hand, six obvious diffraction peaks in the patterns of both FexOy and GF samples at 30.1°; 35.5°; 43.1°; 53.5°; 57.05°; 62.7° corresponding to the crystal planes (220); (311); (222); (422); (511) and (440) of Fe3O4 structure with lattice constant a = 8.378 Å, b = 8.378 Å, c = 8.378 Å, α = 90°, β = 90° and γ = 90°. The relatively sharp diffraction peaks in the FexOy and GF samples demonstrate the fine crystallization of Fe3O4. However, the α-Fe2O3 composition has not been clearly recognized. This may be due to peak overlap between α-Fe2O3 and Fe3O4, and/or can be assigned to the more sensitivity of Fe3O4 than those of α-Fe2O3 or probably because of incomplete crystallization of α-Fe2O3. This opinion will be confirmed by the further characterization.
 |
| | Fig. 2 XRD pattern of graphene, FexOy and GF composite samples. | |
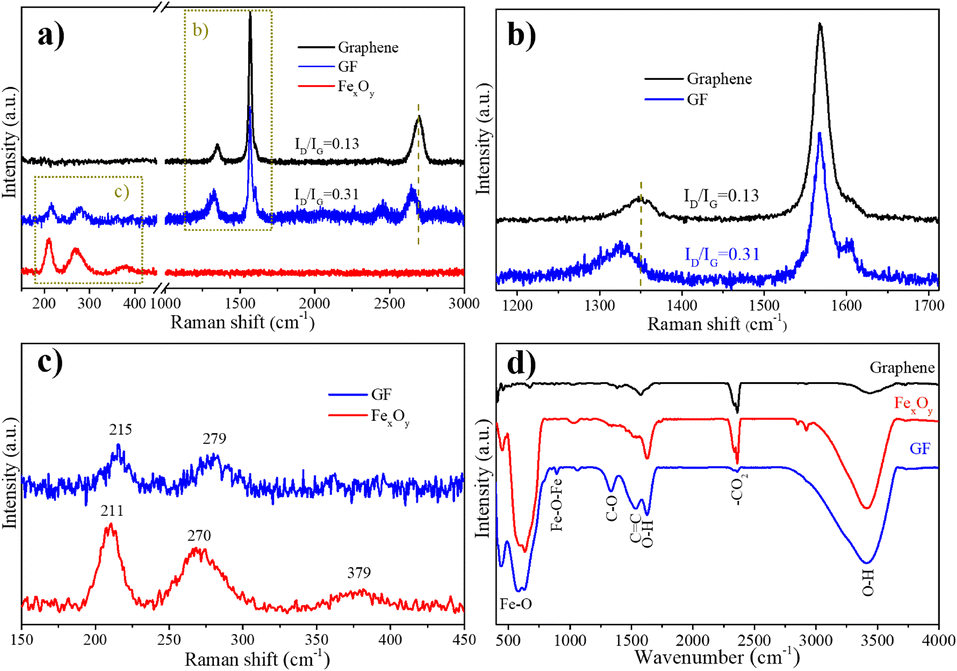
Raman spectra can provide additional information on the structural material. Fig. 3(a) displays Raman spectra of graphene, FexOy, and GF composite samples, respectively. Graphene samples with characteristic peaks at 1352 cm−1, 1567 cm−1, and 2698 cm−1 corresponded to the D, G, and 2D bands, respectively.27 The strong symmetric 2D band peak at 2698 cm−1 indicated common vibration of ordered sp2− hybridized carbon atoms by the E2g phonon mode, which revealed the high quality of graphene. Peaks at 211 cm−1, 270 cm−1, and 379 cm−1 in the FexOy sample were assigned to one oscillation mode A1g and two modes Eg of iron oxide, respectively.28,29 In addition, the appearance of the peak at 215 cm−1 and 279 cm−1 in the Raman spectra of the GF revealed the coexistence of the Fe3O4 in the GF structure30 (Fig. 3(c)). Moreover, the characteristic peaks for graphene in GF were slightly shifted to 1352 cm−1 (D band), 1567 cm−1 (G band), and 2652 cm−1 (2D band), respectively (Fig. 3(a and b)). Notably, the 2.38 time higher of ID/IG intensity ratio (0.31) of GF than that of graphene samples (0.13) related to the increasing of disorder in the carbon network structure of graphene. This result can be attributed to the binding of FexOy with the graphene. Thus, the coexistence of the Fe3O4 and graphene peaks in the Raman result, as well as the previous XRD result, it can be expected that the composites at least two components: Fe3O4 and graphene.
 |
| | Fig. 3 (a), (b), and (c): Raman spectra of FexOy, graphene, and GF composite samples; (d) FTIR spectrum of graphene, FexOy, and GF samples. | |
Fig. 3(d) depicts the Fourier-transform infrared spectroscopy (FTIR) of graphene, FexOy, and GF samples, which are measured in the 400–4000 cm−1 range. In all three samples, the wide peaks at ∼3418 cm−1 and 1628 cm−1 are attributed to the stretching and bending vibrations O–H of H2O,31 respectively; the 2360 cm−1 peak is also due to CO2 binding.32 For the graphene sample, in addition to the adsorption peak characteristic for the presence of the C![[double bond, length as m-dash]](https://www.rsc.org/images/entities/char_e001.gif) C bond in the sample at 1576 cm−1, the peaks are characteristic of the C–OH bond (1381 cm−1), carboxyl CO (1419 cm−1), epoxy CO (1219 cm−1) were also found.33 The peaks at 628 cm−1, 586 cm−1, and 451 cm−1 on both the FexOy and the GF – combinant samples are assigned to the stretching mode of the Fe–O bond, indicating that they both have an iron oxide component. Compared to the FexOy sample, the GF sample also showed more peaks at 891 cm−1, 1335 cm−1, and 1535 cm−1, corresponding to CC, C–O, and Fe–O–Fe bridges, respectively. The shift of the CC peak from 1576 cm−1 (graphene) to 1535 cm−1 (GF) is attributed to the incorporation of iron oxide into the graphene lattice.
C bond in the sample at 1576 cm−1, the peaks are characteristic of the C–OH bond (1381 cm−1), carboxyl CO (1419 cm−1), epoxy CO (1219 cm−1) were also found.33 The peaks at 628 cm−1, 586 cm−1, and 451 cm−1 on both the FexOy and the GF – combinant samples are assigned to the stretching mode of the Fe–O bond, indicating that they both have an iron oxide component. Compared to the FexOy sample, the GF sample also showed more peaks at 891 cm−1, 1335 cm−1, and 1535 cm−1, corresponding to CC, C–O, and Fe–O–Fe bridges, respectively. The shift of the CC peak from 1576 cm−1 (graphene) to 1535 cm−1 (GF) is attributed to the incorporation of iron oxide into the graphene lattice.
Fig. 4 presents the SEM and TEM images of FexOy and GF for morphology investigation. The SEM images of FexOy and GF are shown in Fig. 4(a and b), respectively. The uniform spherical FexOy nanoparticles tend to agglomerate to form clusters. After a discharge plasma of graphite rod in the Fe2+/Fe3+ precursor solution, the graphene nanosheets were decorated by the clusters of FexOy nanoparticles as displayed in the SEM image of GF sample. Fig. 4(c–f) show the low and high resolution TEM images of the FexOy and GF samples. The spherical particles observed in both FexOy and GF samples with size ranging from 5 to 10 nm as shown in Fig. 4(c and d). This result revealed that the morphology and size of FexOy nanoparticles were maintained under the high energy of the discharge plasma. Furthermore, the uniform FexOy particles surrounding the ultrathin graphene nanosheets were evidently shown in the TEM image of GF (Fig. 4(d)). In addition, the detail lattice structure of FexOy and GF were investigated by the HRTEM images as presented in Fig. 4(e and f). From the edges of graphene nanosheets in the Fig. 4(f), the Fast Fourier transform (FFT) was used to determine the layer dispacing of 0.37 nm correspond to (002) lattice plane of graphene nanosheets. This result is larger than that of the theoretical value which attributed to the discharge plasma distorted the weak van der Waals bonding of graphite. Interestingly, the α-Fe2O3 ((104) lattice plane) and Fe3O4 ((220) lattice plane) structures assigned to the corresponding lattice dispacing of 0.27 and 0.31 nm coexist in both FexOy and GF samples. This result reveals that our method offers an effective route to build the multipurpose ternary composite of graphene/FexOy.
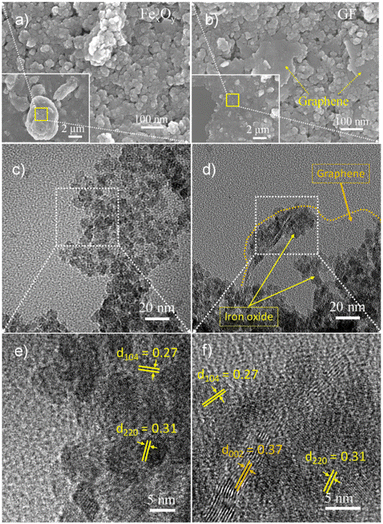 |
| | Fig. 4 SEM images of (a) FexOy, (b) GF; low-magnification TEM images of (c) FexOy, (d) GF; HRTEM images of (e) FexOy, (f) GF. | |
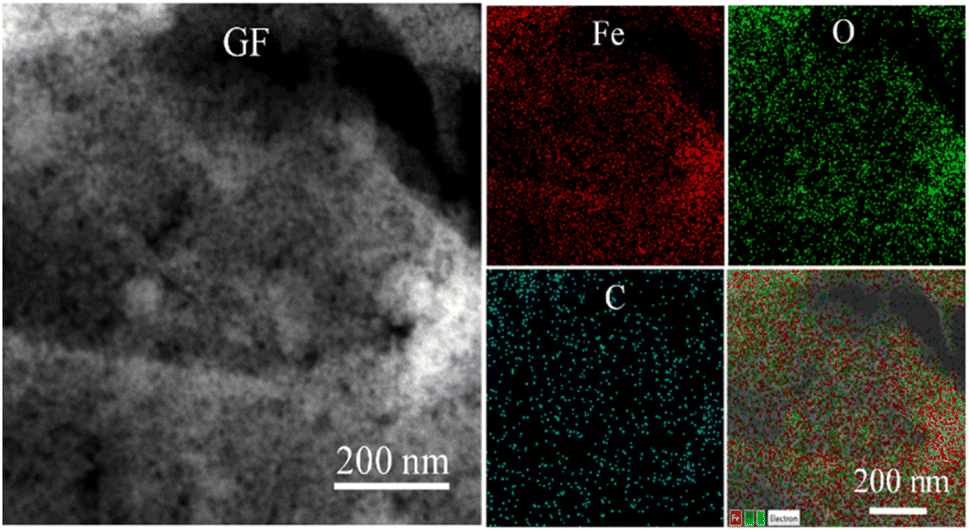
Fig. 5 shows the dark-field STEM of GF and its corresponding EDS element mapping. The uniform distribution of Fe in the red color and the O in the green color located on the carbon in the cyan color were confirmed. These results highly agreed with the TEM results of GF.
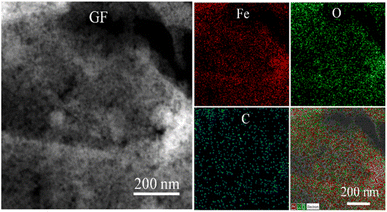 |
| | Fig. 5 Dark-field STEM of GF and its corresponding EDS element mapping. | |
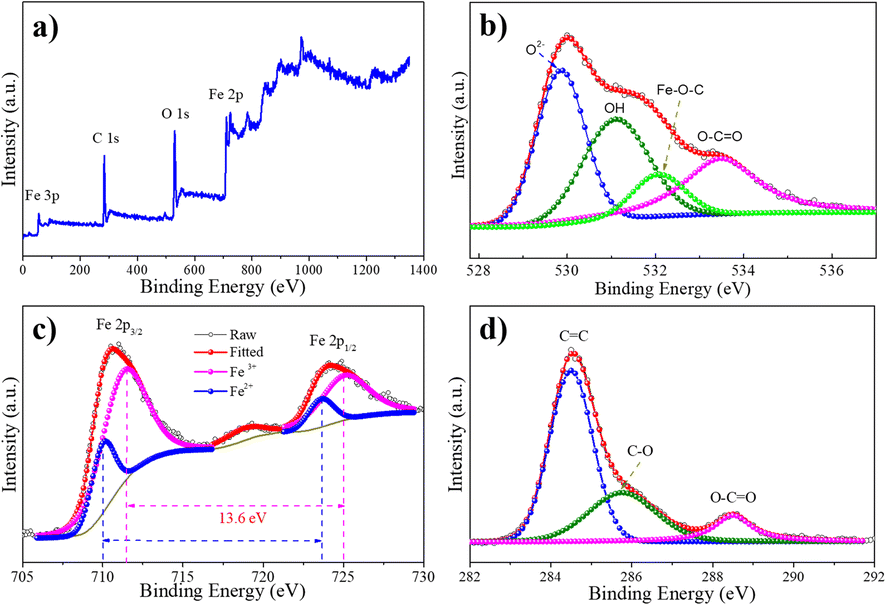
X-ray photoelectron spectroscopy (XPS) measurement was utilized to further probe the chemical composition of GF. Fig. 6 depicts the XPS spectrum of the GF composite sample. The peaks locate at 55 eV, 284.5 eV, 530 eV, 710 eV, and 723 eV in the survey spectrum of the GF sample correspond to Fe 3p, C 1s, O 1s, and Fe 2p, respectively, indicating the presence of the elements C, O, and Fe (Fig. 6(a)). The O 1s core level XPS spectra can be deconvoluted into four peaks by the Gaussian fitting, as displayed in Fig. 6(b). The peaks corresponding to the binding energies of 529.8, 531.1, and 533.5 eV can be ascribed to the O2−, O–H, and O–CO components, respectively. Moreover, the formation of Fe–O–C bonding can be attributed to the peak at 532.1 eV.34,35 This result can be interpreted as a demonstration of the bond formation between FexOy and the graphene plane via functional groups on the graphene surface. Therefore, the plasma energy not only provides graphene nanosheets for the composite but also induces the chemical bonding of graphene and FexOy structure to form the multipurpose ternary composite. In Fig. 6(c), the high resolution core level of Fe 2p spectrum displays a pair of peaks at 710.3 eV and 724.3 eV assigned to Fe 2p3/2 and Fe 2p1/2, respectively. With using the split energy of 13.6 eV, the double peaks fitting at 711.4, 725 eV, and 710, 723.6 eV correspond to the core level of Fe3+ and Fe2+, respectively.36,37 This result is highly agreed with the HRTEM analysis. In particular, the elemental ratio of 3.55/1 from XPS results in estimation compared to the ionic precursor ratio of 4/1 for Fe3+/Fe2+ highly revealed the controllability of this approach. The XPS C 1s spectrum of the GF sample in Fig. 6(d) was analyzed into three components corresponding to the oxygen-free group CC sp2 (284.5 eV), the epoxy group, and the alkoxyl group C–O (285.2 eV) and the carboxylate group O–CO (288.5 eV).
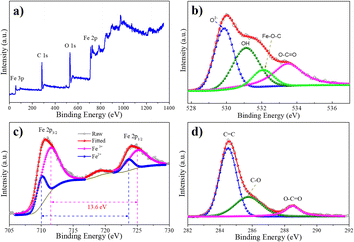 |
| | Fig. 6 XPS spectra of the samples: (a) survey, (b) O 1s, (c) Fe 2p, and (d) C 1s. | |
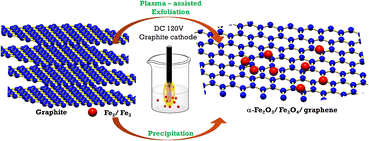
3.2. Mechanism of material formation
Fig. 7 illustrates the mechanism of the formation of graphene/iron oxide composite material. First, the strong asymmetry electric field between the graphite cathode tip and the electrolyte (liquid electrode) knocks on electrons out of the cathode interfaces. These electrons move under the influence of the strong electric field and then ionizes the air, resulting in plasma formation in the volume between the cathode and the electrolytes. Ions, radicals and photons are mainly generated in the plasma region. The collision of ions and oxidized radicals with not only the graphite electrode but also the electrolyte surface increases the temperature at this region. Meanwhile, the increasing temperature, combined with the intercalation of ions and oxidized radicals into the graphite structure, breaks the weak van der Waals bonding leading to exfoliating graphene sheets from the graphite electrode. In addition, oxygen-containing functional groups may be added in the meantime.
 |
| | Fig. 7 Illustration of mechanism of forming GF composites by ultrasonic assisted plasma electrochemical method. | |
When dripping the solution mixture (Fe2+/Fe3+) in an alkaline medium, Fe2+ and Fe3+ are converted into Fe(OH)2, Fe(OH)3, and FeOOH. Further reactions form Fe3O4 or Fe2O3 under plasma conditions as follows.
| | |
2Fe3+ + Fe2+ + 8OH− → Fe3O4 + 8H2O
| (1) |
The graphite layers were being peeled off to form graphene at the same time as the iron salt solution mixture was added to an alkaline environment. The shear force caused by the ultrasonic wave continues to separate the graphene layers while also assisting the FexOy nanoparticles in rapidly depositing and evenly dispersing the FexOy nanoparticles on the graphene film. Under the influence of plasma, the reaction process can combine iron oxide with functional groups on rGO to create graphene/Fe2O3/Fe3O4 composite material.
3.3. Magnetic properties
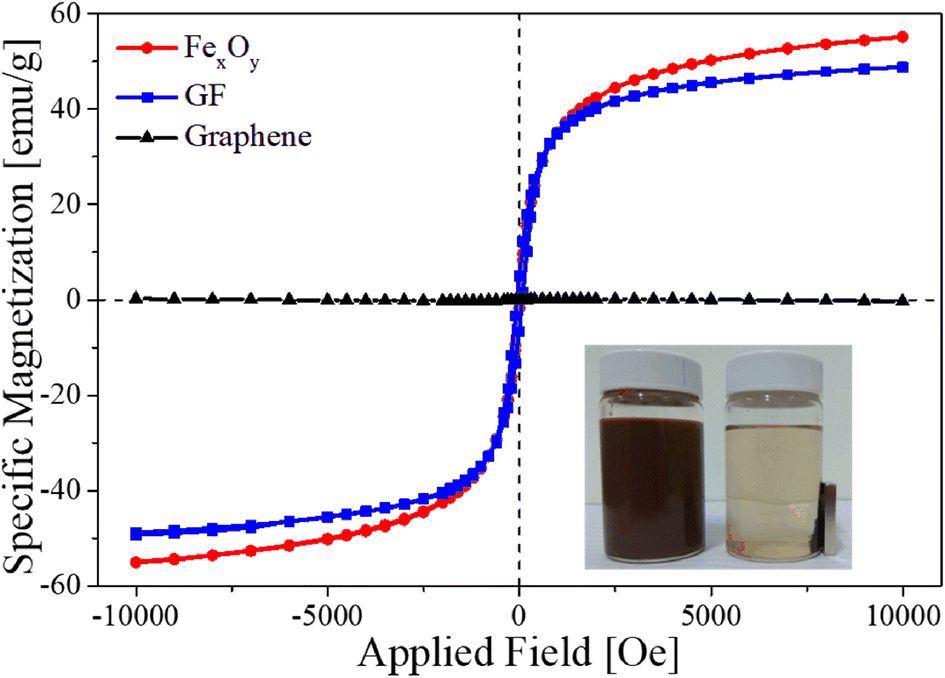
Fig. 8 shows the magnetization hysteresis loop of the FexOy, GF composite, and graphene sample measured in the magnetic field from −10000 to 10000 Oersted at room temperature. The iron oxide and GF samples have saturated magnetizations of 55.1 emu g−1 and 48.8 emu g−1, respectively. The reduction of saturation magnetization in GF samples comes from the non-magnetic phase of graphene. Interestingly, GF exhibited good magnetic recovery from solution by applying an external magnetic field, as shown in the inset inside Fig. 8. The material was carefully re-collected by a recycling process (see ESI† for additional details). These results showed that GF could be an excellent candidate for practical wastewater treatment.
 |
| | Fig. 8 The magnetization dependence of the FexOy, GF and graphene samples on the applied magnetic field at room temperature. | |
3.4. Photocatalytic activity
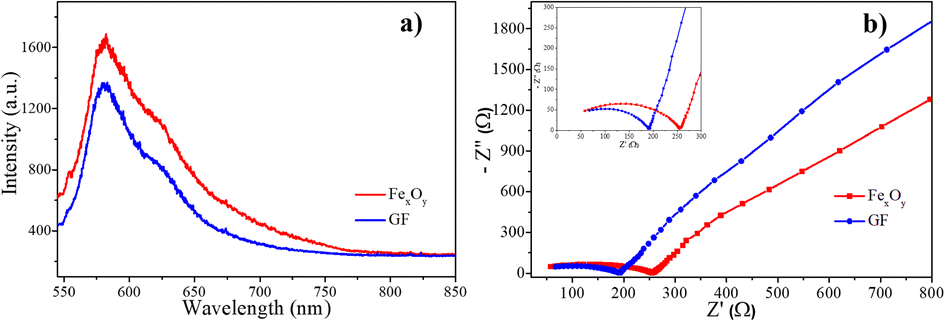
The recombination of charge carriers has a significant influence on the material's photocatalytic activity. Photoluminescence (PL) spectroscopy was used to investigate the charge carrier transfer and electron–hole recombination processes. In addition, electrochemical impedance spectroscopy (EIS) is a useful method for the charge-carrying properties of materials investigation. Fig. 9 shows the photoluminescence spectroscopy (PL) under the wavelength exciton of 325 nm and electrochemical impedance spectroscopy (EIS) of FexOy and GF samples at room temperature. PL spectrum of GF showed a similar curve as that of FexOy with the decreased peak intensity as display in Fig. 9(a). This result is related to the higher electron–hole recombination rate of FexOy than that of GF due to the interface charge transfer from FexOy to graphene. Therefore, combining iron oxide nanoparticles with graphene in an ultrasonic-assisted plasma electrochemical process prevents electron–hole pair recombination efficiently, which is beneficial to GF photocatalytic activity. EIS measurements were carried out on both FexOy and GF composite samples coat on the carbon paper substrate in the frequency range of 100 mHz to 100 kHz (Fig. 9(b)). The EIS plots of the composite GF samples have smaller arcs than the FexOy samples, which correspond to lower values of charge transfer resistance. This suggests that mixing iron oxide and graphene makes the composite material more conductive than the bare material. As a result, in the GF composite sample, the charges created during photocatalysis will be easier to separate. This result is highly agreed with the PL results above.
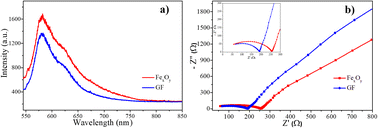 |
| | Fig. 9 (a) Photoluminescence spectroscopy (PL) and (b) electrochemical impedance spectroscopy (EIS) of FexOy and GF samples. | |
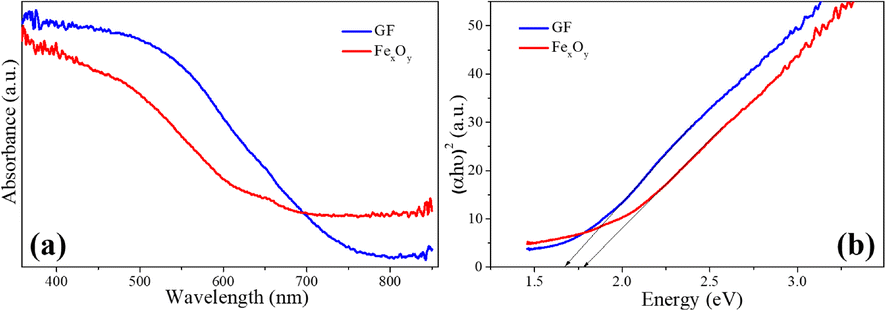
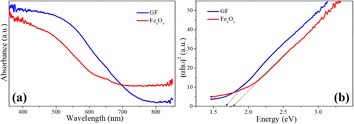
Fig. 10 displays the UV-vis absorption spectra of the FexOy, GF composite samples (Fig. 10(a)) and the corresponding Tauc plots for these samples (Fig. 10(b)). The GF composite sample exhibits better light absorption than the iron oxide sample with a wavelength of less than 700 nm. The band gap energies calculated for FexOy, GF samples according to the Kubelka–Munk equation are 1.65 eV and 1.76 eV, respectively. This is also shown in Fig. 10(b). These results indicate that the samples absorb light well in the visible range; the GF composite material has a synergistic effect between iron oxide and graphene, leading to better light absorption in the visible region than the iron oxide material.
 |
| | Fig. 10 (a) UV-vis absorption spectra; and (b) Tauc plots of the FexOy, GF composite samples. | |
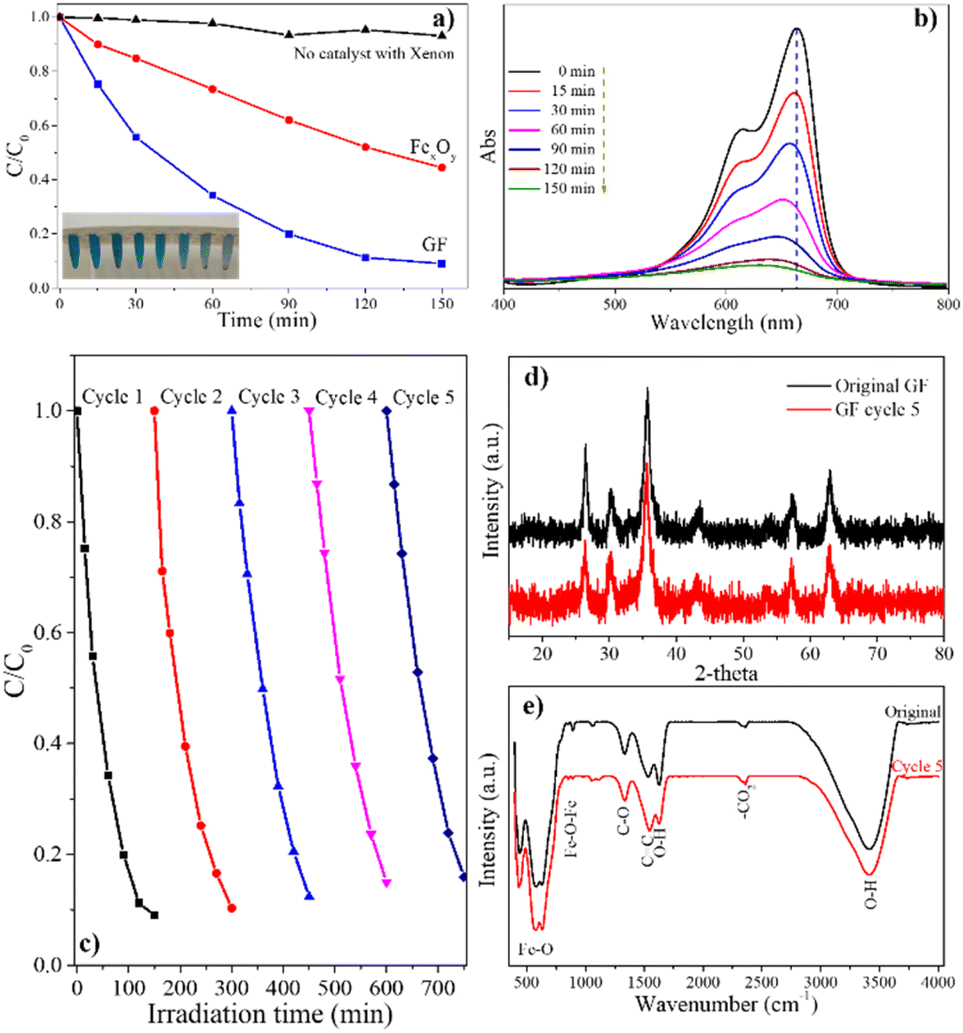
Fig. 11 depicts the photocatalytic activity of the sample as determined by MB dye degradation under the illumination of a xenon lamp for 150 minutes. Changes in the characteristic peak intensity of MB at 664 nm were used to evaluate MB efficiency degradation. Clearly, the typical peak of MB at 664 nm was dramatically decreased and slightly shifted to a small wavelength related to the progressive decomposition of MB (Fig. 11(b)). For comparison, MB photodegradation without the catalyst material was performed. Only 6.8% MB was decomposed in 150 min illumination as the dark curve in Fig. 11(a). Whereas, the degradation of MB with FexOy material is 55.5%. Furthermore, the GF composite shows 1.64 times higher MB decomposite ability than that of FexOy at 91%. It is found that the graphene surface significantly increased the photocatalytic activity of FexOy. The iron oxide nanoparticles are well dispersed on the graphene surface, increasing the catalytic material's light exposure, increasing electron–hole pairing ability, and reducing recombination. More ever, the sustainability of GF was further evaluated with the solar light photocatalytic activities of samples after five cycles, revealing a slight decrease (91–84%) in the photodegradation performance (Fig. 11(c)). The effect of the Fe3+/Fe2+ ratio was investigated using different precursor ratios of 3:1, 4:1, and 5:1 to prepare samples GF3, GF, and GF5, respectively. The XRD pattern of these samples exhibits a similar typical peak of graphene and Fe3O4 (Fig. S2†). Moreover, the photodegradation efficiency comparison of these samples shows that the optimal ratio of Fe3+/Fe2+ is 4:1 as shown in Table S3.† In addition, these photocatalysts also indicate no observable changes in the XRD in FTIR spectra of the before and after the five times reused samples (Fig. 11(d and e)). In addition, the leaching of iron in the solution was estimated as shown in Tables S1 and S2.† In particular, a minor of less than 0.2% amount of iron was leached after each recovery shows the stability of graphene/FexOy composite through the photocatalyst process. These results showed that GF could be an excellent candidate for practical wastewater treatment.
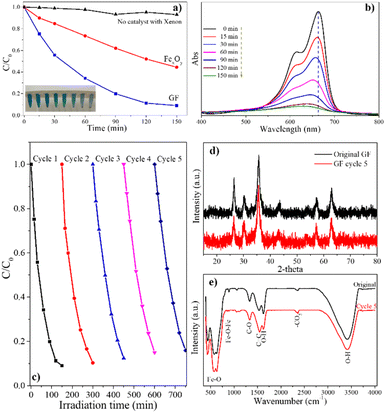 |
| | Fig. 11 (a) Compare the photocatalytic degradation of methylene blue dye with the catalysts of FexOy and GF, pH = 7; (b) the photocatalytic degradation of methylene blue dye with the catalyst GF, pH = 7; (c) five cycles of photocatalytic degradation of MB in the present of GF, (d) XRD patterns and (e) FTIR spectra of GF before and after five cycles of photodegradation of MB. | |
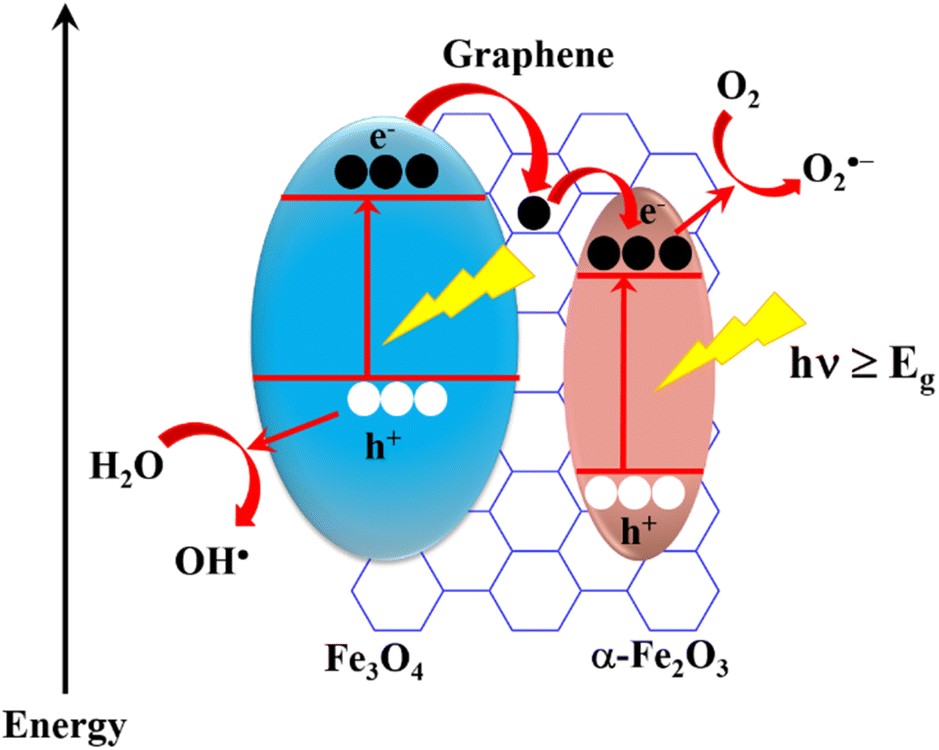
From the received results, it can be seen that the photocatalytic activity of the GF composite is much larger than that of the bare FexOy. An energy band diagram was created to explain the lower rate of charge recombination in the composite materials as shown in Fig. 12. Accordingly, the EV, EC, and Eg energy levels generated are consistent with previous report.38 When a suitable wavelength of light is incident on the GF material, electrons from the valence band (VB) jump to the conduction band (CB) and produce electron–hole pairs in both α-Fe2O3 and Fe3O4. Due to the difference in EC and EV levels of α-Fe2O3 and Fe3O4, electrons from Fe3O4 can direct transfer to α-Fe2O3 or transfer to α-Fe2O3 through graphene. The high electrical conductivity of graphene facilitates this process, leading electron–hole pairs to separate more easily and the charge recombination rate to decrease, then improving photocatalytic efficiency. This process is represented as follows:
| rGO/Fe2O3/Fe3O4 (GF) + hν → (x)h+ + (x)e− |
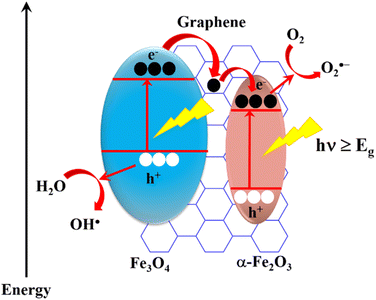 |
| | Fig. 12 Diagram of the photocatalytic degradation of MB with GF. | |
The formation of electron–hole pairs is the beginning of the photocatalytic reaction. The electrons or holes created during photocatalysis can participate in a series of subsequent reactions to form chemical radicals (OH˙−, O2˙−, HO2˙, OH˙, H2O2).1 When chemical radicals react with MB, the decomposition products CO2 and H2O are produced:
| MB + (OH˙−, O2˙−, HO2˙, OH˙, H2O2) → CO2 + H2O |
| Or MB + GF → GF + CO2 + H2O |
Table 1 exhibits the photocatalytic performance comparison of the GFs with those of the literature reported. Compared to other leading materials, GFs show good performance.
Table 1 The photocatalytic performance comparison with previous reports
| Photocatalysts |
Amount of material (mg) |
Dyes |
Concentration |
Time (min) |
Illumination power |
Efficiency |
Ref. |
| α-Fe2O3/graphene |
30 |
RhB |
10 mg L−1 |
20 |
Xenon 350W |
98% |
39 |
| α-Fe2O3–Fe3O4-M-GP |
10 |
MO |
20 mg L−1 (20 mL) |
240 |
Xenon 300W |
100% |
40 |
| Fe2O3/TiO2 |
2000 |
MB |
25 mg L−1 (80 mL) |
300 |
Iodine tungsten lamp 300W |
88% |
41 |
| α-Fe2O3/Fe3O4 |
10 |
CR |
10 ppm (35 mL) |
50 |
Sunlight |
100% |
42 |
| rGO/Fe3O4 |
50 |
MB |
10 ppm (50 mL) |
80 |
Visible light lamp 400W |
98.3% |
43 |
| α-Fe2O3 |
50 |
MB |
10 ppm (100 mL) |
360 |
UV |
78% |
44 |
| γ-Fe2O3/GO |
|
MB |
50 ppm (50 mL) |
60 |
Incandescent filament 60W |
90.6% |
45 |
| α-Fe2O3/Fe3O4/graphene |
20 |
MB |
20 ppm (150 mL) |
150 |
Xenon 400W |
91% |
This work |
4. Conclusion
Magnetically separable ternary graphene/α-Fe2O3/Fe3O4 visible light-driven photocatalyst (GF) was successfully synthesized through a combination of precipitation and low-temperature plasma discharge reaction. Raman, XRD, XPS and HRTEM results confirm the anchoring of iron oxide particles onto the graphene sheet. In comparison with α-Fe2O3 or Fe3O4, α-Fe2O3/Fe3O4/graphene nanocomposite exhibited better sunlight photocatalytic activity in the photodegradation of MB attributed to efficient sunlight harvesting and lower photogenerated electron–hole recombination rate. The received sunlight photocatalytic performance, efficient magnetic separation, and recyclability indicated that the as-synthesized GF could be a promising candidate for visible light driven photocatalytic application.
Conflicts of interest
There are no conflicts to declare.
Acknowledgements
This research is funded by Ministry of Natural Resources and enviroment under grant number TNMT.2022.03.14.
Notes and references
- M. Mishra and D. M. Chun, Appl. Catal., A, 2015, 498, 126–141 CrossRef CAS.
- N. J. Singh, B. Wareppam, S. Ghosh, B. P. Sahu, P. K. Ajikumar, H. P. Singh, S. Chakraborty, S. S. Pati, A. C. Oliveira, S. Barg, V. K. Garg and L. H. Singh, Nanotechnology, 2020, 31, 425703 CrossRef CAS PubMed.
- S. Liu, L. Zheng, P. Yu, S. Han and X. Fang, Adv. Funct. Mater., 2016, 26, 3331–3339 CrossRef CAS.
- L. Yu, Y. Zhang, J. He, H. Zhu, X. Zhou, M. Li, Q. Yang and F. Xu, J. Alloys Compd., 2018, 753, 601–606 CrossRef CAS.
- X. Meng, Y. Xu, X. Sun, L. Xiong and Q. Wang, J. Power Sources, 2016, 326, 389–396 CrossRef CAS.
- A. Kumar, P. Raizada, A. Hosseini-Bandegharaei, V. K. Thakur, V. H. Nguyen and P. Singh, J. Mater. Chem. A, 2021, 9, 111–153 RSC.
- V. Hasija, P. Raizada, A. Sudhaik, K. Sharma, A. Kumar, P. Singh, S. B. Jonnalagadda and V. K. Thakur, Appl. Mater. Today, 2019, 15, 494–524 CrossRef.
- J. Wang, Y. Chen, G. Liu and Y. Cao, Composites, Part B, 2017, 114, 211–222 CrossRef CAS.
- Y. Miao and P. Yang, J. Nanosci. Nanotechnol., 2017, 18, 333–339 CrossRef PubMed.
- B. Saiphaneendra, T. Saxena, S. A. Singh, G. Madras and C. Srivastava, J. Environ. Chem. Eng., 2017, 5, 26–37 CrossRef CAS.
- W. Wong, H. Y. Wong, A. B. M. Badruzzaman, H. H. Goh and M. Zaman, Nanotechnology, 2017, 28, 042001 CrossRef PubMed.
- Q. Wu, Y. Liu, H. Jing, H. Yu, Y. Lu, M. Huo and H. Huo, Chem. Eng. J., 2020, 390, 124615 CrossRef CAS.
- X. Xia, Q. Hao, W. Lei, W. Wang, D. Sun and X. Wang, J. Mater. Chem., 2012, 22, 16844–16850 RSC.
- T. Peik-See, A. Pandikumar, L. H. Ngee, H. N. Ming and C. C. Hua, Catal. Sci. Technol., 2014, 4, 4396–4405 RSC.
- V. Hasija, V. H. Nguyen, A. Kumar, P. Raizada, V. Krishnan, A. A. P. Khan, P. Singh, E. Lichtfouse, C. Wang and P. Thi Huong, J. Hazard. Mater., 2021, 413, 125324 CrossRef CAS PubMed.
- H. Wang, J. Shen, Y. Li, Z. Wei, G. Cao, Z. Gai, K. Hong, P. Banerjee and S. Zhou, ACS Appl. Mater. Interfaces, 2013, 5, 9446–9453 CrossRef CAS PubMed.
- Y. Qin, M. Long, B. Tan and B. Zhou, Nano-Micro Lett., 2014, 6, 125–135 CrossRef CAS.
- R. Kumar, S. M. Youssry, K. Z. Ya, W. K. Tan, G. Kawamura and A. Matsuda, Diamond Relat. Mater., 2020, 101, 107622 CrossRef CAS.
- G. Williams, B. Seger and P. V. Kamat, ACS Nano, 2018, 2, 1487–1491 CrossRef PubMed.
- S. Banerjee, P. Benjwal, M. Singh and K. K. Kar, Appl. Surf. Sci., 2018, 439, 560–568 CrossRef CAS.
- Y. Lan, J. Deng, G. Li and Y. Luo, J. Therm. Anal. Calorim., 2017, 127, 2173–2179 CrossRef CAS.
- Z. Q. Li, H. L. Wang, L. Y. Zi, J. J. Zhang and Y. S. Zhang, Ceram. Int., 2015, 41, 10634–10643 CrossRef CAS.
- F. Wang, X. Yu, M. Ge, S. Wu, J. Guan, J. Tang, X. Wu and R. O. Ritchie, Environ. Pollut., 2019, 248, 229–237 CrossRef CAS PubMed.
- Q. Han, Z. Wang, J. Xia, S. Chen, X. Zhang and M. Ding, Talanta, 2012, 101, 388–395 CrossRef CAS PubMed.
- K. Kakaei, M. D. Esrafili and A. Ehsani, Interface Sci. Technol., 2019, 27, 1–21 Search PubMed.
- K. Krishnamoorthy, M. Veerapandian, L. Zhang and K. Yun, J. Phys. Chem. C, 2012, 116, 17280–17287 CrossRef CAS.
- D. Van Thanh, L. J. Li, C. W. Chu, P. J. Yen and K. H. Wei, RSC Adv., 2014, 4, 6946–6949 RSC.
- Q. Chen, K. Su and M. Zhang, J. Non-Cryst. Solids, 2019, 511, 166–176 CrossRef CAS.
- J. Lu, Y. Zhou, J. Lei, Z. Ao and Y. Zhou, Chemosphere, 2020, 251, 126402 CrossRef CAS PubMed.
- H. Cao, R. Liang, D. Qian, J. Shao and M. Qu, J. Phys. Chem. C, 2011, 115, 24688–24695 CrossRef CAS.
- S. Sagadevan, Z. Z. Chowdhury, M. R. Bin Johan, F. A. Aziz, L. S. Roselin, H. L. Hsu and R. Selvin, Results Phys., 2019, 12, 878–885 CrossRef.
- M. Taraschewski, H. K. Cammenga, R. Tuckermann and S. Bauerecker, J. Phys. Chem. A, 2005, 109, 3337–3343 CrossRef CAS PubMed.
- S. Guo, G. Zhang, Y. Guo and J. C. Yu, Carbon, 2013, 60, 437–444 CrossRef CAS.
- J. Zhou, H. Song, L. Ma and X. Chen, RSC Adv., 2011, 1, 782–791 RSC.
- N. A. Zubir, C. Yacou, J. Motuzas, X. Zhang and J. C. Diniz Da Costa, Sci. Rep., 2014, 4, 1–8 CrossRef PubMed.
- O. Lupan, V. Postica, N. Wolff, O. Polonskyi, V. Duppel, V. Kaidas, E. Lazari, N. Ababii, F. Faupel, L. Kienle and R. Adelung, Small, 2017, 13, 1–10 Search PubMed.
- A. S. Afify, M. Dadkhah and J. M. Tulliani, Ceramics, 2022, 5, 575–592 CrossRef CAS.
- B. Lei, D. Xu, B. Wei, T. Xie, C. Xiao, W. Jin and L. Xu, ACS Appl. Mater. Interfaces, 2021, 13, 4785–4795 CrossRef CAS PubMed.
- S. Han, L. Hu, Z. Liang, S. Wageh, A. A. Al-Ghamdi, Y. Chen and X. Fang, Adv. Funct. Mater., 2014, 24, 5719–5727 CrossRef CAS.
- J. Wang, Y. Chen, G. Liu and Y. Cao, Composites, Part B, 2017, 114, 211–222 CrossRef CAS.
- R. Li, Y. Jia, N. Bu, J. Wu and Q. Zhen, J. Alloys Compd., 2015, 643, 88–93 CrossRef CAS.
- A. Hosseinian, H. Rezaei and A. R. Mahjoub, Eng. Technol., 2011, 52, 736–739 Search PubMed.
- M. Imran, M. M. Alam, S. Hussain, M. A. Ali, M. Shkir, A. Mohammad, T. Ahamad, A. Kaushik and K. Irshad, Ceram. Int., 2021, 47, 31973–31982 CrossRef CAS.
- X. H. Vu, L. H. Phuoc, N. D. Dien, T. T. H. Pham and L. D. Thanh, J. Electron. Mater., 2019, 48, 2978–2985 CrossRef CAS.
- A. Rehman, A. Daud, M. F. Warsi, I. Shakir, P. O. Agboola, M. I. Sarwar and S. Zulfiqar, Mater. Chem. Phys., 2020, 256, 123752 CrossRef CAS.
|
| This journal is © The Royal Society of Chemistry 2023 |
Click here to see how this site uses Cookies. View our privacy policy here. 
 Open Access Article
 This Open Access Article is licensed under a Creative Commons Attribution-Non Commercial 3.0 Unported Licence
 ab,
Tran Quoc Toan*c,
Nguyen Ba Hungd,
Pham Quoc Trieua,
Nguyen Ngoc Dinha,
Danh Bich Doe,
Dang Van Thanh
ab,
Tran Quoc Toan*c,
Nguyen Ba Hungd,
Pham Quoc Trieua,
Nguyen Ngoc Dinha,
Danh Bich Doe,
Dang Van Thanh