 Open Access Article
Effect of carbon addition on the passivity of hypoeutectic high chromium cast irons
Jun-Seob Lee *ab,
Jun-Hyeong Leeb,
Jun-Seok Ohac,
Sung Kangd,
Seung-Hoon Baekd,
Jee Hyuk Ahne,
Seung Zeon Hane and
Je-Hyun Leeab
aSchool of Materials Science and Engineering, Changwon National University, 51140 Changwondaehak-ro, Changwon, 51140, South Korea. E-mail: junseoblee@changwon.ac.kr
bDepartment of Materials Convergence and System Engineering, Changwon National University, 51140 Changwondaehak-ro, Changwon, 51140, South Korea
ci-Casting Tech Ltd., Gomo-ro, Gimhae, 50875, South Korea
dResearch Institute of Industry Science & Technology, Cheongam-ro, Pohang, 37673, South Korea
eKorea Institute of Materials Science, Chagwondea-ro, Changwon, 51508, South Korea
First published on 22nd December 2022
Abstract
The effect of adding C on the passivity of hypoeutectic high chromium cast iron (HCCI) was investigated in a pH 8.4 boric–borate buffer solution. The microstructure of HCCI is composed of austenite and carbide phases, whose fractions and chemical compositions are influenced by the amount of C added. Electrochemical and surface analyses revealed that the addition of C in the HCCI increased the defect densities in the n-type and p-type semiconductive oxide layers on the austenite and carbide phases, respectively.
Introduction
High chromium cast iron (HCCI) is a type of cast iron that contains 2.0 to 3.0 wt% of C and 14.0 to 28.0 wt% of Cr as the main alloying elements. The C and Cr contents of HCCI are higher than those of stainless steel and carbon steel, respectively, and as a result, it exhibits higher hardness values of 600 HB1,2 and localised corrosion resistance.1,2 The HCCI is widely used in the rolls, molds, and slurry pumps of flue gas desulfurization (FGD) facilities because of its resistance to wear and corrosion in weak acidic or alkaline environments.1,2HCCI is classified into class II (B, C; 14 to 18 wt% and D, E; 18 to 23 wt%) and class III (A; 23 to 28 wt%) according to the Cr content. The alloy is also classified on the basis of its microstructure into hypoeutectic, eutectic and hypereutectic structures.3–5 Although various HCCIs are used in the slurry pumps of FGD facilities, the class III HCCI, which contains 27 wt% Cr, is preferred, because the corrosion resistance of this cast iron is superior to those of the other HCCIs.2
The hypoeutectic HCCI comprises eutectic austenite and carbide (mainly M7C3) phases along with a dendritic primary austenite phase,3–6 while the hypereutectic HCCI consists of a eutectic austenite phase as well as primary and eutectic carbide phases.5,7 The carbide phase of HCCI increases the hardness value and abrasion resistance of the material,6,7 while the austenite phase supports the carbide phase and increases the toughness value of HCCI.8 As such, the fractions of carbide and austenite phases affect the mechanical properties of the HCCI. Notably, the fractions of carbide and austenite phases in HCCIs are also influenced by C, which is one of the main alloying elements, and may be closely related to the mechanical properties of the HCCI.
It is widely known that the general and localised corrosion resistances of the hypoeutectic HCCI is higher than that of the hypereutectic HCCI owing to the high fraction of carbide phases in the HCCI.1,2,9,10 In contrast to the austenitic phase, the carbide phase generally acts as a local cathode region in HCCI and accelerates the anodic reaction at the austenitic phase or that at the interface between the carbide and the austenitic phases.9–11 If the composition of one of the main alloying elements, viz. Cr or C, is changed, then the fractions and chemical compositions of the austenite and carbide phases are also changed significantly. Wiengmoon et al.10 reported that with the increase in Cr content from 20 to 36 wt% in hypoeutectic HCCI, the Cr/C ratio in the carbide phase increases, while the general corrosion rate of the alloy in sulfuric acid decreases. The addition of C in HCCI is strongly associated with the corrosion resistance of this alloy.
The corrosion resistance of the HCCI alloy depends on the electrochemical properties of the passive film formed on its surface, because corrosion initiates when the film begins to degrade in an exposed environment. To evaluate the corrosion behavior of HCCI, it is important to investigate the electrochemical properties of the passive film formed on the austenitic and carbide phases in the HCCI. Salasi et al.11 demonstrated that the passive film formed on the hypereutectoid HCCI alloy with 30 and 4.5 wt% of Cr and C, respectively, is mainly composed of Fe or Fe–Cr oxides, which are formed on the austenitic or carbide phases, respectively.
It is also important to understand the effect of C addition on the fraction and chemical composition of the austenite and carbide phases in hypoeutectic HCCI because the metallurgical change by C addition should affect the passive film properties associated with the substrate composition. However, the passive behavior of hypoeutectic HCCI with C addition remains hitherto unexplored. In this study, the electrochemical properties of the passive film formed on a class III hypoeutectic HCCI with a Cr content of 27 wt% were investigated at different C contents of the alloy.
Experimental
HCCI samples containing 27 wt% Cr and different C contents, ranging from 2.1 to 2.8 wt%, were prepared in air using a high-frequency induction furnace. Each sample had a diameter of 13 mm and a length of 100 mm. Table 1 shows the chemical compositions of the prepared HCCI samples. The chemical compositions of the HCCI samples were analysed by an inductively coupled plasma optical emission spectroscopy (ICP-OES; iCAP 6000, ThermoFisher), while the compositions of C were analysed by a CS analyser (ELTRA, CS-800). Each HCCI specimen was cut into 5 mm thickness, and then the specimen surface was ground down to 3000 grit using an SiC paper and was finally polished with a 1 μm diamond suspension.| C | Si | Mn | Ni | Cr | Fe |
|---|---|---|---|---|---|
| 2.13 | 0.71 | 0.67 | 0.89 | 27.00 | Bal. |
| 2.43 | 0.68 | 0.70 | 0.86 | 27.06 | Bal. |
| 2.78 | 0.70 | 0.70 | 0.87 | 27.34 | Bal. |
The crystallographic phase identification was carried out using a scanning electron microscope (JSM-6510, JEOL) with electron backscattered Kikuchi diffraction patterns. The patterns were approximated using a database of materials crystallographic models. The color images of the HCCI surfaces were analysed by image analyser to obtain phase fractions.
A quantitative chemical analysis of the specific phases in the HCCI samples was conducted by electron probe microanalysis (EPMA; JXA-8530F, JEOL) with wavelength dispersive spectroscopy (WDS). The elemental compositions of the phases with the addition of C in the HCCI samples was calculated using FactSage 8.1 with the FSstel database; for this analysis, the Scheil–Gulliver cooling model was employed.
The electrochemical experiments were carried out using a three-electrode electrochemical system containing working, counter and reference electrodes. The HCCI specimen, with a diameter of 13 mm, wired by Cu and impregnated in an epoxy resin, was used as the working electrode. The counter electrode was an amorphous C plate with a surface area of 18 cm2. Ag/AgCl in saturated KCl (silver/silver chloride reference electrode (SSE)) was used as the reference electrode.
A potentiostat (SP-200, Biologic) was used to polarise the HCCI electrode. After measuring the transient electrode potential for 600 s, potentiodynamic polarisation of the HCCI electrode was performed from a corrosion potential of −0.05 V to 1.1 VSSE at a scan rate of 1 mV s−1. The potentiostatic polarisation was carried out at an applied potential of 0.5 VSSE for 3600 s. After the potentiostatic polarisation, electrochemical impedance spectroscopy (EIS) and Mott–Schottky (M–S) analysis were conducted at 0.5 VSSE. In the EIS analysis, the electrode potential was perturbed by ±10 mVrms in a frequency range from 105 to 10−2 Hz. In the M–S analysis, the applied potential shifted from 0.5 to −0.5 VSSE at a constant frequency of 1 Hz. The EC lab software was used to fit the experimental data obtained from the EIS and M–S analyses. Since it is important to investigate the passive film properties during electrochemical experiments with a steady-state chemical condition of electrolyte such as pH, the boric–borate buffer solution was used. In an acidic buffer solution, the passive film formation struggled with dissolution and formation during the electrochemical experiments. Various researchers have approached to explore the growth kinetics and the electronic properties of the passive film with a stable condition in the alkaline buffer solution.12–14 All the electrochemical measurements were carried out in a boric–borate buffer solution (0.15 mol dm−3 H3BO3 and 0.15 mol dm−3 NaB4O7), with pH 8.4, purged with 99.999% N2 gas for 1 h at room temperature. In all electrochemical tests, the reproducibility was examined at least three times with different specimens.
The surface of the HCCI specimen polarised at 0.5 VSSE for 3600 s was characterised by Auger electron spectroscopy (AES; PHI700 SAM, ULVAC PHI), which was performed using an electron beam with a diameter of 1 μm. In addition, the surface was sputtered by Ar ions at a rate of 0.63 nm min−1 for Ta2O5.
Results
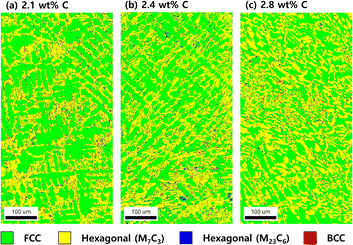
Fig. 1 shows the color-coded phase images of the EBSD patterns shown by the microstructure of the Fe–27Cr–xC HCCI with different C contents. The colors green, yellow, blue, and red represent the face-centred cubic (FCC), hexagonal M7C3, hexagonal M23C6, and body-centred cubic (BCC) structures, respectively. All the microstructures of the HCCIs exhibited a dendritic FCC phase and hexagonal carbide phases, containing the BCC phase. Considering that the microstructure of the HCCI is hypoeutectic with a C content <2.8 wt%, it can be concluded that the dendritic FCC structure of the austenitic phase is formed as a primary eutectic phase, while the hexagonal M7C3 structure is transformed from a liquid phase during the eutectic solidification of the HCCI. Further, the M23C6 and BCC phases rarely form at the interface between the austenite and the M7C3 phases. In a hypoeutectic HCCI with 27 wt% Cr, the M23C6 or BCC (or body-centred tetragonal (BCT)) phases reportedly transform at temperatures lower than 1150 or 800 °C, respectively,3,15,16 indicating that rapid cooling during the solidification of the HCCI leads to the formation of the M23C6 and BCC phases.When the C content increases from 2.1 to 2.8 wt% in Fe–27Cr–xC, the fraction of the austenite phase decreases from 63% to 49%, while that of the M7C3 phase increases from 32% to 45% (Fig. 2). By contrast, the fraction of the M23C6 and BCC phases is almost constant at less than 5%, irrespective of the C content in the HCCI. Oh et al.15 estimated the fraction of the primary austenitic phase in Fe–27Cr–xC to be 37.6% and 6.8% with 2.1 and 2.8 wt% C, respectively, indicating that when the C content is 2.1 and 2.8 wt%, this HCCI exhibits a hypoeutectic microstructure without a primary carbide phase.
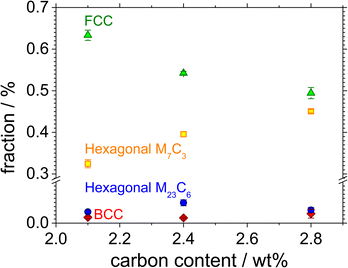 | ||
| Fig. 2 Phase fractions of the FCC, hexagonal, and BCC phases as a function of the C content in the Fe–27Cr–xC HCCIs. | ||
Fig. 3 shows the atomic concentrations of Fe, Cr and C in the austenite and M7C3 phases with the increasing C content in Fe–27Cr–xC, obtained by thermodynamic calculations and EPMA-WDS analysis. The elemental (Fe, Cr and C) compositions in the austenite and M7C3 phases are in the order of Fe > Cr > C and Cr > C > Fe, respectively, irrespective of the C content in the HCCI. Further, the M7C3 phase evidently contains multiple M(M = Cr7−x, Fex, 0<x<7)7C3 carbides. When the C content in the HCCI increases from 2.1 to 2.8 wt%, the stoichiometric ratio Cr/Fe in the M7C3 phase decreases from 3.04 to 2.23, while the M/C stoichiometric ratio shows no change. In the austenite phase, the increasing C content in the HCCI results in a gradual increase in the Fe concentration from 77.3 to 79.5 at%, while that of Cr decreases from 19.1 to 16.4 at%. The concentration of C in the austenite phase slightly increases from 3.6 to 4.2 at%, while that in the M7C3 phase remains constant, indicating that the Fe and Cr compositions of the austenite and M7C3 phases are strongly affected by the addition of C in the HCCI. It can be speculated that the addition of C in the HCCI increased the M7C3 phase fraction, resulting in the dilution of Cr and enrichment of Fe in the M7C3 phase and vice versa in the austenite phase. This change in the chemical composition of the austenite and carbide phases with the addition of C was also thermodynamically calculated in a previous study for a hypoeutectic HCCI alloy containing 25 wt% Cr.16 Additionally, it was demonstrated that the Cr content in the austenite and carbide phases decreases with an increase in the C content in the HCCI.16
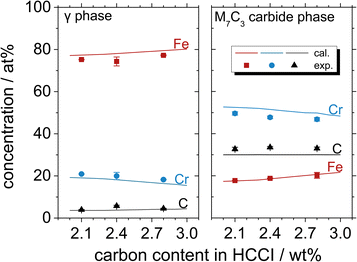 | ||
| Fig. 3 Atomic concentrations of Fe, Cr and C in the austenite and M7C3 phases of the Fe–27Cr–xC HCCIs, determined by thermodynamic calculations and EPMA-WDS. | ||
Fig. 4 shows the potentiodynamic polarisation curves of the Fe–27Cr–xC HCCI, obtained in a pH 8.4 boric–borate buffer solution. The corrosion potential slightly shifts towards a negative potential from −0.241 to −0.251 VSSE due to the higher amount of C in the HCCI. This negative shift is related to the decrease in the Cr/Fe ratio in the austenite and M7C3 phases of the HCCI. Furthermore, the HCCIs do not show any active-to-passive transition behavior. The anodic current gradually increases and reaches a stable passive current of ca. 5 μA cm−2 until 0.7 VSSE, indicating the passive state of the HCCI surface. In the passive region of the potential range, i.e., between the corrosion potential to approximately 0.7 VSSE, the passive current increases with the increase in the C content in the HCCI. At potentials >0.7 VSSE, the anodic current increases not because of the localised corrosion but oxygen evolution reaction in the alkaline aqueous solution. Because the theoretical potential for oxygen evolution is 0.53 VSSE by Nernst equation.
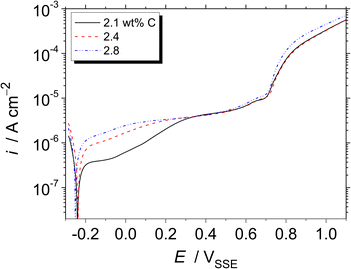 | ||
| Fig. 4 Potentiodynamic polarisation curves of the Fe–27Cr–xC HCCIs, obtained at a scanning rate of 1 mV s−1 in a pH 8.4 boric–borate buffer solution. | ||
Fig. 5 shows double logarithmic plots of the transient current density with polarisation at 0.5 VSSE for the Fe–27Cr–xC HCCIs in a pH 8.4 boric–borate buffer solution. Since a stable passivity-maintaining current was difficult to examine <0.5 VSSE, the passive behavior was explored at a stable passive region at 0.5 VSSE. For all the HCCI samples, the current decreases with a slope of −1 up to 20 s, indicating that the passive oxide grows only through the consumption of the ionic current, which is called the high field mechanism.17 After 20 s of polarisation, the slope of the current is maintained as −1, whereas a slightly large anodic current flows on the specimen surface with the increasing the C content in the HCCI during the polarisation. For instance, at 500 s, the anodic current flowing on the HCCI with 2.1 wt% C is 10% larger than that flowing on the surface of the HCCI with 2.8 wt% C, implying that the electrical conductivity of the passive oxide formed on the specimen surface increases with the increasing C content in the HCCI.
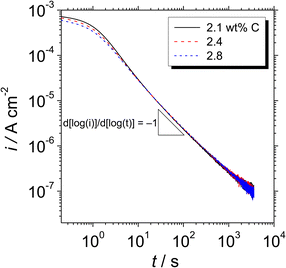 | ||
| Fig. 5 Double logarithmic plots of the transient current density with time for the Fe–27Cr–xC HCCIs polarised at 0.5 VSSE, obtained in a pH 8.4 boric–borate buffer solution. | ||
Fig. 6 shows the Bode plots of the Fe–27Cr–xC HCCIs polarised at 0.5 VSSE; the measurements were performed in a pH 8.4 boric–borate buffer solution. The experimental data is fitted with the equivalent electronic circuit model of Rs–Rct–CPE, where Rs and Rct are the solution and charge transfer resistances, respectively, and CPE is the constant phase element representing the shape of the capacitive loop. The CPE value is substituted with the interfacial capacitance Cint, which includes the capacitances of the space charge and Helmholtz layers, as illustrated by the following equation:
 | (1) |
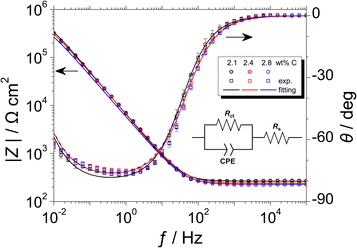 | ||
| Fig. 6 Bode plots of the Fe–27Cr–xC HCCIs polarised at 0.5 VSSE, measured in a pH 8.4 boric–borate buffer solution. The equivalent electronic circuit to fit the Bode plots is depicted in the inset. | ||
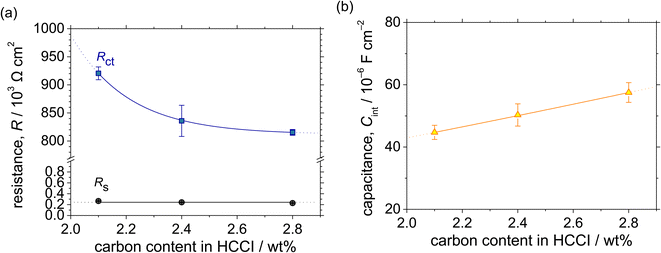 | ||
| Fig. 7 (a) Resistance and (b) interfacial capacitance as functions of the C content in the Fe–27Cr–xC HCCIs, calculated from the Bode plots shown in Fig. 6. | ||
Fig. 8 shows the M–S plot of the Fe–27Cr–xC HCCI polarised at 0.5 VSSE; this characterisation was performed in a pH 8.4 boric–borate buffer solution. The capacitance of the HCCI surface was measured at a frequency of 1 Hz, and the capacitive response was found to be dominant at this frequency, as shown in Fig. 6. The capacitance of the passive oxide/aqueous solution interface includes the capacitances of the space charge and Helmholtz layers, and is given by
 | (2) |
 | (3) |
 | (4) |
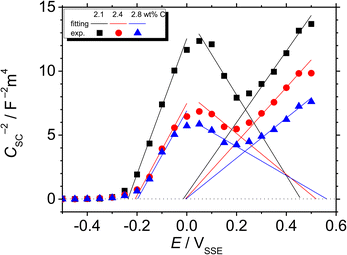 | ||
| Fig. 8 M–S plot of the Fe–27Cr–xC HCCIs polarisation at 0.5 VSSE. The plots were measured in a pH 8.4 boric–borate buffer solution. | ||
All the HCCI specimens showed a linear relation between Csc−2 and E in three potential regions, viz. from 0.45 to 0.3 VSSE (I), 0.2 to 0.1 VSSE (II), and −0.05 to −0.15 VSSE (III). Positive slopes are observed in regions I and III, while negative slopes appear in region II, indicating that the specimen surfaces have n-type characteristics in regions I and III and p-type properties in region II. Since the Efb in regions I and III is approximately −0.2 and −0.0 VSSE, respectively, these two regions represent the capacitive behavior of the n-type Fe oxide formed on the austenite phase with shallow and deep donor levels, respectively.20–23 In contrast, the Efb in region II is approximate 0.5 VSSE, indicating that region II is representative of the capacitive behavior of the p-type Cr oxide. According to previous studies, the capacitance of the Cr oxide formed on Fe–Cr alloys appears at a potential value lower than ∼−0.4 VSSE in a pH 8.4 boric–borate buffer solution.24,25 When the potential shifts from the corrosion potential towards the negative potential direction, the passive film formed on the alloy can be electrochemically degraded by cathodic reactions during the potential sweep. This indicates that it is difficult to interpret the p-type properties of the passive film formed on the alloy from the negative linear relation observed in the M–S plot at the cathodic region. In this study, the potential was varied from the passive-film-formation potential of 0.5 VSSE to −0.5 VSSE to derive the M–S plots as shown in Fig. 8. The p-type capacitance of region II is related to the Cr oxide formed on the carbide phase in the HCCI.
When the C content increases from 2.1 to 2.8 wt% in the HCCI, the Efb of regions I, II and III shifts towards the positive potential direction (Fig. 9(a)), demonstrating that the electronic band structure of the passive oxide formed on the HCCI is dependent on the C content in the HCCI. The donor and acceptor defect densities increase with the increasing C content in the HCCI (Fig. 9(b)), indicating that because of the addition of C in the HCCI the passive oxide formed on the austenite and carbide phases becomes defective.
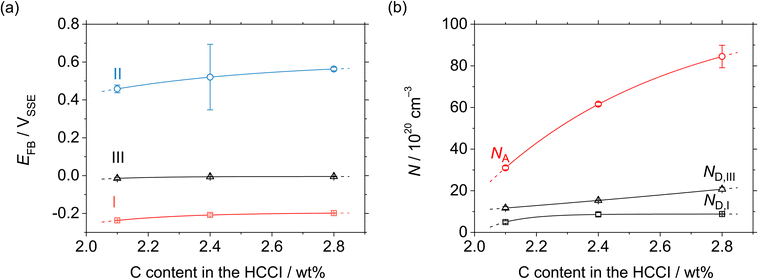 | ||
| Fig. 9 (a) Flatband and (b) defect density as functions of the C content in the Fe–27Cr–xC HCCIs, deduced from the M–S plots shown in Fig. 8. | ||
Fig. 10 shows the auger depth profiles of Fe, Cr, O and C present in the austenite and carbide phases with different C contents added in the HCCI after the potentiostatic polarisation at 0.5 VSSE for 3600 s in a pH 8.4 boric–borate buffer solution. Considering that the outmost surface layer is contaminated during the preparation of the specimen, the concentration of C is expected to decrease after the sputtering. The observed decrease in the O concentration with the sputtering time demonstrates that the surface of the specimen was covered with an oxide layer, which contained Fe and Cr cations in both the phases, irrespective of the C content in the HCCI. The thickness of the oxide layer is estimated from the equivalent sputter time and half of the maximum O concentration at the interface between the oxide layer and the substrate. The thickness of the oxide layer on the austenite (ca. 2.0 nm) phase is found to be approximately two times larger than that on the carbide phase.
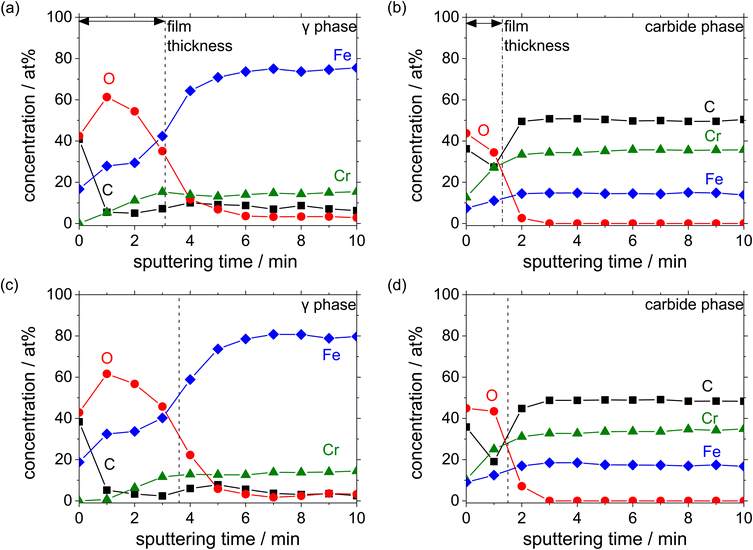 | ||
| Fig. 10 AES depth profiles obtained after the polarisation of the HCCIs at 0.5 VSSE: (a and b) 2.1 wt% C and (c and d) 2.8 wt% C. The profiles were measured in a pH 8.4 boric–borate buffer solution. | ||
Moreover, a thick oxide layer is formed in all the phases when a large amount of C is added in the HCCI. In the austenite phase (Fig. 11(a)), the Fe/(Fe + Cr + O) atomic ratio in the oxide layer is higher than the Cr/(Fe + Cr + O) ratio, while in the carbide phase (Fig. 11(b)), the Fe/(Fe + Cr + O) atomic ratio in the oxide layer is lower than the Cr/(Fe + Cr + O) ratio. Compared to the HCCI with 2.1 wt% C, the one with C content exhibited a higher atomic concentration of Fe and a lower concentration of Cr in the oxide layer as well as in the HCCI substrate, which is composed of the austenite and carbide phases. This indicates that the composition of the oxide layer is strongly related to the HCCI substrate composition.
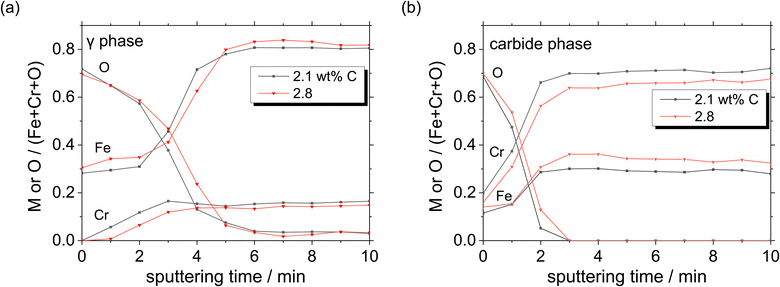 | ||
| Fig. 11 Atomic concentration ratios of Fe, Cr and O on (a) austenite and (b) carbide phases, calculated from Fig. 10. | ||
Discussion
When the C content is increased up to 2.8 wt% in the hypoeutectic HCCIs, the fraction of the austenite phase decreases, while that of the carbide phase increases (Fig. 2). Moreover, the chemical compositions of the austenite and carbide phases change with the addition of C in the HCCI (Fig. 3). It has been reported that the structure and composition of the passive films formed on Fe–Cr alloy substrates are strongly associated with the chemical composition of the substrates.11,26,27 Salasi et al.11 performed secondary ion mass spectroscopy to characterise the composition of the passive film formed on the carbide and austenite phases in the hypereutectic Fe–30Cr–4.5C HCCI in air, and reported that the composition and structure of the passive film are related to the composition of the substrate phase. The carbide phase comprised a ∼5.0 nm-thick Fe oxide film, while the austenite phase contained a 2 nm-thick Fe and Cr oxide bilayer. Hakiki et al.26 reported the composition of passive films formed on Fe–xCr (x = 0 to 30) alloys in alkaline solutions using AES. It has been suggested that the chemical composition of the passive film formed on the alloy surface strongly depends on the Cr concentration in the inner layer of the film. The increased concentration of Cr in steel enriches the inner Cr oxide layer, whereas the thickness of the film is independent of the Cr content in the alloy. Calinski et al.27 analysed the composition of the passive film formed on an Fe–xCr (x = 0 to 30) alloy in an acidic solution by ion scattering spectroscopy. They found that Cr oxide formed in the inner layer of the film when the Cr content exceeded 12 wt%. In the case of ferritic stainless steels, the addition of Cr influenced the semiconductive property of the passive film. Ohtsuka et al.28 compared the semiconductive properties of the Fe–xCr (x = 11, 18, 30) stainless steel with Cr addition. They assumed that the donor density of the n-type passive film decreased with the increasing Cr content in an acidic solution.In this study, the defect densities in the passive film increased with the increasing C content in the HCCI (Fig. 9). Moreover, the passive films formed on the austenite and carbide phase were mainly n-type Fe and p-type Cr oxide films, respectively (Fig. 10 and 11). The n-type passive film generally contained donor defects, such as metal cation interstitials or oxygen anion vacancies, while the p-type film contained acceptor defects, such as metal cation vacancies or oxygen interstitials. When the C content was increased in the HCCI, the concentration of Fe increased, while that of Cr decreased in the passive films. However, the thicknesses of the films increased with the increasing C content in the HCCI. For the n-type passive film formed on the austenite phase, the observed Fe enrichment in the film can be attributed to the increase in the number of interstitial Fe cations at the shallow (I) and deep (III) donor levels. For the p-type passive film on the carbide phase, the dilution of Cr in the film resulted from an increase in the number of Cr cation vacancies. It is speculated that the positively shifted flatband potential and the defective passive film formed on both the austenite and carbide phases increased the ionic current through the edge of the conduction band to the redox species in the electrolyte; consequently, the film became conductive.
The passive properties of the hypoeutectic HCCI are vital for understanding the localised corrosion behavior of HCCIs exposed to environments containing Cl ions. To the best of our knowledge, this paper introduces the properties of the films formed on austenite and carbide phases in HCCIs as well as the compositions of these films analysed by AES for the first time. The addition of C in HCCIs renders the passive films more defective, leading to the preferential initiation of localised corrosion at the interface between the austenite and the carbide phases. This influences the localised corrosion resistance of the HCCI. In the future, we intend to examine the degradation of the passive film on the interface in detail.
Conclusions
In this study, we examined the effect of varying the C content in a hypoeutectic HCCI on the passive behavior of this alloy, in a pH 8.4 boric–borate buffer solution. The microstructure of the HCCI exhibited austenite and M7C3 carbide phases, and the C addition changed the phase fractions and chemical compositions of these austenite and carbide phases. Moreover, n-type and p-type semiconductive oxide layers were formed on the austenite and carbide phases, respectively. AES analysis revealed increased concentrations of metal cations and vacancies in the austenite and carbide phases present in the passive film formed on the HCCI surface with the addition of C. These results indicate that the changing chemical compositions of the HCCI substrate, containing the austenite and carbide phases, with the increasing C content in the HCCI could lead to the formation of a defective passive film.Author contributions
Jun-Seob Lee: conceptualisation; formal analysis; funding acquisition; investigation; methodology; project administration; supervision; validation; writing – original draft; writing – review & editing, Jun-Hyeong Lee: methodology; data curation; formal analysis; validation, Jun-Seok Oh: data curation; resources, Sung Kang: data curation, funding acquisition; Seung-Hoon Baek: data curation; formal analysis, Jee Hyuk Ahn: data curation; formal analysis, Seung Zeon Han: data curation, Je-Hyun Lee: project administration; funding acquisition; project administration.Conflicts of interest
There are no conflicts to declare.Acknowledgements
This work was supported by Korea Institute of Energy Technology Evaluation and Planning (KETEP) grant funded by the Korea government (MOTIE) (20214000000480, Development of R&D engineers for combined cycle power plant technologies). Following are results of a study on the “Leaders in INdustry-university Cooperation 3.0′′ Project, supported by the Ministry of Education and National Research Foundation of Korea. This research is funded by the Financial Program for Self-Directed Research Capacity in 2022.References
- C. H. Pitt and Y. M. Chang, Corrosion, 1986, 42, 312 CrossRef CAS.
- A. Neville, F. Reza, S. Chiovelli and T. Revega, Metall. Mater. Trans. A, 2006, 37, 2339 CrossRef.
- U. P. Nayak, M. A. Guitar and F. A. Mücklich, Metals, 2020, 10, 30 CrossRef CAS.
- J. R. Davis, ASM Specialty Handbook-Cast Irons, ASM International, 1996, pp. 107–122 Search PubMed.
- R. J. Chung, X. Tang, D. Y. Li, B. Hinckley and K. Dolman, Wear, 2009, 267, 356 CrossRef CAS.
- C. P. Tabrett, I. R. Sare and M. R. Ghomashchi, Int. Mater. Rev., 1996, 41, 59 CrossRef CAS.
- I. Chakrabarty and A. Basak, J. Mater. Sci. Lett., 1987, 6, 1399 CrossRef CAS.
- J. Wang, W. Shi, S. Xiang and R. G. Ballinger, Corros. Sci., 2021, 181, 109234 CrossRef CAS.
- N. Fu, X. Tang, D. Y. Li, L. Parent and H. Tian, J. Solid State Electrochem., 2015, 19, 337 CrossRef CAS.
- A. Wiengmoon, J. T. H. Pearce and T. Chairuangsri, Mater. Chem. Phys., 2011, 125, 739 CrossRef CAS.
- M. Salasi, G. B. Stachowiak, G. W. Stachowiak and M. R. Kilburn, Corros. Sci., 2013, 67, 298 CrossRef CAS.
- L. J. Oblonsky and T. M. Devine, Corros. Sci., 1995, 37, 17 CrossRef CAS.
- J.-S. Lee, T. Kawano, T. Ishii, Y. Kitagawa, T. Nakayuki, Y. Hasegawa and K. Fushimi, J. Electrochem. Soc., 2017, 164, C1 CrossRef CAS.
- G. S. Frankel, T. Li and J. R. Scully, J. Electrochem. Soc., 2017, 164, C180 CrossRef CAS.
- J.-S. Oh, Y.-G. Song, B.-G. Choi, C. Bhamornsut, R. Nakkuntod, C.-Y. Jo and J.-H. Lee, Metals, 2021, 11, 1579 CrossRef.
- D. Li, L. Liu, Y. Zhang, C. Ye, X. Ren, Y. Yang and Q. Yang, Mater. Des., 2009, 30, 340 CrossRef CAS.
- N. Cabrera and N. F. Mott, Rep. Prog. Phys., 1949, 12, 163 CrossRef CAS.
- K. Azumi, T. Ohtsuka and N. Sato, Trans. Jpn. Inst. Met., 1986, 27, 382 CrossRef CAS.
- G. Okamoto and T. Shibata, Corros. Sci., 1970, 10, 371 CrossRef CAS.
- N. E. Hakiki and M. D. C. Belo, J. Electrochem. Soc., 1996, 143, 3088 CrossRef CAS.
- E. A. Cho and H. S. Kwon, Corros. Sci. Technol., 2005, 31, 275 Search PubMed.
- N. Zakerin and K. M. Behbahani, Metall. Mater. Trans. A, 2021, 52, 32747 Search PubMed.
- J. H. Kennedy and K. W. Frese Jr, J. Electrochem. Soc., 1978, 125, 723 CrossRef CAS.
- I.-U. H. Toor, J. Electrochem. Soc., 2011, 158, C391 CrossRef CAS.
- H. Y. Ha, H. J. Jang, H. S. Kwon and S. J. Kim, Corros. Sci., 2009, 51, 48 CrossRef CAS.
- N. B. Hakiki, S. Boudin, B. Rondot and M. D. C. Belo, Corros. Sci., 1995, 37, 1809 CrossRef CAS.
- C. Calinski and H. -H. Strehblow, J. Electrochem. Soc., 1989, 136, 1328 CrossRef CAS.
- T. Ohtsuka, M. Abe and T. Ishii, J. Electrochem. Soc., 2019, 162, C528 CrossRef.
| This journal is © The Royal Society of Chemistry 2023 |

