 Open Access Article
Removal of ammonia nitrogen from black and odorous water by macrophytes based on laboratory microcosm experiments
Shangmin Huangfua,
Fulai Zhoub,
Xianyun Zhengc,
Xiaoping Zhang*a and
Lifang Hu *c
*c
aCollege of Life Science, Anhui Normal University, Wuhu, 241000, China. E-mail: 634732130@qq.com
bSchool of Chemical and Environmental Engineering, Anhui Polytechnic University, Wuhu, 241000, China
cSchool of Chemical Engineering, Anhui University of Science and Technology, Huainan, 232001, China. E-mail: hulf@aust.edu.cn
First published on 23rd January 2023
Abstract
In recent years, the removal mechanism of ammonia nitrogen in black and odorous water (BOW), especially in the process of phytoremediation, has been a research “hotspot”. Here, the migration process of ammonia nitrogen in macrophytes (Acorus calamus, Canna indica and Eichhornia crassipes) was detected by Fourier transform infrared (FT-IR) spectroscopy. Experiments revealed that the concentration of ammonia nitrogen (NH4+-N) was reduced significantly. Maximum reduction in the NH4+-N concentration was obtained in 75% BOW: the absorption of NH4+-N was >90% in A. calamus and C. indica, and >80% in E. crassipes. After two 10 days cultivations, in the culture dishes of A. calamus and C. indica, absorption of NH4+-N was >90% whereas, in the culture dishes of E. crassipes, absorption of NH4+-N was ∼50% and ∼60%. FT-IR spectroscopy showed that NH4+-N, NO2−-N and NO3−-N could be absorbed by the root and migrate to the stem and leaf of macrophytes. NH4+-N and NO2−-N were transformed, and the direction was NH4+-N → NO2−-N → NO3−-N. The migration rate of NH4+-N in C. indica was faster because of its regular and smooth capillaries according to scanning electron microscopy. Our study on the removal and transformation mechanism of ammonia nitrogen in BOW could be an important reference for other bodies of water.
1 Introduction
Black and odorous water (BOW) is an extreme example of organic pollution in water.1–3 BOW may have a pungent smell, which some people may find unpleasant or disgusting.There are two main mechanisms of water-blackening: one is insoluble substances in water in the form of solid/adsorbed particles; the other is colored organic compounds dissolved in water.4
There are four types of odorants: methane (CH4), hydrogen sulfide (H2S), ammonia (NH3) and other small-molecule gases. If the water body is seriously polluted by organic matter, the aerobic decomposition of organic matter makes the oxygen consumption rate in the water body higher than the reoxygenation rate, thereby resulting in water hypoxia. In anoxic water, odor production is synchronized with blackening, and organic matter is decomposed anaerobically to produce CH4, H2S, NH3 and other odorous and volatile small molecular compounds, which overflow the water surface and enter the atmosphere, thereby emitting odor. Ding et al.5 found that the odor of the water body was caused mainly by the release of H2S and NH3 during the decomposition of organic matter containing sulfur or nitrogen.
Aquatic plants (also known as “macrophytes”) can take-up nitrogen compounds in water through absorption and adsorption,6 which can reduce the nitrogen content in eutrophic water effectively. William7 pointed out that the effect of a macrophyte-based ecological-treatment system is as good as that of typical chemical-treatment system. Macrophytes increase the concentration of dissolved oxygen, provide oxygen for aquatic animals and aerobic microorganisms in the water, restore the damaged aquatic ecosystem, and promote aerobic microorganisms to effectively degrade organic nutrients in the water through respiration; the growth of macrophytes consumes nitrogen in the water, thereby avoiding eutrophication effectively.
Macrophytes mainly absorb nitrogen compounds in the sediment through the roots, then distribute them to the branches and, finally, release them into the water through the living plant or the decay of a dead plant.8 In natural waters, large-root plants (e.g., submerged macrophytes) have more competitive advantages than phytoplankton because they can absorb nutrients directly from sediment.9
Macrophytes can absorb nitrogen compounds directly from water or sediment.10 The storage of nitrogen compounds in submerged plants is more stable than that in algae.11 Ammonia nitrogen (NH4+-N) can be removed by plant uptake, but nitrification and denitrification remain the main mechanisms of removal. The physiological and metabolic activities of submerged plants are directly related to the migration and transformation of nutrients.12 Submerged macrophytes can control the growth of phytoplankton, provide shelter for zooplankton-feeding animals, repair the aquatic ecosystem as well as maintain the balance of the aquatic ecosystem by biological manipulation.13
Yao et al.14 studied the purification effect of six macrophytes (Ceratophyllum demersum, Vallisneria species, Vallisneria macrocephala, Hydrilla verticillata, Sagittaria humilis, and crown grass) in simulated wastewater. With an increase in treatment time, the proportion of ammonia nitrogen decreased and the proportion of nitrate nitrogen increased. Vallisneria species had a good purification effect on nitrogen compounds.
In the present study, three types of macrophytes, Acorus calamus, Canna indica and Eichhornia crassipes, were used to remove ammonia from BOW. The migration and transformation of NH4+-N, NO2−-N and NO3−-N were investigated by Fourier transform infrared (FT-IR) spectroscopy.
2 Experimental section
2.1 Absorption experiment
The macrophytes were A. calamus, C. indica and E. crassipes in their mature period. The water quality was simulated to be black and odorous. According to the average concentration of the water body on site and plant tolerance, the initial concentration of ammonia nitrogen was set at 24 mg L−1 for the first 10 days and 16 mg L−1 for the second 10 days.The experiment was simulated in the laboratory. Each plant was placed into five BOW concentrations: 0%, 25%, 50%, 75% and 100% (BOW/pure water, vol%), respectively. Each treatment was repeated thrice. All treatments were carried out in a bucket with a volume of 20 L and duration of 20 days.
At 8 am on the days 1, 3, 5, 10, 14, 16 and 20 of the experiment, samples were taken to determine the amount of ammonia nitrogen in treated water samples, and BOW of identical concentration was replenished on day-10.
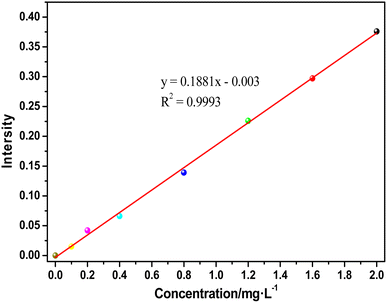
The NH4+-N concentration was tested using Nessler's reagent spectrophotometry method. The standard curve is shown in Fig. 1. The spectral intensity vs. concentration of ammonia nitrogen yielded the equation y = 0.1881× − 0.003 and the coefficient of association was 0.9993.
2.2 Characterization method
The transformation of nitrogen-containing compounds was characterized by FT-IR spectroscopy carried out on a vector 33 FT-IR spectrophotometer (Bruker, USA) with a DTGS detector at a resolution of 4 cm−1. The microcapillary structure of aquatic plants was visualized on a Flex-SEM1000 electron microscope (Hitachi, Japan).3 Results and discussion
The absorption performances of A. calamus, C. indica and E. crassipes for ammonia nitrogen in five types of BOW are shown in Fig. 2 and Fig. 3.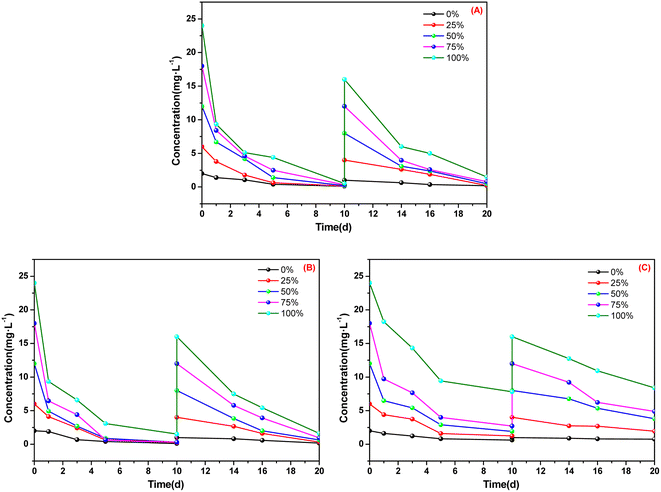 | ||
| Fig. 2 Absorption of ammonia nitrogen for three macrophytes. (A) Acorus calamus; (B) Canna indica; (C) Eichhornia crassipes. | ||
After 10 days of cultivation in BOW with an initial concentration of ammonia nitrogen of 24 mg L−1, the concentration of ammonia nitrogen in the utensils employed for cultivating A. calamus and C. indica was <2 mg L−1 (Fig. 2). After 10 days, the concentration of ammonia nitrogen in the utensils employed for cultivating A. calamus and C. indica remained <2 mg L−1. These results showed that A. calamus and C. indica had a good absorption effect on ammonia nitrogen. For E. crassipes, the concentration of ammonia nitrogen in the culture dish was ∼8 mg L−1 after two 10 days cultivations, which indicated that the absorption effect of E. crassipes was inferior to that of A. calamus and C. indica.
Fig. 3 shows that, after two 10 days cultivations, in the culture dishes of A. calamus and C. indica, absorption of ammonia nitrogen was >90% whereas, in the culture dishes of E. crassipes, absorption of ammonia nitrogen was ∼50% and ∼60%. Among the five types of BOW, 75% BOW had the highest absorption efficiency of ammonia nitrogen, irrespective of whether A. calamus, C. indica or E. crassipes was the macrophyte.
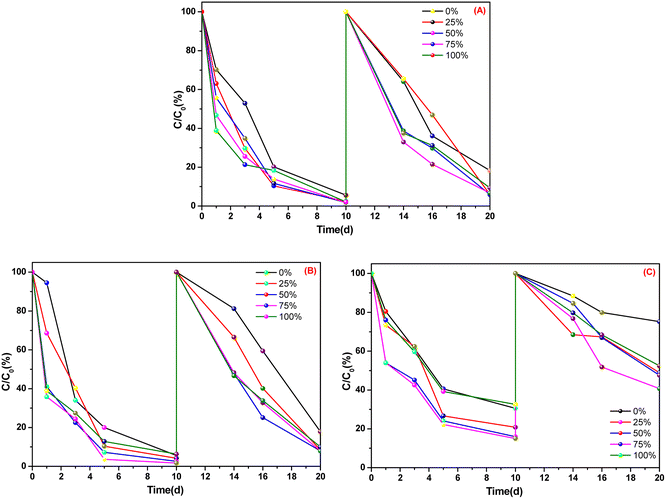 | ||
| Fig. 3 Absorption efficiency of ammonia nitrogen in three macrophytes. (A) Acorus calamus; (B) Canna indica; (C) Eichhornia crassipes. | ||
FT-IR spectroscopy is an important means to study the absorption of ammonia nitrogen by plants and its transformation within plants. The characterization results are shown in Fig. 4–8. We focused on analyses of the changes in the nitrogen-containing compounds NH4+-N, NO2−-N and NO3−-N. According to the literature,15,16 the characteristic peaks (in cm−1) of NH4+-N are 1738 and 1459, whereas they are 1511 and 1332 for NO2−-N, and 1414 cm−1 for NO3−-N.
The FT-IR spectra of the root, stem and leaf of A. calamus cultivated in BOW for 10 days are shown in Fig. 4. Fig. 4A reveals the FT-IR spectrum of the root of A. calamus cultivated in BOW for 10 days. Irrespective of the BOW concentration (0–100%), the characteristic peaks of NH4+-N, NO2−-N and NO3−-N appeared in the spectrum, thereby indicating that the root absorbed NH4+-N, NO2−-N and NO3−-N in BOW. Fig. 4B reveals the FT-IR spectrum of the stem of A. calamus cultivated in BOW for 10 days. Irrespective of the BOW concentration (0–100%), the characteristic peaks of NH4+-N, NO2−-N and NO3−-N appeared in the spectrum, thereby indicating that NH4+-N, NO2−-N and NO3−-N in the root migrated to the stem. However, compared with the root, the intensity of the characteristic peak of NH4+-N at 1738 cm−1 and 1459 cm−1 in the FT-IR spectrum of the stem was weakened significantly, and the relative intensity of the peaks at 1511 cm−1 and 1414 cm−1 was enhanced. These findings indicated that the concentration of NO2−-N and NO3−-N in the stem was greater than that in the root. This phenomenon may have been caused by the transformation of NH4+-N to NO2−-N, and a small amount of NO2−-N being transformed to NO3−-N. Fig. 4C denotes the FT-IR spectrum of a leaf of A. calamus after 10 days of cultivation in BOW. Irrespective of the BOW concentration (0–100%), the characteristic peaks of NO3−-N were the strongest, whereas the characteristic peaks of NH4+-N and NO2−-N were very weak. These observations suggested that NH4+-N, NO2−-N and NO3−-N in the root migrated to the leaf through the stem, NH4+-N and NO2−-N were transformed, and the likely equation is: NH4+-N → NO2−-N → NO3−-N.
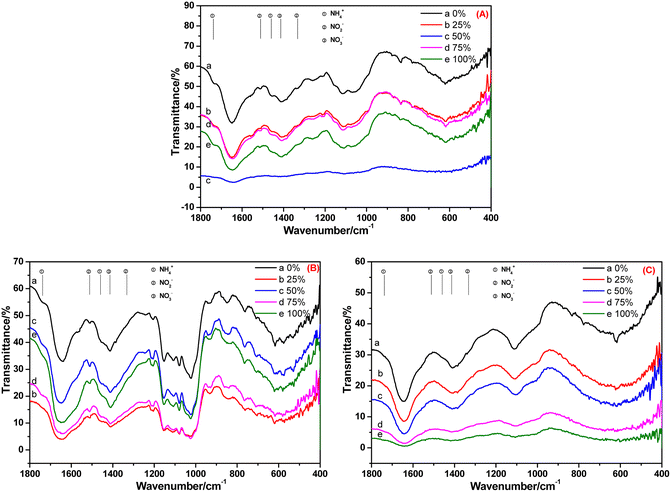 | ||
| Fig. 4 FT-IR spectra of the (A) root (B) stem and (C) leaf of Acorus calamus cultivated in black and odorous water for 10 days. | ||
The FT-IR spectra of the root, stem and leaf of A. calamus cultivated in BOW for 20 days are shown in Fig. 5. Irrespective of the BOW concentration (0–100%), the characteristic peaks of NH4+-N, NO2−-N and NO3−-N were observed (Fig. 5A), thereby indicating that the root absorbed NH4+-N, NO2−-N and NO3−-N in BOW, but the NH4+-N concentration was stronger compared with that at 10 days. Compared with Fig. 5B, the relative intensity of the peak at 1738 cm−1 in Fig. 4B was reduced significantly. This observation indicated that, compared with 10 days previously, the NH4+-N level in the stem had decreased significantly. In Fig. 5C, the peak at 1738 cm−1 is present, but the peaks at 1511 cm−1 and 1332 cm−1 are absent. A possible reason is that the conversion of NH4+-N to NO2−-N was slower than the conversion of NO2−-N to NO3−-N in the leaf.
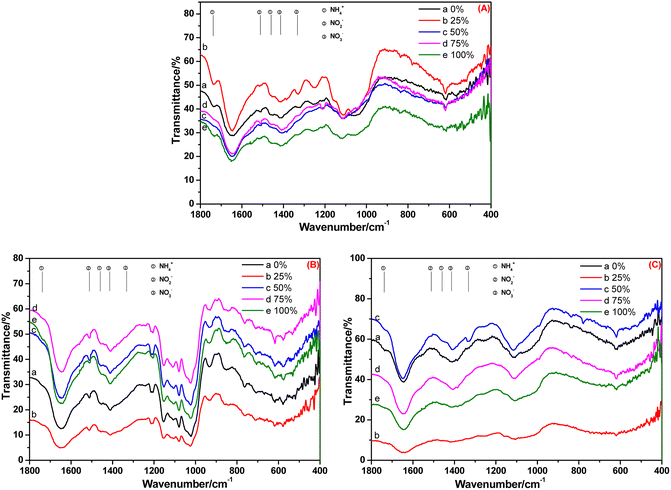 | ||
| Fig. 5 FT-IR spectra of the root (A), stem (B) and leaf (C) of A. calamus cultivated in black and odorous water for 20 days. | ||
The FT-IR spectra of the root, stem and leaf of C. indica cultivated in BOW for 10 days are shown in Fig. 6. Fig. 6A reveals that NH4+-N, NO2−-N and NO3−-N were absorbed in the root irrespective of the BOW concentration. At 100% BOW, the NH4+-N concentration in the root was the highest whereas, at the other BOW percentages, the NH4+-N concentration was much lower than that observed in A. calamus. In the stem of C. indica, residual NH4+-N was present, but very little NO2−-N was present in BOW (except at 100% BOW). These data indicated that the speed of migration and transformation of NO2−-N was rapid. In Fig. 6C, the peak at 1332 cm−1 (characteristic peak of NO2−N) was present, but peaks at 1738, 1459 and 1511 cm−1 (characteristic peaks of NH4+-N and NO2−-N) were absent, which indicated that a small amount of NO2−-N remained in the leaf during migration and transformation. Compared with A. calamus, residual amounts of NH4+-N and NO2−-N were present. However, inorganic nitrogen in C. indica can be transformed rapidly to NO3−-N due to the straight-channel capillaries in C. indica.
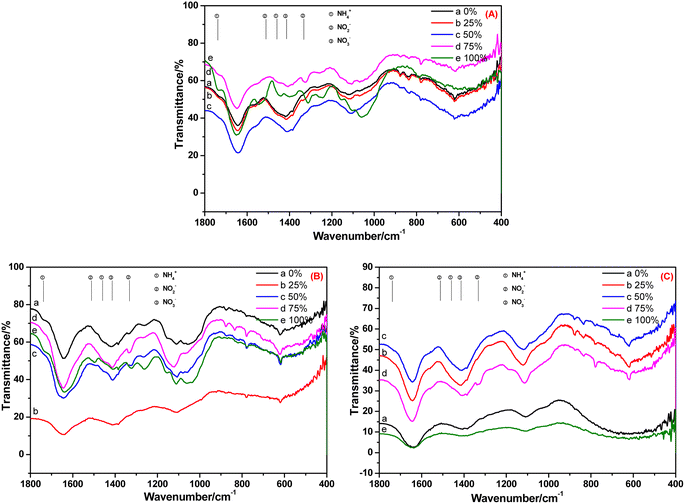 | ||
| Fig. 6 FT-IR spectra of the root (A), stem (B) and leaf (C) of Canna indica cultivated in black and odorous water for 10 days. | ||
After 20 days of cultivation in BOW, NH4+-N, NO2−-N and NO3−-N appeared in the root of C. indica (Fig. 7A). However, only NO3−-N was present in the stem and leaf: NH4+-N and NO2−-N were absent (Fig. 7B and C). A possible reason was that because the cultivation time was longer, the absorption capacity was weakened, and NO2−-N was transformed completely into NO3−-N, and the transformation rate of NH4+-N and NO2−-N was greater than their migration rate.
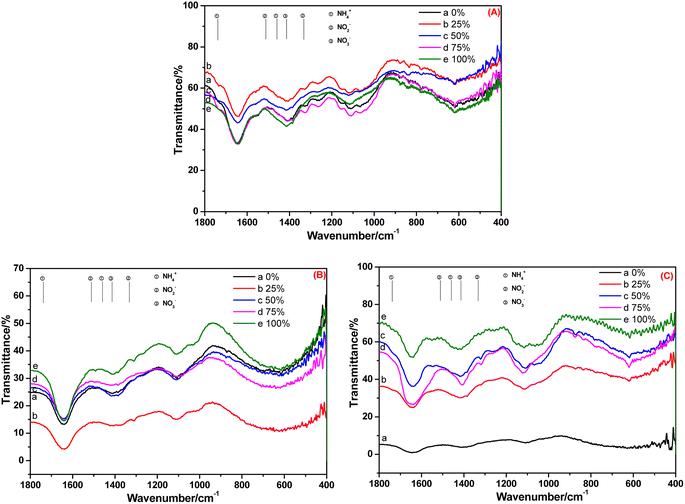 | ||
| Fig. 7 FT-IR spectra of the (A) root, (B) stem and (C) leaf of Canna indica cultivated in black and odorous water for 20 days. | ||
The FT-IR spectra of root and leaf of E. crassipes cultivated in BOW for 10 days, and that of the leaf cultivated in BOW for 20 days, are shown in Fig. 8. The migration and transformation performance of NH4+-N, NO2−-N and NO3−-N in E. crassipes were analogous to those of A. calamus and C. indica. The difference was that the concentrations of NH4+-N and NO2−-N were very low, which may have been due to the weak absorption of E. crassipes.
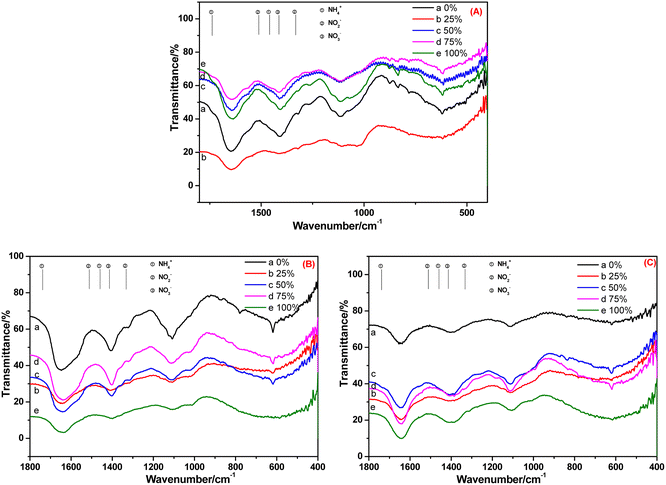 | ||
| Fig. 8 FT-IR spectra of the root (A) and leaf (B) of Eichhornia crassipes cultivated in black and odorous water for 10 days and the leaf (C) cultivated for 20 days. | ||
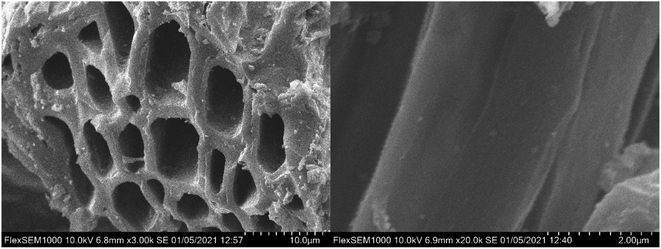
The capillary structure of aquatic plants is important for the migration of ammonia nitrogen, nitrite and nitrate. Scanning electron micrographs (Fig. 9) revealed many capillary structures in C. indica, and the tube walls were smooth. Three types of inorganic nitrogen compounds migrate in macrophytes and are transformed in the order NH4+-N → NO2−-N → NO3−-N. There are many ammonia- and nitrite-oxidizing bacteria in macrophytes. They are responsible for the oxidation of ammonia (i.e., ammonia nitrogen is oxidized to nitrite if sufficient oxygen is present) and nitrite (i.e., nitrite is oxidized to nitrate by nitrite oxidoreductase). Both processes use oxygen as the electron-acceptor.
Our study is based on biological nitrification, and the conversion mechanism of ammonia nitrogen is shown in eqn (1) and (2).
| 2NH4+ + 3O2 → 2NO2− + 2H2O + 4H+ | (1) |
| 2NO2− + O2 → 2NO3− | (2) |
The absorption performances of A. calamus and C. indica for NH4+-N were more robust than those of E. crassipes because C. indica and A. calamus grew rapidly after they were moved into wastewater, their height increased significantly, and the root system extended swiftly. At the end of our experiment, some roots extended into the bottom of the water tank. Also, the biomass accumulation of C. indica and A. calamus was greater than that of E. crassipes.
4 Conclusions
The migration process of NH4+-N in A. calamus, C. indica and E. crassipes was detected via FT-IR spectroscopy. NH4+-N and NO2−-N were transformed in the direction NH4+-N → NO2−-N → NO3−-N from the root to stem and leaf. A multitude of ammonia- and nitrite-oxidizing bacteria are present in macrophytes, and they are responsible for ammonia oxidation and nitrite oxidation. The migration rate of NH4+-N in C. indica was faster because of its regular and smooth capillaries. A. calamus and C. indica could absorb more NH4+-N than E. crassipes. This was because C. indica and A. calamus grew rapidly upon transfer to wastewater, their height increased significantly, and the root system extended swiftly. The efficiency and quantity of transformation will be the focus of further research. Our study on the removal and transformation mechanism of ammonia nitrogen in BOW could be an important reference for other bodies of water.Data availability
The data used to support the findings of this study are available from the corresponding author upon request.Conflicts of interest
There are no conflicts of interest to declare.Acknowledgements
This work was supported by Research Foundation of the Institute of Environment-friendly Materials and Occupational Health of Anhui University of Science and Technology (Wuhu) (ALW2020YF09).References
- S. Sarigai, J. Yang and A. Zhou, et al., Monitoring urban black-odorous water by using hyperspectral data and machine learning, Environ. Pollut., 2021, 269(10), 116166 CrossRef PubMed.
- H. He, Q. Yu and C. Lai, et al., The treatment of black-odorous water using tower bipolar electro-flocculation including the removal of phosphorus, turbidity, sulfion, and oxygen enrichment, Front. Environ. Sci. Eng., 2021, 15(2), 1–13 Search PubMed.
- L. Ye, S. Yang and P. Wu, et al., Design and Application of Monitoring Station of Black and Odorous Water Body Based on Industrial Computer and Remote Computer, IOP Conf. Ser.: Earth Environ. Sci., 2020, 508(1), 012100 CrossRef.
- P. Wang, Y. Weng and P. Zhuang, et al., Analysis of Formation and Mechanisms of Black and Smelly River Water in Island Cities, Meteorol. Environ. Res., 2018, 9(6), 42–48 Search PubMed.
- Q. Ding, L.-H. Tang and D. Xie, Forming mechanism of black-odor of a campus lake, Ind. Water Wastewater, 2012, 43(3), 28–30 CAS.
- L. Marchand, M. Mench and D. L. Jacob, et al., Metal and metalloid removal in constructed wetlands, with emphasis on the importance of plants and standardized measurements: a review, Environ. Pollut., 2010, 158(12), 3447–3461 CrossRef CAS PubMed.
- J. William, The role of water plant in water treatment, Agric. Eng., 1986, 57(6), 9–10 Search PubMed.
- H. Qin, Z. Zhang and M. Liu, et al., Site test of phytoremediation of an open pond contaminated with domestic sewage using water hyacinth and water lettuce, Ecol. Eng., 2016, 15, 753–762 CrossRef.
- Z. Y. Wu, D. R. Qiu and F. He, et al., Effects of rehabilitation of submerged macrophytes on nutrient level of a eutrophic lake, Chin. J. Appl. Ecol., 2003, 14(8), 1351–1353 CAS.
- S. Elisa, B. Marco and M. Marco, et al., An ounce of prevention is worth a pound of cure: Managing macrophytes for nitrate mitigation in irrigated agricultural watersheds, Sci. Total Environ., 2018, 647, 301–312 Search PubMed.
- L. Huang, N. C. Wu and T. Tang, et al., Enrichment and removal of nutrients in eutrophic water by aquatic macrophytes, China Environ. Sci., 2010, 30, 1–6 CAS.
- Y. X. Zhong, H. Y. Hu and Y. Qian, Advances in utilization of macrophytes in water pollution control, Tech. Equip. Environ. Pollut. Control, 2003, 4(2), 36–40 CAS.
- D. B. Sylvia, T. Samuel and T. Ludwig, Stabilizing the clear-water state ineutrophic ponds after biomanipulation: Submerged vegetation versus recolonization, Hydrobiologia, 2012, 689(1), 61–176 Search PubMed.
- Y. Yao, L. Z. Huang and S. Y. Chen, et al., Purification effect of different submerged plants on nitrogen and phosphorus in water, J. Zhejiang Agric. Sci., 2011, 4, 789–792 Search PubMed.
- E. Ito, Y. J. Mergler and B. E. Nieuwenhuys, et al., IR mechanistic studies on NO reduction with NH3 in the presence of oxygen over cerium-exchanged mordenite, J. Chem. Soc., Faraday Trans., 1996, 92(10), 1799–1806 RSC.
- H. Wang, L. Lv and D. H. Wang, et al., NO catalytic oxidation over copper manganese oxide at room temperature, J. Beijing Univ. Chem. Technol. (Nat. Sci. Ed.), 2010, 37(4), 24 CAS.
| This journal is © The Royal Society of Chemistry 2023 |

