 Open Access Article
Virtual screening and activity evaluation of human uric acid transporter 1 (hURAT1) inhibitors†
Yacong Yangacd,
Yu Huacd,
Fengli Yaobc,
Jinbo Yangacde,
Leilei Gef,
Peng Wang*bc and
Ximing Xu *acd
*acd
aKey Laboratory of Marine Drugs of Ministry of Education, School of Medicine and Pharmacy, Ocean University of China, Qingdao 266003, China. E-mail: xuximing@ouc.edu.cn
bCollege of Food Science and Engineering, Ocean University of China, Qingdao 266071, China. E-mail: PengWang@ouc.edu.cn
cPilot National Laboratory for Marine Science and Technology Qingdao, Center for Innovation Marine Drug Screening & Evaluation, Qingdao 266071, China
dMarine Drug Screening and Evaluation Platform (QNLM), Ocean University of China, Qingdao 266071, China
eSchool of Life Science, Lanzhou University, Lanzhou 730000, China
fQingdao Vland Biotech Group Co., Ltd, 266102, China
First published on 24th January 2023
Abstract
Hyperuricemia is a disease caused by disorder of purine metabolism, mainly due to insufficient renal excretion of uric acid. Urate transporter 1 (URAT1) is the most widely studied target of urate transporters, and used for uric acid (UA) reabsorption. This study used the AlphaFold2 algorithm to predict the structure of URAT1. Virtual screening and biological evaluation were used to discover novel URAT1 inhibitors that target the critical amino acids. Seven compounds were screened from the T2220 database and validated as URAT1 inhibitors by cell biology experiments. The IC50 values of benbromarone, NP023335, TN1148, and TN1008 were 6.878, 18.46, 24.64, and 53.04 μM, respectively. Molecular dynamics simulation was used to investigate the binding mechanism of URAT1 to NP023335, which forms stable contact with Ser35, Phe365, and Arg477. These interactions are essential for maintaining the biological activity of NP023335. The three compounds' pharmacokinetic characteristics were predicted, and NP023335's properties matched those of an empirical medication with the benefits of high solubility, low cardiotoxicity, good membrane permeability, and oral absorption. The natural product NP023335 will serve as a promising hit compound for facilitating the further design of novel URAT1 inhibitors.
Introduction
Hyperuricemia is a disease caused by purine metabolism disorder.1 More than 90% of hyperuricemia is caused by insufficient uric acid excretion, and the remaining 10% is caused by excessive production.2 Uric acid is the end product of human purine metabolism. About 80% of the total serum uric acid is created endogenously, with the other 20% coming from dietary purines.3 Due to the inactivation of the uricase gene during the evolution of the human species, uric acid cannot be transformed into the excretion-friendly allantoin.4 The majority of patients with hyperuricemia and gout have renal uric acid excretion dysfunction, whereas healthy individuals can maintain a dynamic equilibrium of uric acid production and excretion.5 Serum uric acid (SUA) levels are primarily influenced by the kidney's excretion and reabsorption mechanisms. The major transporter controlling renal reabsorption of uric acid is urate transporter 1 (URAT1, approximately 90%), followed by glucose transporter 9 (GLUT9, approximately 10%).6,7 Therefore, targeting URAT1 is considered a promising uric acid excretion strategy.URAT1 is an organic anion transporter expressed in renal proximal tubule epithelial cells, encoded by the SLC22A12 gene, including 553 amino acid residues, and the structure has not yet been resolved.8 According to the previous study, a protein model was constructed to assess the atomic mechanism of uric acid transport in URAT1. It was discovered that Phe364, Phe365, and Arg477 in URAT1 are essential for uric acid translocation and recognition.9 More than 90% of patients with hyperuricemia have insufficient uric acid excretion, and URAT1 mainly responsible for reabsorption of uric acid. Inhibiting URAT1 can reduce the reabsorption of uric acid in the renal tubules and promote uric acid excretion.
After years of research, the current drugs that promote the excretion of uric acid include benzbromarone,10 lesinurad,2 verinurad,11 etc. Benzbromarone has the best efficacy among many uric acid-lowering drugs, but it has severe hepatotoxicity, probably due to its ability to increase intracellular reactive oxygen species, causing mitochondrial toxicity.12 FYU-981 is a derivative of benzbromarone, which has been shown to have high activity and low toxicity in studies, and is currently available in Japan, where its safety in clinical practice remains to be observed.13 lesinurad, an oral uric acid-lowering drug, was approved for use in the United States in 2015, but has the disadvantage of low efficacy and a narrow therapeutic window.14 Verinurad is an analogue of lesinurad and is currently in clinical studies.15 URAT1 inhibitors used for the treatment of HUA have the disadvantage of toxic side effects or poor activity, making them difficult to use in clinical practice for a long time.10,16 It is essential to obtain lead compounds with low toxicity and high inhibitory effects.
Virtual screening (VS) has been widely used in early drug discovery, which can effectively improve the hit ratio, shorten the development cycle and reduce the cost of drug development.17 In this study, the 3D structure of URAT1 was predicted by Alphafold2 software and I-TASSER Server.18,19 The T2220 database was screened by the structure-based virtual screening method and the hit compounds were obtained. The uric acid-lowering activities of these compounds were verified by cell biology experiments. Combined with virtual screening and activity evaluation, compounds with further optimized design and development potential were obtained.
Materials and method
Materials
The T2220 database provide by Topscience biotechnology Co. Ltd (Shanghai, China). T0198 (Cas#104010-37-9), TN1008 (Cas#905954-17-8), TN1148 (Cas#905954-18-9), NP023335 (Cat#NP-023335), NP011202 (Cat#NP-NP011202), NP000386 (Cat#NP-000386), NP002714 (Cat#NP-002714) were purchased from Topscience biotechnology Co. Ltd (Shanghai, China). Benzbromarone (Cas#3562-84-3) and 6-carboxyfluorescein (Cas#61419-02-1) were purchased from Shanghai Yuanye Biotechnology Co. Ltd (Shanghai, China). The resazurin (Cas#62758-13-8, Sigma) was purchased from Sigma-Aldrich Co. Ltd (St Louis, MO, USA). The Lipofectamine 3000 was purchased from Thermo Fisher Scientific Co. Ltd (Shanghai, China).All experiments were conducted with the same batch of vector plasmids for hURAT1 (pcDNA3.1-hURAT1-EGFP) or EGFP (pcDNA3.1-EGFP), which were derived from General Biological Systems Co. Ltd (Anhui, China). All other reagents and solvents used were commercially available and of analytical grade.URAT1 structure prediction and quality estimation
The three-dimensional structure of URAT1 (UniProt id: Q96S37) was predicted using the Alphafold2 software and the online I-TASSER server (https://zhanglab.dcmb.med.umich.edu/I-TASSER/). The TM-align server (https://zhanggroup.org/TM-align/) was used to obtain information about URAT1 sequence alignment. The RMSD values were calculated to determine the similarity of the two structures predicted by the two programs. Verify-3D on the SAVES server (https://saves.mbi.ucla.edu/) was used to evaluate the quality of the protein models.20Protein and ligands preparation
The protein structure was prepared using the protein preparation wizard in the Schrödinger software.21 Assigning bond orders to all bonds in the structure, then bond orders to het groups using the Chemical Components Dictionary (CCD), and protonation state was determined at pH 7.0. The hydrogen bond network was optimized by reorienting the hydroxyl, water, and amide groups of ASN and GLN, and using the OPLS3e force field to select the state and orientation of the imidazole ring in the appropriate histidine residue to reduce spatial clashes.22 Minimization was terminated when the energy converges or the root mean square displacement (RMSD) reaches a maximum cutoff value of 0.3 Å. Ligands were prepared using Schrodinger's LigPrep module with Epik to extend protonation and tautomerism states at pH 7.0 units.SiteMap analysis and molecular docking
The binding pocket associated with uric acid uptake in URAT1 was analyzed by submitting the prepared protein structure to the Schrödinger's SiteMap module.23 Evaluated the entire protein for potential binding sites based on the predicted structure. These settings include at least 15 site points per site, a more restrictive definition of hydrophobicity, and a standard grid. The resulting site is clipped at 4 Å from the closest site point. Molecular docking of four known URAT1 inhibitors to URAT1 structures using Schrödinger's Induced Fit Docking (IFD) module.24 The results of SiteMap were combined with the binding patterns reported in the literature to establish a grid box of receptor binding sites.25 Each ligand undergoes initial docking utilizing a softening potential (van der Waals radii scaling). Then, a side-chain prediction for any ligand pose within a specified range is carried out. For every protein/ligand complex pose, the same set of residues and the ligand are then minimized. Each receptor pose reflects an induced fit to the conformation and structure of the ligand. The ligand is then carefully docked into the induced-fit receptor structure using Glide SP. The van der Waals scaling factor for receptor and ligand was set to 0.5 during the initial docking process. The side chains of residues within 5 Å of the ligand were the focus of the Prime refinement step. A maximum of 5 postures for each docked ligand were saved for further redocking in SP mode.26Assessment of docking programs accuracy
Watvina (https://github.com/biocheming/watvina, accessed on 30 November 2021, Ximing Xu, Qingdao, China), developed by our lab, is a molecular docking software to improve the pose prediction with Autodock vina engine.27 To evaluate the screening power of the docking program, other 21 URAT1 inhibitors which have been reported in the literature, were used as actives. The decoys (21*50) were generated from the DUDE database (https://dude.docking.org/).28 The scoring and ranking capabilities of programs were assessed using Receiver Operating Characteristic (ROC) curves.Virtual screening
Structure-based virtual screening was performed on 8515 molecules from the T2220 database. Firstly, the result of the SiteMap was used to determine the docking pocket for watvina docking, using of IFD-refined URAT1 structure as receptor, converting receptors and ligands to pdbqt format by rdkit2pdbqt.py (https://github.com/biocheming/watvina, accessed on 30 November 2021, Ximing Xu, Qingdao, China) and performing molecular docking. In order to determine the precise binding pattern of the ligand to the receptor and the optimal binding conformation, IFD was used to redock URAT1 with compounds from the initial screen.24 Using the OPLS3e force field and the VSGB solvent model, the docking findings for each molecule retain five conformations and are used to calculate the binding energies of the Schrodinger's Prime MM/GBSA module. Results were expressed in terms of ΔG in kcal mol−1.29Cell culture
Human embryonic kidney 293-derived 293T cells were maintained in Dulbecco's modified Eagle's medium (Gibco) supplemented with 10% fetal bovine serum (FBS), penicillin (100![[thin space (1/6-em)]](https://www.rsc.org/images/entities/char_2009.gif) 168 IU mL−1), and streptomycin (100 μg mL−1) at 37 °C in a atmosphere of 5% (v/v) CO2 in air.
168 IU mL−1), and streptomycin (100 μg mL−1) at 37 °C in a atmosphere of 5% (v/v) CO2 in air.
Establishment of URAT1-expressing HEK-293T cells
To establish URAT1-expressing HEK-293T cells, the URAT1 (gene names: SLC22A12) was subcloned into pcDNA 3.1-EGFP using restriction enzymes BamH I and Hind III. To produce HEK-293T-URAT1 cells, Lipofectamine 3000 was used following the manufacturer's instructions to transiently transfect HEK-293T cells with an expression vector for URAT1. As a control, the HEK-293T cells were transfected with an empty pcDNA 3.1-EGFP vector.RT-PCR determination of URAT1 mRNA level
HEK-293T cells were grown to 60–70% confluency in a 10 cm medium, pcDNA3.1-URAT1-EGFP and pcDNA3.1-EGFP plasmids were transfected into cells using the method described above, respectively, and were used at a density of 5 × 10⁵ cells per well cultured for 48 h. An RNA extraction kit (Cat#9109, Takara) was used to extract the total RNA from the cells. One microgram of RNA was reverse transcribed with HiScript II Q RT SuperMix kit (Cat#R223-01, Vazyme, China) to synthesize 10 μL of cDNA template, and the cDNA was diluted fivefold before use in quantitative PCR. LightCycler®96 (Roche) using FastStart Essential DNA Green Master (Cat#35732800, Roche) was used for quantitative real-time PCR. GAPDH was used as an internal control during the PCR amplification process. The primers used in this study were as follows: forward 5′-GAAGGCAACACATGGCACG-3′; reverse 5′-TTCAGGGTCAGCTTGCCGTA-3′.Subcellular localization of URAT1
HEK-293T cells were transfected by pcDNA3.1-URAT1-EGFP and pcDNA3.1-EGFP plasmids as described above and seeded on coverslips in 6-well plates at a density of 3 × 10⁵ cells per well. Confocal microscopy was used to investigate the subcellular localization of URAT1 after 48 h. After being fixed in methanol for 15 to 20 minutes, the cells were PBS-washed three times for two minutes each. After that, DAPI (4′,6′-diamidino-2-phenylindole) nuclear counterstaining was performed on the cells. The coverslips were mounted on slides and photographed under a fluorescence microscope.Fluorescent transport assay
The fluorescent transport assay using URAT1-expressing 293T cells was conducted according to previous studies with minor modifications.30 After being digested, HEK-293T cells that had been transfected with EGFP or EGFP-URAT1 were planted in a 96-well fluorescent plate at a density of 4 × 10⁴ cells per well middle. Hank's Balanced Salt Solution (HBSS) was used to wash the cells three times after 48 h. Cells were then treated for 1 h at room temperature with a solution containing 239.5 μM 6-CFL and sample.31 (HBSS containing 125 mM sodium gluconate, 4.8 mM potassium gluconate, 1.2 mM KH2PO4, 1.2 mM MgSO4, 1.3 mM calcium gluconate, 5.6 mM glucose and 25 mM HEPES, pH 7.4). Washing the cells three times with 100 μL per well PBS stopped cell uptake. Following that, cells were lysed in 100 μL of 0.1 M NaOH for 30 min at room temperature protected from light. Fluorescence was measured at an excitation wavelength of 490 nm and an emission wavelength of 525 nm. To determine the 50% inhibitory concentration (IC50), two-fold serial dilutions of test compounds were prepared in 96-well plates and mixed with 239.5 μM 6-CFL. Initiate uptake by adding premixed samples to HBSS washed cells. After an hour of incubation at room temperature, measure intracellular fluorescence as previously mentioned.Molecular dynamics simulation
Molecular dynamics (MD) simulation was carried out adopting the Desmond module in Schrödinger to comprehend the interactions between the ligand–protein complex in a simulated physiological solvent system.32 The transferable interatomic potential with three points model (TIP3P) solvent model with an orthorhombic box was used to construct the complex system. The initial lipid conformations of symmetrical membranes were constructed using System Builder with palmitoyl oleoyl phosphatidyl choline (POPC) (300 K).33 5Cl− ions neutralization system was used. After the minimization by force constants of 5 kcal mol−1 Å−2 with protein backbone constrained for 100 ps, pre-equilibration was performed. In this section, we use an isothermal–isobaric (NPT) ensemble balance system in four steps, each step performs a constraint with a force constant of 10 kcal mol−1 A−2 lasting 5 ns: firstly, relaxed the POPC with the water and protein constrained, then relaxed the membrane and water in the case of protein restriction, next relaxed the side chain in the case of protein skeleton restriction, and relaxed the entire system finally. Product simulation was performed under typical (NVT) ensemble conditions at 300 K and 100 ns. The selected residue number (1–529) were used to calculate the root mean square deviation (RMSD) and ligand root mean square fluctuation (L-RMSF). Additionally, the aforementioned tools were used to generate all of the charts related to the MD simulation that were presented in this work.Cell viability assay
Cells were seeded into 96-well plates at a density of 5000 cells per well in a complete medium to examine cell viability. After 12 h, an equal volume of chemical or the specified drug was added to each well. The HEK-293T cells were treated with chemicals for 24 h and incubated with resazurin for another 4 h. Fluorescence was measured with a 544 nm excitation and 595 nm emission filter set.Prediction of pharmacokinetic property
The ADME properties of the selected compounds were predicted using Schrodinger's QikProp module.34 In the module, Lipinski's rules of five were used to evaluate the selected molecules. To evaluate the octanol/water distribution coefficient, solubility, cell permeability, blood–brain barrier coefficient, and oral absorption capacity of the chosen compounds, QP![[thin space (1/6-em)]](https://www.rsc.org/images/entities/char_2009.gif) log
log![[thin space (1/6-em)]](https://www.rsc.org/images/entities/char_2009.gif) Po/W, QP
Po/W, QP![[thin space (1/6-em)]](https://www.rsc.org/images/entities/char_2009.gif) log
log![[thin space (1/6-em)]](https://www.rsc.org/images/entities/char_2009.gif) S, QPPCaco, Qp
S, QPPCaco, Qp![[thin space (1/6-em)]](https://www.rsc.org/images/entities/char_2009.gif) log
log![[thin space (1/6-em)]](https://www.rsc.org/images/entities/char_2009.gif) BB, and human oral absorption were predicted.35
BB, and human oral absorption were predicted.35
Statistical analysis
All measured data are expressed as mean ± standard deviation (SD). Comparisons between the groups were executed by one-way analysis of variance (ANOVA) and Tukey's test as a post hoc analysis. The results were considered extremely significant when p < 0.01.Results
URAT1 structure prediction and quality estimation
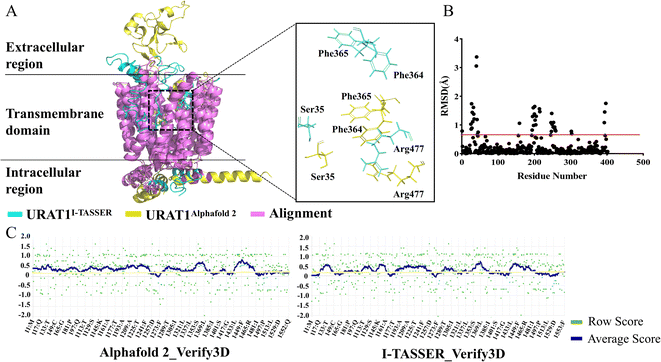
URAT1 is currently the most widely study target of urate transporters, which is responsible for nearly 90% of urate reabsorption.36 URAT1 is rather flexible and structural biologists have tried protein crystallization and cryo-electron microscopy techniques to solve its structure without success. Both template-based homology modeling method I-TASSER and deep learning-based structure prediction method Alphafold2 were used for predicting protein structures in this study. Five models from each of the above methods were obtained respectively. The structure predicted by Alphafold2 with an LDDT value of 89.175 and the structure predicted by I-TASSER with a C_Score value of −2.12 were chosen for alignment. The results are shown in Fig. 1A and B. In the transmembrane region, 87.8% of amino acids are less than 0.5 (red line) in alpha-carbon RMSD (purple), thus the two predicted 3D structures are remarkably similar. However, the side chain alignment shows a large difference between the two structures. Verify-3D in the SAVES server was used to evaluate the quality of those models. A qualified model was defined as having greater than 80% of the residues have a 3D/1D value of more than 0.2 and a fraction less than 0.2 that was insignificant. For the Alphafold2 and I-TASSER models (Fig. 1C), the percentages of residues with 3D/1D values larger than 0.2 (yellow line) were 81.52% and 57.87%, respectively. Finally, URAT1 structure predicted by Alphafold2 was chosen for further study.Druggability analysis of protein pockets
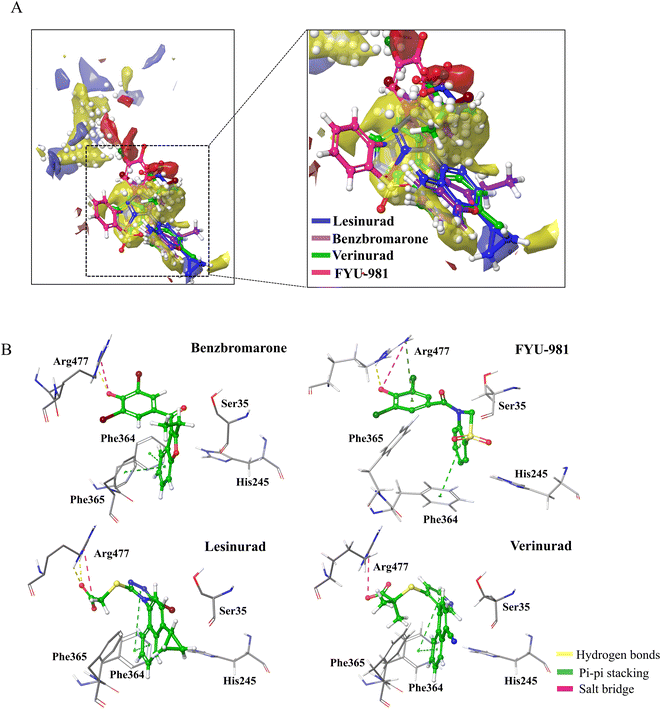
The pockets of the URAT1 protein structure was predicted using Schrödinger's SiteMap module, and the druggability of the protein pocket was evaluated according to the Dscore. The results are shown in Fig. 2A and Table 1. Dscore evaluates the binding pockets on the surface of the protein, and the score greater than 1 indicates that the binding pocket has good druggability. The best prediction pocket scored by Dscore is site_1 with 1.278. Additionally, it is discovered that site_1 has the largest size, the highest exposure and don/acc of all of the pockets. Higher phobic/philic (balanced) proteins are associated with better druggability properties. The balance of site_1 is much higher than the other sites as seen in the SiteMap results. Moreover, it was observed that the predicted pocket site_1 contains important amino acids Ser35, Phe365, and Arg477 reported in the previous study.16 The URAT1 protein structure was docked with benzbromarone, lesinurad, verinurad, and FYU-981 using site_1 as the binding pocket. The results are shown in Fig. 2B and Table 2. The URAT1 inhibitors are all located at the same site as site_1, and it was discovered that they exhibited significant interactions with essential amino acids (Fig. 2A). Therefore, based on the above results and analysis, site_1, which has good druggability and ligand potency, was finally selected as the docking pocket for the receptor for further inhibitor screening.| Site number | Dscore | Size | Exposure | Phobic | Philic | Balance | Don/acc |
|---|---|---|---|---|---|---|---|
| Site_1 | 1.278 | 181 | 0.365 | 2.252 | 0.742 | 3.034 | 0.830 |
| Site_2 | 1.070 | 123 | 0.565 | 0.636 | 0.946 | 0.673 | 0.949 |
| Site_3 | 0.924 | 131 | 0.664 | 0.224 | 1.236 | 0.181 | 0.786 |
| Site_4 | 0.905 | 78 | 0.596 | 0.676 | 1.128 | 0.599 | 0.561 |
| Site_5 | 0.692 | 41 | 0.745 | 0.468 | 0.782 | 0.598 | 0.636 |
| Compound | IFD score | Watvina docking score | Noncovalent interactions | Residues |
|---|---|---|---|---|
| Benzbromarone | −12.89 | −7.6 | 2 Pi–Pi, 1 H-bond, 1 salt–bridge | Phe364, Phe365, Arg477 |
| FYU-981 | −9.38 | −6.9 | 2 Pi–Pi, 3 H-bond, 3 salt–bridge | Phe241, Phe364, His245, Arg477 |
| Lesinurad | −10.55 | −7.3 | 2 Pi–Pi, 2 H-bond, 1 salt–bridge | Phe364, Arg477 |
| Verinurad | −9.28 | −8.1 | 2 Pi–Pi, 1 salt–bridge | Phe364, Arg477 |
URAT1 inhibitors interaction analysis
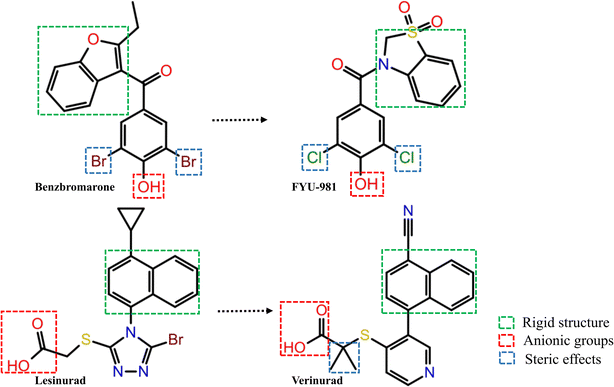
Three common pharmacophore characteristics were discovered to be shared by the structures of the URAT1 inhibitors (Fig. 3): first, there is an anionic site where the anion can interact with residues in the protein binding pocket via hydrogen bonds or ionic interactions. The anionic group is a side chain of thioglycolic acid or a phenolic hydroxyl group. Strong electron withdrawing groups are generally present around the phenolic hydroxyl group, allowing the phenolic hydroxyl group to be deprotonated to produce the appropriate anion. Second, the rigid backbone structure has at least one aromatic ring or aromatic heterocyclic structure that is capable of forming aromatic hydrogen bonds or π–π stacking interactions. In addition, retention of larger sterically hindered groups near the anionic site could enhance the activity of URAT1 inhibitors. Based on the above analysis, the T2220 compound library, which includes molecules with phenolic hydroxyl or thioglycolic acid side chains, was selected as the database for the initial screening.Watvina conducts preliminary screening
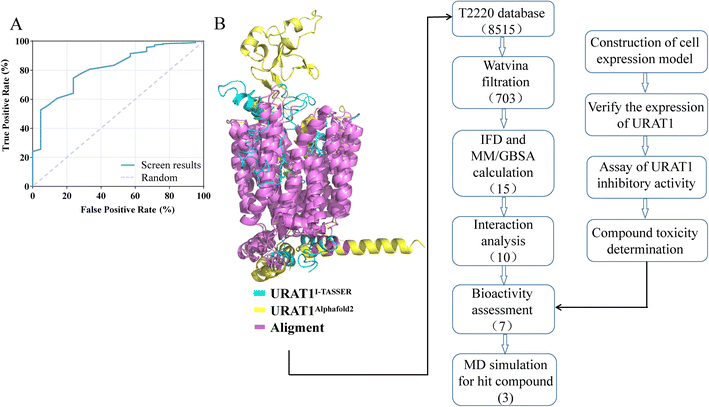
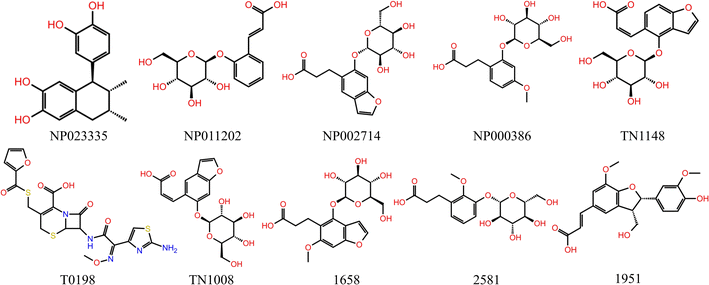
DUD-E generated 1050 decoy molecules, 21 URAT1 inhibitors from previous study and patent were docked by watvina. The ROC curve was produced (Fig. 4A) to evaluate the effectiveness of screening based on the watvina score. It describes the sensitivity (true positive rate) as a function of the specificity (true negative divided by the total of false positive and true negative) of the method used. The ROC value of 0.813 indicates that watvina has superior screening capabilities. The initial screening results of the T2220 database, with a cutoff watvina score less than −6.5 kcal mol−1, which yielded 703 compounds from the compound library.Secondary round screening by IFD and MM/GBSA
Schrödinger's IFD module was used to carry out additional processing on the 703 primary hits.24 IFD allows protein side chains more flexible, enabling ligands to adjust and optimize binding interactions within the binding site, which can be used to get accurate information on how ligands bind to receptors and determine the optimal conformation. MM/GBSA calculations were performed based on the precise binding pattern obtained by IFD, retaining the top 10% of molecules.37 Finally, through the visual analysis of protein-ligand interaction, 10 molecules as shown in Table 3 and Fig. 5 were identified, of which 7 molecules are commercially available, used for further experiments (Fig. 4B).| Molecule | Molecular formula | Weight (g mol−1) | Watvina docking score | IFD score | MM/GBSA | Noncovalent interactions | Residues |
|---|---|---|---|---|---|---|---|
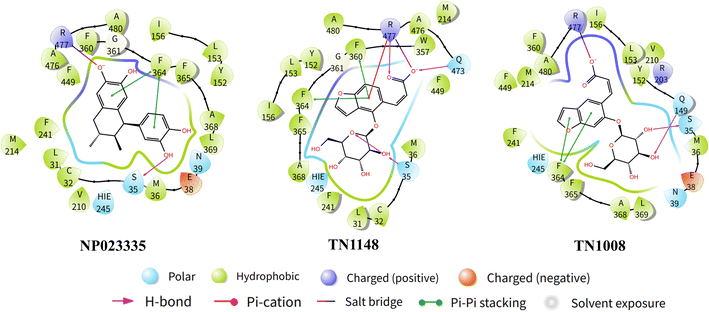
| NP023335 | C18H20O4 | 300.354 | −7.2 | −8.64 | −59.86 | 2Pi–Pi, 3 H-bond | Ser35, Phe364, Arg477 |
| NP011202 | C15H17O8 | 326.302 | −6.7 | −7.38 | −46.35 | 1 Pi–Pi, 2 H-bond, 1 salt–bridge | Ser35, Phe364, Arg477 |
| NP002714 | C17H19O9 | 368.34 | −7.7 | −7.87 | −38.32 | 4 Pi–Pi, 4 H-bond | Ser35, Phe241, Phe364, Phe449, Arg477 |
| NP000386 | C16H21O9 | 358.344 | −7.4 | −8.09 | −43.15 | 1 Pi–Pi, 3 H-bond, 1 salt–bridge | Ser35, Phe364, Arg477 |
| TN1148 | C17H17O9 | 366.324 | −7.3 | −7.79 | −39.96 | 5 Pi–Pi, 5 H-bond | Phe241, Phe364, Lys393, Phe449, Gln473, Arg477 |
| T0198 | C19H16O7N5S3 | 523.553 | −7.2 | −7.45 | −47.72 | 2 Pi–Pi, 5 H-bond, 1 salt–bridge | Ser35, Phe241, Phe365, Lys393, Gln473, Arg477 |
| TN1008 | C17H17O9 | 366.324 | −6.8 | −6.85 | −38.27 | 2 Pi–Pi, 2 H-bond, 1 salt–bridge | Ser35, Phe365, Arg477 |
| 1658 | C18H21O10 | 366.32 | −7.9 | −8.50 | −49.71 | 2 Pi–Pi, 3 H-bond | Ser35, Phe364, Arg477 |
| 2581 | C16H21O9 | 358.344 | −7.7 | −7.33 | −45.19 | 1 Pi–Pi, 2 H-bond, 1 salt–bridge | Ser35, Phe364, Glu473, Arg477 |
| 1951 | C20H19O7 | 372.374 | −7.6 | −6.81 | −57.42 | 2 Pi–Pi, 2 H-bond, 1 salt–bridge | Phe364, Glu473, Arg477 |
Verify the expression of URAT1 by RT-PCR and subcellular localization assay
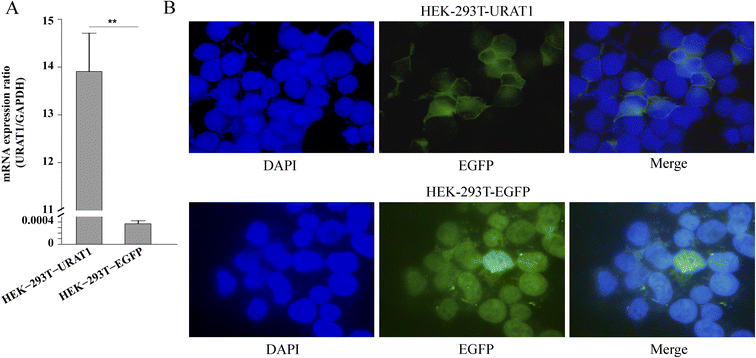
In this study, HEK-293T cells were transfected with the genes URAT1-EGFP or EGFP using the transient transfection method, and RT-PCR assay was performed to verify the expression of URAT1-EGFP genes. The experimental results showed that URAT1 was successfully expressed in cells because the mRNA expression of cells transfected with URAT1-EGFP (HEK-293T-URAT1) was much higher than that of cells transfected with EGFP (HEK-293T-EGFP) (Fig. 6A). The URAT1-EGFP gene was mainly expressed on the cell membrane, as evidenced by the enhancement of the green fluorescence surrounding the cell membrane in comparison to EGFP gene transfected cells.URAT1 inhibition assay with 6-CFL as the fluorescent substrate
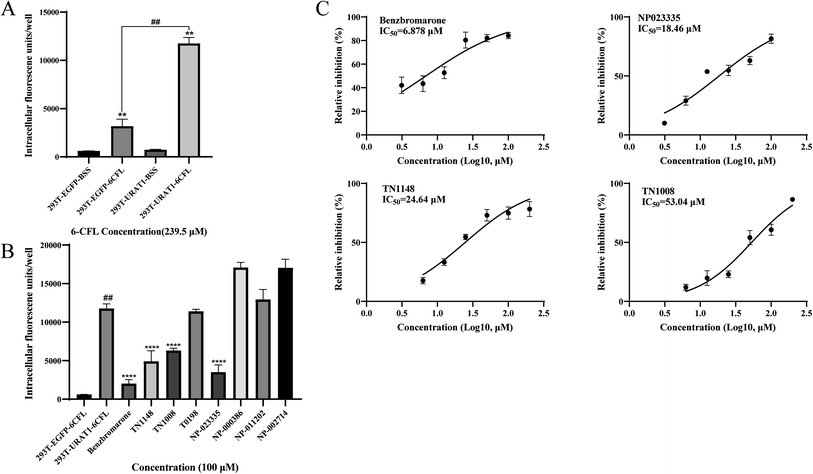
The HEK-293T cell model of URAT1-mediated 6-CFL uptake was constructed on the basis of previous studies.30 Since there was no statistically significant difference in 6-CFL uptake between the 293T_EGFP_BSS and the 293T_URAT1_BSS groups, the 6-CFL fluorescence assay was unaffected by the EGFP fluorescent protein. The uptake of 6-CFL was dramatically increased in the 293T_URAT1_6CFL group compared to the 293T_EGFP_6CFL group. Benzbromarone was chosen as a positive control and the results obtained were similar to those reported in the literature.30 The final concentration of the initial screening experiment was set at 100 μM, and the inhibition of the seven natural products obtained by virtual screening was initially validated. The results showed (Fig. 7B) that four compounds had no effect on the uptake of 6-CFL, while NP023335, TN1148, and TN1008 significantly inhibited the uptake of 6-CFL, showing a great potential for activity. The IC50 values of NP023335, TN1148, and TN1008 determined by this method were 18.46, 24.64, and 53.04 μM, respectively (Fig. 7C).Cytotoxicity of inhibitors in vitro
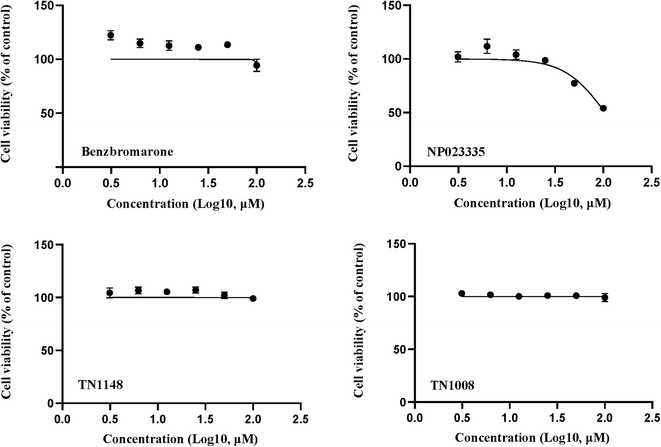
Cell viability was detected by resazurin assay and incubated with benzbromarone and hit compounds for 24 h. The results are shown in Fig. 8. The cell viability of the benzbromarone, TN1148 and TN1008 groups was completely unaffected, indicating that the three compounds were not cytotoxic. The IC50 of compound NP023335 under this method was 104.6 μM, indicating that the compound was slightly toxic. However, it had no effect on the results of the primary screening assay.Molecular dynamics analysis
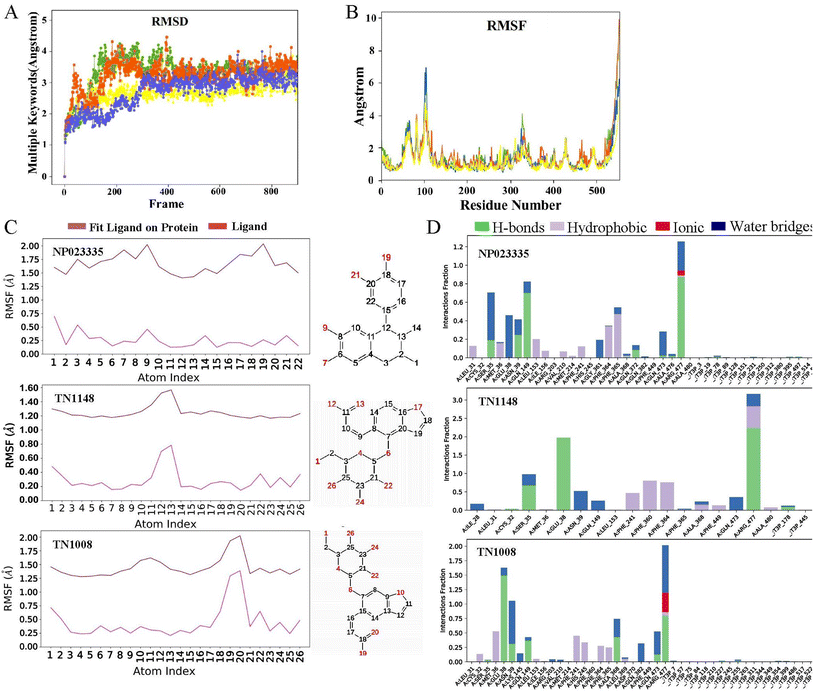
On the basis of molecular docking (Fig. 9), molecular dynamics simulation (MD) was used to study the molecular interactions of protein-ligand complexes and their stability under simulated physiological conditions. Conformational changes in proteins molecules were assessed by calculating residue fluctuations in the RMSD and RMSF of the protein backbone. The result (Fig. 10A) shows that the RMSD of the URAT1 in all complexes fluctuates by less than 3 Å after 20 ns, which is considered to reach a equilibration state in the simulations. As seen in Fig. 10B, the protein RMSF can be used to explain the local fluctuations of each residue. In the simulations, the RMSF values of essential amino acids Ser35, Phe364, Phe365 and Arg477 in the protein pockets interacting with the three ligands were all around 1 Å, indicating that the protein–ligand interactions were largely stable. According to the L-RMSF value, the ligand shows low flexibility during the simulation procedure, which indicates that its internal atomic fluctuation is rather stable. The NP023335 is the most stable molecule when binding to the protein, as illustrated in Fig. 10C. TN1008 and TN1148 form larger fluctuations at positions C19, C20 and C12, C13, respectively. For all compounds, protein–ligand interactions were observed to be hydrogen bonding, hydrophobicity, ionic interactions, and water bridges (Fig. 10D). The three ligands formed strong interactions with Arg477, Asn39, and Glu38. Additionally, NP023335 established strong connections with Phe365, Ala368, and Ser35. TN1148 formed strong interactions with Phe360, Phe364, and Ser35, and TN1008 interacted with Glu473, and Ala368.Evaluation of pharmacokinetic properties of hit compounds
The QikProp module is used to predict the pharmacokinetic properties of molecules such as absorption, distribution, metabolism, and excretion (ADME). The ADME properties of three compounds were predicted and the results are shown in Table 4. According to the findings, compound NP023335 had the molecular weight (Mol MW) less than 500, donor H-bond (HB) less than 5, accpt HB less than 10, and solvent accessible surface (SASA) of 300–1000, all of which were in accordance with empirical drug-like qualities. More importantly, the results obtained by QP![[thin space (1/6-em)]](https://www.rsc.org/images/entities/char_2009.gif) log
log![[thin space (1/6-em)]](https://www.rsc.org/images/entities/char_2009.gif) Po/w, QP
Po/w, QP![[thin space (1/6-em)]](https://www.rsc.org/images/entities/char_2009.gif) log
log![[thin space (1/6-em)]](https://www.rsc.org/images/entities/char_2009.gif) HERG, QPPCaco, and human oral absorption showed that the compound has the advantages of high solubility, low cardiotoxicity, good membrane permeability, and oral absorption. The membrane permeability of the other two compounds is less than 25, which is regarded as poor in cell permeability. The hydrogen bond receptors are more than 10, which is considered unfavorable for drug preparation.
HERG, QPPCaco, and human oral absorption showed that the compound has the advantages of high solubility, low cardiotoxicity, good membrane permeability, and oral absorption. The membrane permeability of the other two compounds is less than 25, which is regarded as poor in cell permeability. The hydrogen bond receptors are more than 10, which is considered unfavorable for drug preparation.
| Molecule | MW | SASA | Donor HB | Accpt HB | QP![[thin space (1/6-em)]](https://www.rsc.org/images/entities/char_2009.gif) log log![[thin space (1/6-em)]](https://www.rsc.org/images/entities/char_2009.gif) Po/w Po/w |
QP![[thin space (1/6-em)]](https://www.rsc.org/images/entities/char_2009.gif) log log![[thin space (1/6-em)]](https://www.rsc.org/images/entities/char_2009.gif) HERG HERG |
QPPCaco | IP (eV) | Human oral absorption |
|---|---|---|---|---|---|---|---|---|---|
| NP-023335 | 300.354 | 544.761 | 4 | 3 | 2.154 | −4.466 | 115.338 | 8.644 | 3 |
| TN-1148 | 366.324 | 557.907 | 5 | 11 | −0.177 | −2.525 | 11.411 | 8.93 | 2 |
| TN-1008 | 366.324 | 593.123 | 5 | 11 | −0.233 | −3.092 | 7.416 | 8.711 | 2 |
Discussion
Hyperuricemia is an early symptom of gout. Its prevalence has been increasing in recent years, and the patients tend to be younger.38 According to clinical studies, 90% of patients with hyperuricemia are caused by insufficient excretion of uric acid.39 Nearly 90% of urate reabsorption is carried out by URAT1, an organic anion transporter that is found in renal proximal tubule epithelial cells. In this study, Alphafold2 was used to construct an accurate URAT1 protein model, which was used for subsequent inhibitor screening. An experimental method based on 6-CFL as a fluorescent substrate was used to assess the ability of the compound to inhibit uric acid uptake. The advantage of this method is that it is simple to operate and environmentally friendly, but its drawback is that the measured inhibition concentration is higher than other methods. For example, the IC50 of benzbromarone and lesinurad were 14.25 ± 4.96 μM and 273.5 ± 35.47 μM, respectively.30 The IC50 of NP023335, TN1148, and TN1008 obtained using this method were 18.46, 24.64, and 53.04 μM, respectively, indicating that the three natural products had excellent inhibitory activities. Natural products as uric acid-lowering drugs are relatively rare in clinical, and the abundant sources of natural products can be used as a new direction for the development of uric acid-lowering drugs. The compound NP023335 was found to be slightly toxic by detecting cytotoxicity. FYU-981, a derivative of benzbromarone, has been reported to effectively reduce its mitochondrial toxicity by modifying the diaryl group in the rigid backbone to a monoaryl group.13 The rigid backbone of the natural product NP023335 is benzocyclohexane, so its mitochondrial toxicity needs further study.The differences between NP023335, TN1148, and TN1008 were further explored by MD simulations and the interaction of these molecules with URAT1 was evaluated. The results showed (Fig. 10D) that the three compounds formed a water bridge with Glu38 or Asn39, which enhanced the interaction between the protein and the ligand. Through the phenolic hydroxyl or thioglycolic acid side chains, they form powerful hydrogen or salt bonds with Arg477, in keeping with the crucial characteristic of URAT1 inhibitors that the chemical provides an anionic binding site. The hydrophobic amino acid Phe364 and Phe365 generate hydrophobic interactions in the hydrophobic docking pocket of the URAT1 protein structure. These two amino acids are the key amino acids reported in the literature.11,25 The strength of the interaction with these two amino acids contributes to the explanation of the activity of the molecule. In comparison to TN1148 and TN1008, NP023335 had a stronger interaction with Phe364 and Phe365. The difference in the activity of the isomers TN1148 and TN1008 is thought to be caused by the fact that TN1148 forms a strong hydrogen bond with Ser35 whereas TN1008 only interacts with Ser35 weakly. In addition, dihedral angle analysis revealed that TN1148 was more stable than TN1008 in the interaction with URAT1 protein. The dihedral angle rotation of compound TN1008 (light red) covers 360°, while that of compound TN1148 (light green) is less than 90° (Fig. S1†). All the atoms involved in the fluctuations are in positions where they can form important contacts with Arg477, which may explain the variation in their activity. The above analysis shows that Ser35, Phe364, Phe365, and Arg477 are essential for the formation of hydrogen bonds or salt bonds between ligands and water molecules or amino acids around the protein pocket, which is consistent with the previous reports. The outcomes of the experiments can also be used to draw the conclusion that drugs having stable interactions with these amino acids have higher activity.
The pharmacokinetic properties of the three compounds were predicted. The molecule NP023335 was discovered to show empirical drug-like qualities when compared to other compounds, with the advantages of high solubility, minimal cardiotoxicity, good membrane permeability, and oral absorption. To further investigate the pharmacokinetic properties of the compounds, the therapeutic effects of the compounds on model mice need to be studied by constructing a mouse model of hyperuricemia.
Conclusion
In this study, a potential natural product inhibitor of URAT1, NP023335, was screened based on virtual screening, cellular level experiments and cytotoxicity assessment. Further MD simulations showed that NP023335 formed hydrogen or salt bonds with Ser35, Phe364, Phe365, and Arg477 of URAT1, and these interactions play an important role in maintaining the tight binding of the complex and retaining the activity. Our results suggest that NP023335 is suitable for the development of novel URAT1 inhibitors.Conflicts of interest
There are no conflicts to declare.Acknowledgements
This work was supported by The National Natural Science Foundation of China (31900910) and Shandong Provincial Major Science and Technology Innovation Project (2020CXGC010503).References
- N. Dalbeth, A. L. Gosling, A. Gaffo and A. Abhishek, Lancet, 2021, 397, 1843–1855 CrossRef CAS PubMed.
- W. Cai, J. Wu, L. Wei, Y. Xie, Y. Liu, S. Zhang, W. Xu, L. Tang, J. Wang and G. Zhao, Molecules, 2018, 23, 252 CrossRef PubMed.
- R. Villegas, Y. B. Xiang, T. Elasy, W. H. Xu, H. Cai, Q. Cai, M. F. Linton, S. Fazio, W. Zheng and X. O. Shu, Nutr., Metab. Cardiovasc. Dis., 2012, 22, 409–416 CrossRef CAS PubMed.
- J. Lu, N. Dalbeth, H. Yin, C. Li, T. R. Merriman and W.-H. Wei, Nat. Rev. Rheumatol., 2019, 15, 413–426 CrossRef PubMed.
- B. J. Paul, K. Anoopkumar and V. Krishnan, Clin. Rheumatol., 2017, 36, 2637–2644 CrossRef PubMed.
- D. J. Levinson and L. B. Sorensen, Ann. Rheum. Dis., 1980, 39, 173–179 CrossRef CAS PubMed.
- I. A. Bobulescu and O. W. Moe, Adv. Chronic Kidney Dis., 2012, 19, 358–371 CrossRef PubMed.
- T. Yu, Y. Kawamura, A. Nakayama, H. Nakaoka and H. Matsuo, Rheumatology, 2021, 5224–5232 Search PubMed.
- Z. a. Zhao, Y. Jiang, L. Li, Y. Chen, Y. Li, Q. Lan, T. Wu, C. Lin, Y. Cao and K. S. Nandakumar, ACS Omega, 2020, 5, 33421–33432 CrossRef CAS PubMed.
- V. F. Azevedo, I. A. Kos, A. B. Vargas-Santos, G. Pinheiro and E. Paiva, Advances in Rheumatology, 2019, 59, 37 CrossRef PubMed.
- P. K. Tan, L. Sha, E. Gunic and J. N. Miner, Sci. Rep., 2017, 7, 665 CrossRef PubMed.
- P. Kaufmann, M. Török, A. Hänni, P. Roberts, R. Gasser and S. Krähenbühl, Hepatology, 2005, 41, 925–935 CrossRef CAS PubMed.
- J. Uda, S. Kobashi, S. Miyata, N. Ashizawa, K. Matsumoto and T. Iwanaga, ACS Med. Chem. Lett., 2020, 11, 2017–2023 CrossRef CAS PubMed.
- S. M. Hoy, Drugs, 2016, 76, 509–516 CrossRef CAS PubMed.
- A. G. Stack, N. Dronamraju, J. Parkinson, S. Johansson, E. Johnsson, F. Erlandsson and R. Terkeltaub, Am. J. Kidney Dis., 2021, 77, 481–489 CrossRef CAS PubMed.
- T. Robert, K. G. Saag, D. S. Goldfarb, B. Scott, B. M. Schechter, V. Ritu, J. Diana, P. Michael and W. B. White, Rheumatology, 2019, 58, 61–69 CrossRef PubMed.
- E. H. B. Maia, L. C. Assis, T. A. de Oliveira, A. M. da Silva and A. G. Taranto, Front. Chem., 2020, 8, 343 CrossRef CAS PubMed.
- T. Hegedűs, M. Geisler, G. L. Lukács and B. Farkas, Cell. Mol. Life Sci., 2022, 79, 1–12 CrossRef PubMed.
- J. Xu, M. Mcpartlon and J. Li, Nat. Mach. Intell., 2021, 3, 601–609 CrossRef PubMed.
- J. Bowie, R. Luthy and D. Eisenberg, Science, 1991, 253, 164–170 CrossRef CAS PubMed.
- G. M. Sastry, M. Adzhigirey, T. Day, R. Annabhimoju and W. Sherman, J. Comput.-Aided Mol. Des., 2013, 27, 221–234 CrossRef PubMed.
- E. Harder, W. Damm, J. Maple, C. Wu, M. Reboul, J. Y. Xiang, L. Wang, D. Lupyan, M. K. Dahlgren and J. L. Knight, J. Chem. Theory Comput., 2016, 12, 281–296 CrossRef CAS PubMed.
- T. A. Halgren, J. Chem. Inf. Model., 2009, 49, 377–389 CrossRef CAS PubMed.
- Y. Zhang, M. Vass, D. Shi, E. Abualrous, J. Chambers, N. Chopra, C. Higgs, K. Kasavajhala, H. Li and P. Nandekar, 2022.
- J. Peng, Q. Hu, C. Gu, B. Liu, F. Jin, J. Yuan, J. Feng, Z. Lei, J. Lan and Q. Dong, Bioorg. Med. Chem. Lett., 2016, 26, 277–282 CrossRef CAS PubMed.
- M. Allegra, M. Tutone, L. Tesoriere, A. Attanzio, G. Culletta and A. M. Almerico, Front. Pharmacol., 2021, 12, 701568 CrossRef CAS PubMed.
- O. Trott and A. J. Olson, J. Comput. Chem., 2010, 31, 455–461 CAS.
- M. M. Mysinger, M. Carchia, J. J. Irwin and B. K. Shoichet, J. Med. Chem., 2012, 55, 6582–6594 CrossRef CAS PubMed.
- Y. Chen, Z. Zhao, Y. Li, Y. Yang and J. Pang, Phytomedicine, 2021, 80, 153374 CrossRef CAS PubMed.
- H. Zhou, G. Zhong, J. Bai, X. Li, W. Peng, L. Zhang and J. Li, Anal. Biochem., 2021, 626, 114246 CrossRef CAS PubMed.
- H. Saito, Y. Toyoda, T. Takada, H. Hirata, A. Ota-Kontani, H. Miyata, N. Kobayashi, Y. Tsuchiya and H. Suzuki, Nutrients, 2020, 12, 1601 CrossRef CAS PubMed.
- K. J. Bowers, D. E. Chow, H. Xu, R. O. Dror, M. P. Eastwood, B. A. Gregersen, J. L. Klepeis, I. Kolossvary, M. A. Moraes and F. D. Sacerdoti, presented at the ACM/IEEE Conference on Supercomputing, Tampa, FL, USA, 2006 Search PubMed.
- S. Jo, T. Kim and W. Im, PLoS One, 2007, 2, e880 CrossRef PubMed.
- K. Rajagopal, P. Varakumar, A. Baliwada and G. Byran, Futur. J. Pharm. Sci., 2020, 6, 104 CrossRef PubMed.
- R. Sankhe, E. Rathi, S. Manandhar, A. Kumar, S. R. K. Pai, S. G. Kini and A. Kishore, J. Mol. Struct., 2021, 1224, 129073 CrossRef CAS PubMed.
- A. Zz, L. A. Jin, A. Pk, L. A. Jian, A. Gs, B. Xc, A. Tw, C. A. Ying, A. Pz and A. Jp, Eur. J. Med. Chem., 2021, 229, 114092 Search PubMed.
- A. Hs, B. Gc, C. Vc and C. Sb, Comput. Biol. Med., 2021, 137, 104808 CrossRef PubMed.
- A. Enomoto, H. Kimura, A. Chairoungdua, Y. Shigeta, P. Jutabha, S. Ho Cha, M. Hosoyamada, M. Takeda, T. Sekine, T. Igarashi, H. Matsuo, Y. Kikuchi, T. Oda, K. Ichida, T. Hosoya, K. Shimokata, T. Niwa, Y. Kanai and H. Endou, Nature, 2002, 417(6887), 447–452 CrossRef CAS PubMed.
- A. So and B. Thorens, J. Clin. Invest., 2010, 120, 1791–1799 CrossRef CAS PubMed.
Footnote |
| † Electronic supplementary information (ESI) available. See DOI: https://doi.org/10.1039/d2ra07193b |
| This journal is © The Royal Society of Chemistry 2023 |

