 Open Access Article
CuO nanorod arrays by gas-phase cation exchange for efficient photoelectrochemical water splitting†
Zhi Zheng abc,
Mikhail Morganb,
Pramathesh Majib,
Xiang Xia
 ac,
Xiaotao Zu*ac and
Weilie Zhou
 *b
*b
aYangtze Delta Region Institute (Huzhou), University of Electronic Science and Technology of China, Huzhou 313001, P. R. China. E-mail: xtzu@uestc.edu.cn
bDepartment of Physics, Advanced Materials Research Institute, University of New Orleans, New Orleans, LA 70148, USA. E-mail: wzhou@uno.edu
cSchool of Physics, University of Electronic Science and Technology of China, Chengdu 611731, P. R. China
First published on 24th January 2023
Abstract
CuO has been considered a promising candidate for photoelectrochemical water splitting electrodes owing to its suitable bandgap, favorable band alignments, and earth-abundant nature. In this paper, a novel gas-phase cation exchange method was developed to synthesize CuO nanorod arrays by using ZnO nanorod arrays as the template. ZnO nanorods were fully converted to CuO nanorods with aspect ratios of 10–20 at the temperature range from 350 to 600 °C. The as-synthesized CuO nanorods exhibit a photocurrent as high as 2.42 mA cm−2 at 0 V vs. RHE (reversible hydrogen electrode) under 1.5 AM solar irradiation, demonstrating the potential as the photoelectrode for efficient photoelectrochemical water splitting. Our method provides a new approach for the rational fabrication of high-performance CuO-based nanodevices.
1. Introduction
Photoelectrochemical (PEC) water splitting has emerged as a sustainable technology for solar energy conversion to meet the growing demand for clean energy. Despite the significant progress that has been made over the past decade, improvement of the effectiveness and robustness of PEC cells to meet the requirement for widespread application remains a challenge.1–3 In this regard, developing high-performance electrode materials is highly desirable. CuO, as an important p-type semiconductor, has been demonstrated as a promising candidate for PEC water splitting owing to its suitable bandgap of around 1.2 eV, which guarantees efficient solar light absorption in the visible light region, thus having a high theoretical maximum photocurrent of 35 mA cm−2 under standard AM 1.5 irradiation.4,5 In addition, the p-type semiconductor nature of CuO provides advantages over n-type semiconductors in terms of hydrogen generation since electrons can be injected into the electrolyte directly. On the other hand, the electrons on n-type semiconductors need to migrate through an external circuit, thus causing a potential energy loss.6 The conduction band edge of CuO lies 0.2 eV more negative than the hydrogen evolution potential, which is favorable as photocatalysts for hydrogen generation.7 Furthermore, the earth-abundance of the copper element makes the large-scale and low-cost fabrication of CuO photoelectrode possible.8For PEC water splitting, one of the most efficient strategies to improve its performance is to construct nanostructures, especially one-dimensional nanostructured photoelectrodes, such as nanowires, nanorods, and nanotubes.9–11 The well-aligned one-dimensional nanostructures provide efficient light absorption, short charge carrier diffusion paths, as well a large surface area resulting in improved exposure of the catalytic sites.12 For the synthesis of CuO one-dimensional nanostructures, thermal oxidation is the most widely used method due to its simplicity.13 It has been recently demonstrated that CuO nanowires synthesized on copper foils by the thermal oxidation method present high performance for PEC water splitting.14,15 However, the growth of CuO nanowires by the thermal oxidation method was usually confined to limited choices of substrates, such as copper or specially fabricated copper-coated substrates, which hindered its broader applications.16,17 In addition, the inevitable cracking and exfoliation problems make the large-area synthesis difficult.18 Therefore, it is highly desirable to develop novel methods for the direct synthesis of CuO one-dimensional nanostructures. Recently, by using ZnO nanostructures as templets, the gas-phase cation exchange method has been adopted as an efficient way for the synthesis of various metal oxide nanostructures, such as Mn3O4, NiO, and CoO.19–21 The exchange process between the metal cations and Zn cations which is facilitated by the thermal disturbance well preserves the original morphology and the crystallinity structure of the ZnO nanostructures, thus has shown great potential in numerous energy-related applications, including water splitting, supercapacitors, and batteries.22–24
Inspired by the above results, we developed a gas-phase cation exchange method for the synthesis of CuO nanorod arrays and demonstrated its potential for efficient PEC water splitting. The ZnO nanorod arrays were first synthesized on the ITO glass and served as the template. Afterward, the ZnO nanorod arrays were converted into CuO nanorod arrays by a facile gas-phase cation exchange process. The CuO nanorod arrays exhibit a promising performance as the efficient photoelectrochemical water splitting electrode with a high photocurrent of 2.42 mA cm−2 at 0 V vs. RHE. Moreover, the successful synthesis of one-dimensional CuO nanostructures in our work provides a new promising platform for new viable nanodevices.
2. Experimental
2.1. Materials synthesis
ZnO nanorod arrays were synthesized by a hydrothermal method. A thin layer of ZnO was first deposited on the ITO glass using RF magnetron sputtering. The substrate was then kept in an aqueous solution containing 40 mM Zn(NO3)2 and 40 mM hexamethylenetetramine under 90 °C for 6 hours. The gas-phase cation exchange was performed to convert the ZnO nanorod arrays to CuO nanorod arrays. In a typical reaction, the as-synthesized ZnO nanorod arrays were placed in a tube furnace and 0.5 g of CuCl2 was placed upstream at a distance of 5 cm. The furnace was heated to 450 °C at 1 °C min−1 and kept for 5 minutes under 50 sccm Ar flow (ESI, Fig. S1†).2.2. Materials characterization
Field-emission scanning electron microscopy (FESEM) and transmission electron microscopy (TEM) images were obtained on a Hitachi S-4800 FESEM and a JEOL 2010 TEM, respectively. The HRTEM image was captured using a FEI Tecnai G2 F30 Twin TEM. The XRD, Raman, and UV-vis measurements were performed by Rigaku MiniFlex II X-ray diffractometer, Thermo Fisher DXR dispersive Raman spectrometer, and Varian Cary 500 Scan UV-vis NIR spectrophotometer, respectively.2.3. PEC water splitting measurements
A Gamry Reference 600 potentiostat was used for the photoelectrochemical measurements. The photoelectrochemical performance was studied under the back-side simulated AM 1.5 G illumination using a New Port 67005 Arc Lamp. The electrochemical impedance spectroscopy (EIS) measurements were conducted with a potential amplitude of 5 mV in the frequency range of 0.01 Hz to 100 kHz. All the photoelectrochemical measurements were performed in a 1 M Na2SO4 aqueous electrolyte at ambient temperature.3. Results and discussion
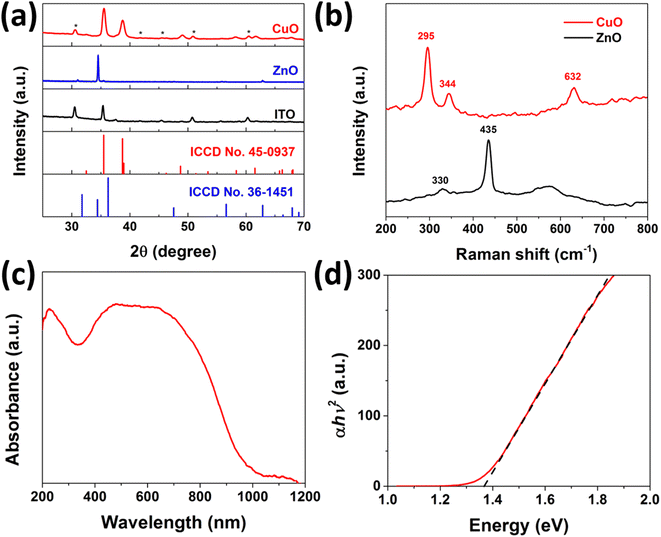
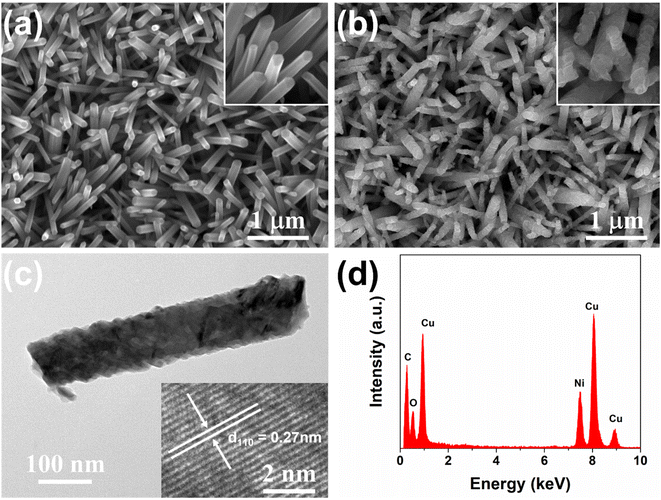
The synthesis of CuO nanorod arrays was accomplished by a gas-phase cation exchange reaction using ZnO nanorod arrays as the sacrificial template. The ZnO nanorod arrays were grown on ITO glass by a hydrothermal method. As shown in Fig. S2 in the ESI,† the color of the ZnO nanorod arrays on ITO glass changed from gray to black after the cation exchange reaction, which corresponds to the color of ZnO and CuO, respectively. The structure of CuO nanorod arrays was first examined by XRD and Raman. Fig. 1a presents the XRD results of the bare ITO glass and the ZnO nanorod arrays before and after the cation exchange reaction. The XRD spectrum of the pristine ZnO nanorod arrays displays a typical XRD pattern of ZnO with a high-purity wurtzite hexagonal phase (JCPDS card no. 36-1451). After the cation exchange reaction, all of the diffraction peaks, except the peaks from the ITO glass as denoted by asterisks, can be indexed as a monoclinic CuO structure (JCPDS no. 45-0934) with no impurity peaks, such as Cu or Cu2O, suggesting the full conversion of ZnO to CuO. Fig. 1b presents the Raman spectra of the ZnO and CuO nanorod arrays. Two peaks located at 435 and 330 cm−1 for ZnO, which are corresponding to the E2 mode and the multiple-phonon scattering process, respectively.25 After the cation exchange reaction, three distinct Raman perks located at 295, 344, and 632 cm−1 emerged, which can be attributed to Ag and two Bg modes of CuO; no peaks from Cu2O can be observed.26 Both XRD and Raman results prove the successful transition of ZnO to phase-pure of CuO. The UV-vis absorbance spectrum as shown in Fig. 1c reveals a broad absorption up to 800 nm with an absorption tail that expands to nearly 1200 nm. The bandgap of the CuO nanorod arrays was determined to be 1.37 eV according to the corresponding Tauc plot (Fig. 1d), indicating a good absorption of the solar light in the visible region and great promise for PEC water splitting application.The morphology and structure of typical CuO nanorods were further investigated using FESEM and TEM. The SEM image of the ZnO nanorod arrays as shown in Fig. 2a reveals the uniform growth of ZnO nanorods on the ITO glass with quasi-vertical alignment. The inset image reveals the typical hexagonal morphology due to its wurtzite crystal structure, with the diameter in the range of 100–200 nm. The average length of ZnO nanorods was measured to be around 2 μm by the cross-section SEM image (Fig. S3a†). After the cation exchange reaction, the overall one-dimensional nanorod array structure was well preserved, and the density and the size of the nanorods remain almost unchanged, as shown in Fig. 2b and S3b.† By comparison, as shown in the inset high-magnification SEM images before and after the cation exchange reaction, the surface of the nanorods became rough, which is similar to previously reported results on other metal oxides.20 The TEM image and the HRTEM of the ZnO nanorod were presented in Fig. S4.† The ZnO nanorod has a typical diameter of around 100 nm with a smooth surface. The as-synthesized ZnO nanorod exhibits a well-crystalline nature, with a lattice fringe space of 5.2 Å corresponding to the (0001) plane of the wurtzite ZnO. Fig. 2c presents the TEM image of one typical CuO nanorod with a width of around 100 nm and a rough surface, consistent with the SEM results. Similar to the previous reports, the nanorod became porous after the cation exchange reaction.20 The inset HRTEM lattice image in Fig. 2c shows the lattice fringes with an interplane spacing of 0.27 nm, corresponding to the (110) planes of CuO, revealing the good preservation of the highly crystalline nature of ZnO. Additionally, the EDS spectrum as shown in Fig. 2d presents only Cu and O singles with no Zn peaks that can be found, further confirming the successful synthesis of CuO nanorods.
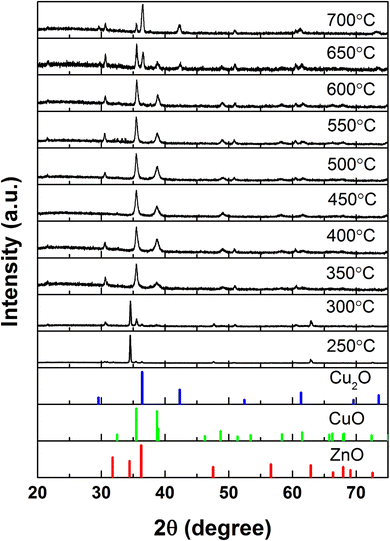
The cation exchange process was further investigated at different temperatures to understand the growth mechanism. As shown in the XRD spectrum of different reaction temperatures in Fig. 3, the transformation of ZnO into CuO occurs at around 300 °C, resulting in a partial cation exchange product. The ZnO was fully converted to CuO at the temperature range from 350 to 600 °C. The conversion of ZnO into CuO is feasible due to the high vapor pressure of CuCl2 as the reaction temperature is close to the melting point of CuCl2. To our surprise, a further increase of the temperature up to around 650 °C results in the formation of CuO/Cu2O and Cu2O at 700 °C, which is contrary to the behavior of CuO synthesized by the thermal oxidation method, where Cu2O was first formed at the lower temperature and further oxidized into CuO nanowires.16 However, the excess temperature causes deterioration to the nanorod structures, as shown in Fig. S5.† Fig. S6† shows the TEM of the nanorod after the cation exchange under 300 °C. A clear interface can be observed as marked using the dashed line, which indicating a core/shell structure was formed. Owing to the fact that the evolution of the CuO was similar to that of previously reported CoO/Co3O4 and Mn3O4 systems, it is reasonable to believe that the translation of ZnO to CuO was realized by the cation exchange process of the outward diffusion of Zn2+ cations and the inward diffusion of Cu2+ cations when the thermal disturbance promotes the vibration of surrounding O2− anions and further phase conversion by the cation interdiffusion through interstitial channels.19,20,27 During the cation exchange process, the Zn species might be pumped away in the form of vaporized ZnCl2 by the following reaction:28,29
| ZnO(s) + CuCl2(g) → CuO(s) + ZnCl2(g) |
 | ||
| Fig. 3 The XRD spectrum of the gas-phase cation exchange products under different reaction temperatures. | ||
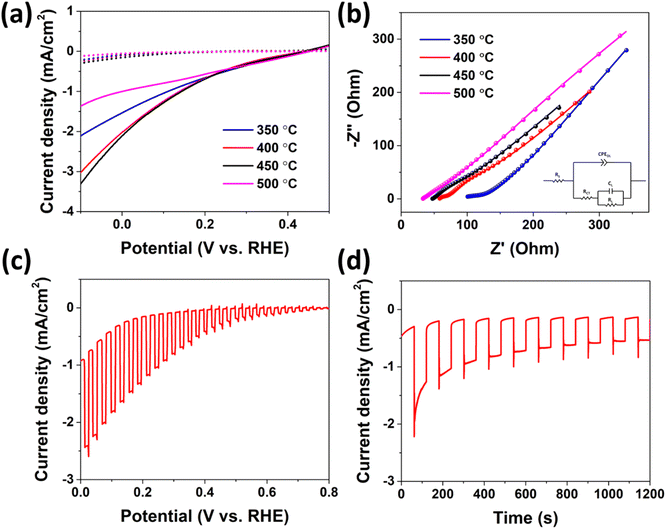
The as-synthesized CuO nanorod arrays on ITO glass were unitized as photoelectrode for PEC water splitting to evaluate their practical application. The electrochemical measurements were conducted in a typical three-electrode configuration with an intensity of 100 mW cm−2 AM 1.5 solar irradiation in a 1 M Na2SO4 electrolyte using the CuO nanorod arrays with the size of 1 × 1 cm2 as the working electrode, Pt as the counter electrode, and Ag/AgCl as the reference electrode. The linear sweep voltammetry curves of CuO nanorod arrays synthesized under different reaction temperatures are presented in Fig. 4a. All the samples exhibit the typical p-type semiconductor character, as the onset potential shifted from ∼200 to ∼400 mV vs. RHE when the light was on. As we expected, the photocurrent increased significantly compared to that without light illumination. The optimized reaction temperature was found to be 450 °C, as the photocurrent at 0 V vs. RHE reaches 2.1 mA cm−2. By comparison of the TEM images (Fig. 2c and S7†), it is clear that CuO nanorods under different temperatures exhibit distinct surface features. At low temperatures of 400 °C, the CuO nanorod has a relatively smooth surface. As the temperature increases, the surface became rough, which may provide more active sites for the photoelectrochemical, resulting in higher PEC performance. However, as the temperature further increases, the nanostructure of the CuO nanorod was deteriorated, thus affecting the PEC performance. The tradeoff between surface active sites and nanostructure integrity might result in an optimal reaction temperature of 450 °C. To understand the impact of the cation exchange temperature on the PEC performance, electrochemical impedance spectroscopy (EIS) was performed to study the semiconducting properties and charge transport behavior. The Nyquist plots and their corresponding equivalent circuit are shown in Fig. 4b. The measured impedance spectra match well with the equivalent circuit, and the equivalent series resistance RS and the charge transfer resistance RCT were presented in the ESI as Table S1.† The RCT, which is associated with the charge transfer between the CuO electrode and the Na2SO4 electrolyte, was found to play a crucial role in terms of affecting the PEC performance, as the photocurrent is proportional to the value of RCT measured. Under the optimized reaction temperature of 450 °C, the charge transfer from CuO to the electrolyte was facilitated, which leads to the enhancement of the conductivity and the increase of the photocurrent.4 The photoelectrochemical behaviors of the optimized CuO electrode were further investigated by the linear sweep voltammetry under a chopped light illumination as shown in Fig. 4c. The overall i–v behavior is similar to that of the steady-state light illumination, though the increment of the dark current was observed, especially towards more negative potential. This was attributed to the possible shunt of the device caused by the exposure of the substrate.12 Nevertheless, the photocurrent reaches 2.42 mA cm−2 at 0 V vs. RHE, which is among the highest value in the pure CuO system reported (Table 1). One main issue of CuO for PEC water splitting applications is its poor stability in aqueous electrolytes due to the photocorrosion of CuO into metallic Cu since the decomposition potential of copper oxide lies close to or within the bandgap.30–32 As shown in Fig. 4d, the photostability measurement was performed at a fixed potential of 0 V vs. RHE. The photocurrent declines at a very short time but stabilizes afterward, resulting in reasonable stability by retaining about 50% of the initial photocurrent after 1200 s under the light on/off condition.
| PEC electrode | Substrate | Synthesis method | Photocurrent density | Ref. |
|---|---|---|---|---|
| CuO nanorod arrays | ITO glass | Gas-phase cation exchange method | 2.42 mA cm−2 at 0 V vs. RHE | Present work |
| CuO nanowires | Cu foil | Thermal oxidation | 1.4 mA cm−2 at 0 V vs. RHE | 15 |
| CuO nanoleaves | FTO glass | Aqueous solution growth | 1.5 mA cm−2 at 0 V vs. RHE | 33 |
| Nanostructured CuO | Cu foil | Chemical bath deposition (CBD) | 1.3 mA cm−2 at 0 V vs. RHE | 34 |
| Tree branch-shaped CuO | FTO glass | Hybrid microwave annealing (HMA) | 4.4 mA cm−2 at 0 V vs. RHE | 35 |
| CuO thin films | FTO glass | Sputtering | 1.68 mA cm−2 at 0 V vs. RHE | 36 |
| CuO nanoparticles | FTO glass | Sol–gel dip-coating process | 0.94 mA cm−2 at 0 V vs. RHE | 37 |
| Nanotextured CuO films | ITO glass | Cold spray method | 3.1 mA cm−2 at 0 V vs. RHE | 38 |
| CuO thin films | FTO glass | Microwave-assisted method | 1.15 mA cm−2 at 0 V vs. RHE | 39 |
4. Conclusion
In summary, we have demonstrated a gas-phase cation exchange method to synthesize CuO nanorod arrays by using ZnO as the sacrificial template. The optimized CuO nanorod arrays exhibit excellent performance with a photocurrent density up to 2.42 mA cm−2 at 0 V vs. RHE. This work provides a new pathway for the efficient synthesis of one-dimensional CuO nanostructures and demonstrated the feasibility on the practical application of photoelectrochemical water splitting.Data availability
The data that support the findings of this study are available from the corresponding author upon reasonable request.Conflicts of interest
The authors have no conflicts to disclose.Acknowledgements
This work was financially supported by the NSAF Joint Foundation of China (Grant No. U1630126). W Zhou thanks the support of the CRS and SCORE awards from the University of New Orleans.References
- Y.-H. Chiu, T.-H. Lai, M.-Y. Kuo, P.-Y. Hsieh and Y.-J. Hsu, APL Mater., 2019, 7, 080901 CrossRef.
- P.-Y. Hsieh, J.-Y. Wu, T.-F. M. Chang, C.-Y. Chen, M. Sone and Y.-J. Hsu, Arab. J. Chem., 2020, 13, 8372–8387 CrossRef CAS.
- C.-W. Tsao, M.-J. Fang and Y.-J. Hsu, Coord. Chem. Rev., 2021, 438, 213876 CrossRef CAS.
- S. Masudy-Panah, R. S. Moakhar, C. S. Chua, H. R. Tan, T. I. Wong, D. Chi and G. K. Dalapati, ACS Appl. Mater. Interfaces, 2016, 8, 1206–1213 CrossRef CAS PubMed.
- R. S. Moakhar, S. M. Hosseini-Hosseinabad, S. Masudy-Panah, A. Seza, M. Jalali, H. Fallah-Arani, F. Dabir, S. Gholipour, Y. Abdi, M. Bagheri-Hariri, N. Riahi-Noori, Y.-F. Lim, A. Hagfeldt and M. Saliba, Adv. Mater., 2021, 33, 2007285 CrossRef PubMed.
- A. Paracchino, V. Laporte, K. Sivula, M. Grätzel and E. Thimsen, Nat. Mater., 2011, 10, 456–461 CrossRef CAS PubMed.
- Y.-F. Lim, C. S. Chua, C. J. J. Lee and D. Chi, Phys. Chem. Chem. Phys., 2014, 16, 25928–25934 RSC.
- Z. Zhang, R. Dua, L. Zhang, H. Zhu, H. Zhang and P. Wang, ACS Nano, 2013, 7, 1709–1717 CrossRef CAS PubMed.
- W. Yang, R. R. Prabhakar, J. Tan, S. D. Tilley and J. Moon, Chem. Soc. Rev., 2019, 48, 4979–5015 RSC.
- C. Cai, S. Han, X. Zhang, J. Yu, X. Xiang, J. Yang, L. Qiao, X. Zu, Y. Chen and S. Li, RSC Adv., 2022, 12, 6205–6213 RSC.
- M.-J. Fang, C.-W. Tsao and Y.-J. Hsu, J. Phys. D: Appl. Phys., 2020, 53, 143001 CrossRef CAS.
- J. Luo, L. Steier, M.-K. Son, M. Schreier, M. T. Mayer and M. Grätzel, Nano Lett., 2016, 16, 1848–1857 CrossRef CAS PubMed.
- L. Xiang, J. Guo, C. Wu, M. Cai, X. Zhou and N. Zhang, J. Mater. Res., 2018, 33, 2264–2280 CrossRef CAS.
- X. Zhao, P. Wang, Z. Yan and N. Ren, Chem. Phys. Lett., 2014, 609, 59–64 CrossRef CAS.
- J. Li, X. Jin, R. Li, Y. Zhao, X. Wang, X. Liu and H. Jiao, Appl. Catal., B, 2019, 240, 1–8 CrossRef CAS.
- X. Jiang, T. Herricks and Y. Xia, Nano Lett., 2002, 2, 1333–1338 CrossRef CAS.
- X. Gao, J. Li, R. Du, J. Zhou, M.-Y. Huang, R. Liu, J. Li, Z. Xie, L.-Z. Wu, Z. Liu and J. Zhang, Adv. Mater., 2017, 29, 1605308 CrossRef PubMed.
- Q. Zhang, K. Zhang, D. Xu, G. Yang, H. Huang, F. Nie, C. Liu and S. Yang, Prog. Mater. Sci., 2014, 60, 208–337 CrossRef CAS.
- C. W. Na, S.-Y. Park, J.-H. Chung and J.-H. Lee, ACS Appl. Mater. Interfaces, 2012, 4, 6565–6572 CrossRef CAS PubMed.
- H. Zhang, T. Ling and X. W. Du, Chem. Mater., 2015, 27, 352–357 CrossRef CAS.
- T. Zhang, M.-Y. Y. Wu, D.-Y. Y. Yan, J. Mao, H. Liu, W.-B. B. Hu, X.-W. W. Du, T. Ling and S.-Z. Z. Qiao, Nano Energy, 2018, 43, 103–109 CrossRef CAS.
- T. Ling, T. Zhang, B. Ge, L. Han, L. Zheng, F. Lin, Z. Xu, W. W.-B. Hu, X.-W. X. Du, K. Davey and S.-Z. S. Qiao, Adv. Mater., 2019, 31, 1807771 CrossRef PubMed.
- Y.-J. Li, L. Cui, P.-F. Da, K.-W. Qiu, W.-J. Qin, W.-B. Hu, X.-W. Du, K. Davey, T. Ling and S.-Z. Qiao, Adv. Mater., 2018, 30, 1804653 CrossRef PubMed.
- T. Ling, P. Da, X. Zheng, B. Ge, Z. Hu, M. Wu, X.-W. Du, W.-B. Hu, M. Jaroniec and S.-Z. Qiao, Sci. Adv., 2018, 4, eaau6261 CrossRef CAS PubMed.
- K. Wang, J. Chen, W. Zhou, Y. Zhang, Y. Yan, J. Pern and A. Mascarenhas, Adv. Mater., 2008, 20, 3248–3253 CrossRef CAS.
- J. F. Xu, W. Ji, Z. X. Shen, W. S. Li, S. H. Tang, X. R. Ye, D. Z. Jia and X. Q. Xin, J. Raman Spectrosc., 1999, 30, 413–415 CrossRef CAS.
- C. W. Na, H.-S. Woo, H.-J. Kim, U. Jeong, J.-H. Chung and J.-H. Lee, CrystEngComm, 2012, 14, 3737 RSC.
- C. W. W. Na, S.-Y. Park, J.-H. Chung and J.-H. Lee, ACS Appl. Mater. Interfaces, 2012, 4, 6565–6572 CrossRef CAS PubMed.
- E. Thimsen, Q. Peng, A. B. F. Martinson, M. J. Pellin and J. W. Elam, Chem. Mater., 2011, 23, 4411–4413 CrossRef CAS.
- U. Shaislamov, K. Krishnamoorthy, S. J. Kim, A. Abidov, B. Allabergenov, S. Kim, S. Choi, R. Suresh, W. M. Ahmed and H.-J. Lee, Int. J. Hydrogen Energy, 2016, 41, 2253–2262 CrossRef CAS.
- C. Y. Toe, Z. Zheng, H. Wu, J. Scott, R. Amal and Y. H. Ng, Angew. Chem., Int. Ed., 2018, 57, 13613–13617 CrossRef CAS PubMed.
- H. Xing, L. E, Z. Guo, D. Zhao, X. Li and Z. Liu, Inorg. Chem. Front., 2019, 6, 2488–2499 RSC.
- A. Kushwaha, R. S. Moakhar, G. K. L. Goh and G. K. Dalapati, J. Photochem. Photobiol., A, 2017, 337, 54–61 CrossRef CAS.
- A. Ray, I. Mukhopadhyay, R. Pati, Y. Hattori, U. Prakash, Y. Ishii and S. Kawasaki, J. Alloys Compd., 2017, 695, 3655–3665 CrossRef CAS.
- Y. J. Jang, J. W. Jang, S. H. Choi, J. Y. Kim, J. H. Kim, D. H. Youn, W. Y. Kim, S. Han and J. S. Lee, Nanoscale, 2015, 7, 7624–7631 RSC.
- S. Masudy-Panah, R. S. Moakhar, C. S. Chua, A. Kushwaha, T. I. Wong and G. K. Dalapati, RSC Adv., 2016, 6, 29383–29390 RSC.
- J. Toupin, H. Strubb, S. Kressman, V. Artero, N. Krins and C. Laberty-Robert, J. Sol-Gel Sci. Technol., 2019, 89, 255–263 CrossRef CAS.
- J. G. Lee, D.-Y. Kim, J.-H. Lee, M. Kim, S. An, H. S. Jo, C. Nervi, S. S. Al-Deyab, M. T. Swihart and S. S. Yoon, ACS Appl. Mater. Interfaces, 2016, 8, 15406–15414 CrossRef CAS PubMed.
- S. M. Hosseini H., R. S. Moakhar, F. Soleimani, A. Goudarzi and S. K. Sadrnezhaad, ECS Trans., 2020, 97, 845 CrossRef.
Footnote |
| † Electronic supplementary information (ESI) available. See DOI: https://doi.org/10.1039/d2ra07648a |
| This journal is © The Royal Society of Chemistry 2023 |


