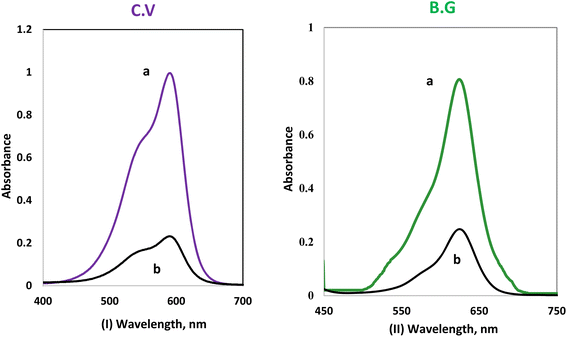
CV and BG dye retention e1 profile on A-PH-CMC/MWCNTs from aqueous solution. The solution pH is one of the critical parameters for achieving adsorption and recovery for heavy metal ions and dyes. The sorption profile of the aqueous solutions containing CV and BG dyes at different pH values by the A-PH-CMC/MWCNT nanocomposites solid phase was critically studied after shaking for 75 min at room temperature. The number of dyes in the aqueous phase after equilibrium was determined photometrically.43 The sorption percentage (%E) of CV sorption onto the A-PH-CMC/MWCNT increased markedly upon increasing the solution pH until a value of 8.0 was reached. After this, the percentage decreased with increasing pH. The sorption percentage %E of BG sorption onto the A-PH-CMC/MWCNT nanocomposites increased markedly on increasing the solution pH until its value reached 6.0. After this, the percentage decreased with increasing pH. Representative data are shown in Fig. 5. Therefore, the pH value was adjusted using HCl or NaOH until the optimum value of pH 8.0 was obtained for CV. A pH of 6.0 was selected as the optimum value for BG in the subsequent analysis.
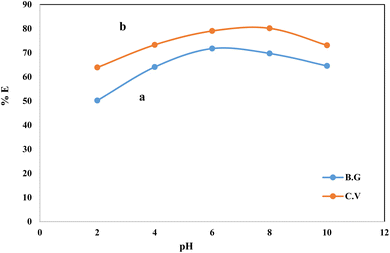 |
| | Fig. 5 Effect of the solution pH on the sorption percentage of BG (a) and CV (b) dyes from aqueous solutions onto (0.01 ± 0.002 g) A-PH-CMC/MWCNT nanocomposites with shaking time 75 min at 25 ± 0.1 °C. | |
The effect of the solid phase A-PH-CMC/MWCNT mass on the percentage of dyes adsorbed from the aqueous solution was studied with CV and BG at a concentration of 5 mg L−1 (Fig. 6). The dye percentage removed from the aqueous solution increased from 71% to 98% as the A-PH-CMC/MWCNT nanocomposites dose increased from 5 mg to 30 mg for the CV dye. At the same time, it increased from 64% to 96% with the increase in the A-PH-CMC/MWCNT nanocomposites dose, from 5 mg to 30 mg for the BG dye. The proportion of adsorbed molecules rose due to more adsorption-active sites because of the higher solid-phase concentration. Hence, 10 mg of A-PH-CMC/MWCNT nanocomposites, which corresponded to 72% for BG and 78% for CV, was used to observe the effect of the other parameters on the adsorption process.
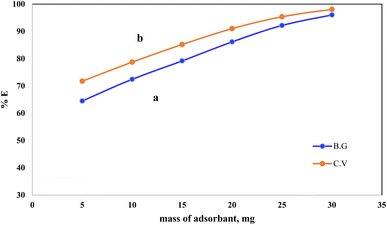 |
| | Fig. 6 Effect of A-PH-CMC/MWCNT nanocomposites mass on the adsorption percentage of dyes species BG (a) and CV (b) from aqueous solutions with a shaking time of 75 min and at a temperature of 25 °C. | |
Pollutant removal by adsorption depends on several factors, but the contact duration between the adsorbate and adsorbent is the most important. Dye removal efficiency by A-PH-CMC/MWCNT nanocomposites was investigated as a function of contact time. The findings are shown in Fig. 7, in which the adsorption process is accelerated with increasing contact time. Most dyes were adsorbed in the first 50 min, when this impact was most pronounced. Within 75 min, the dye clearance percentage stabilised. This suggests that two distinct processes were involved in the adsorption of dyes on the A-PH-CMC/MWCNT nanocomposites, with the first being the most rapid and consisting of the transfer of dyes species from the aqueous phase to the exterior surface of A-PH-CMC/MWCNTs. The second was the slower step, which was the diffusion of dye species between the A-PH-CMC/MWCNT nanocomposite bundles. The study also examined how the increasing temperature of the solution affected the adsorption process. Results were compared at a consistent shaking time over four temperatures (283 K, 298 K, 313 K and 328 K). When the solution temperature was raised from 283 K to 298 K, 313 K and 328 K, a statistically significant increase in the proportion of dyes removed by A-PH-CMC/MWCNT nanocomposites was observed (Fig. 8). According to these findings, this adsorption mechanism was endothermic.
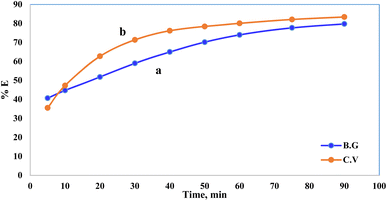 |
| | Fig. 7 Effect of shaking time on the sorption percentage of dye species BG (a) and CV (b) from aqueous solutions onto A-PH-CMC/MWCNT nanocomposites at a temperature of 25 °C. | |
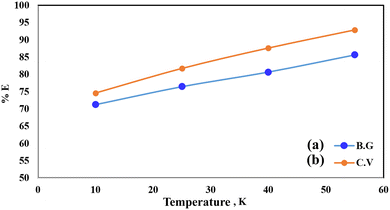 |
| | Fig. 8 Effect of temperature on the sorption percentage of dye species BG (a) and CV (b) from aqueous solutions onto A-PH-CMC/MWCNT nanocomposites at 283 K, 298 K, 313 K and 328 K. | |
Once distinct adsorption scenarios may be induced by ionic strength, in which electrostatic interactions between the solid phase surfaces and the dye species are either attractive or repulsive, it is of paramount importance. The adsorption of BG and CV dyes onto the A-PH-CMC/MWCNT nanocomposites solid phase was studied concerning the ionic strength available. Adsorption experiments were performed with varying doses of KNO3 (i.e., 0.025, 0.05, 0.075 and 0.1 mol L−1) to alter the ionic strength (Fig. 9). Increasing the ionic strength of the aqueous solution resulted in a marginal reduction in the proportion of dyes species absorbed. This may be explained by the fact that the presence of a cation, such as K+, reduces the interaction of the dye species with the adsorbent surface. This happens because of the build-up of charge around the adsorbent surface.39
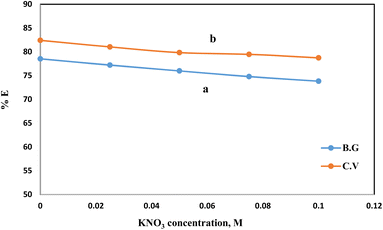 |
| | Fig. 9 Effect of KNO3 concentration on the adsorption percentage of dyes species BG (a) and CV (b) from aqueous solutions onto A-PH-CMC/MWCNT nanocomposites at a temperature of 25 °C. | |
Kinetic behaviour of BG and CV dye sorption onto A-PH-CMC/MWCNT nanocomposites. It is crucial to understand the sorption kinetics of contaminants, such as dye species, from aqueous solutions because they shed light on the reaction routes and the mechanisms underlying the sorption processes. Film diffusion and intraparticle diffusion have a role in the retention of dye species on solid phase A-PH-CMC/MWCNT nanocomposites. The faster of the two will determine the transport rate. The computation of the half-life time t(1/2) of dye sorption from the aqueous solutions onto the solid sorbents A-PH-CMC/MWCNT nanocomposites provided evidence in favour of the conclusion drawn from the effect of shaking time. The plots of log![[thin space (1/6-em)]](https://www.rsc.org/images/entities/char_2009.gif) C/Co vs. time for the sorption of BG and CV dyes onto A-PH-CMC/MWCNT nanocomposites were used to obtain the values of t1/2. According to earlier reports, the value of t(1/2) was determined to be 1.5 ± 0.04 min for BG and 1.6 ± 0.05 min for CV dyes.46 Therefore, the overall transport rate is controlled by whichever of the film and intraparticle diffusion processes is faster in the case of dye species sorption onto the A-PH-CMC/MWCNT nanocomposite sorbent. The Weber–Morris model was applied to the dye species absorbed by the A-PH-CMC/MWCNT sorbent:47where Rd is the intraparticle transport rate constant, and qt is the concentration of sorbed dye at time t. The plot of qt versus time is shown in Fig. 10. By calculating Rd from the separate slopes of Weber–Morris plots (Fig. 7), we found that the BG dye had an Rd value of 1.43 mg g−1 and an R2 value of 0.991, while the CV dye had an Rd value of 1.75 mg g−1 and an R2 value of 0.919.
C/Co vs. time for the sorption of BG and CV dyes onto A-PH-CMC/MWCNT nanocomposites were used to obtain the values of t1/2. According to earlier reports, the value of t(1/2) was determined to be 1.5 ± 0.04 min for BG and 1.6 ± 0.05 min for CV dyes.46 Therefore, the overall transport rate is controlled by whichever of the film and intraparticle diffusion processes is faster in the case of dye species sorption onto the A-PH-CMC/MWCNT nanocomposite sorbent. The Weber–Morris model was applied to the dye species absorbed by the A-PH-CMC/MWCNT sorbent:47where Rd is the intraparticle transport rate constant, and qt is the concentration of sorbed dye at time t. The plot of qt versus time is shown in Fig. 10. By calculating Rd from the separate slopes of Weber–Morris plots (Fig. 7), we found that the BG dye had an Rd value of 1.43 mg g−1 and an R2 value of 0.991, while the CV dye had an Rd value of 1.75 mg g−1 and an R2 value of 0.919.
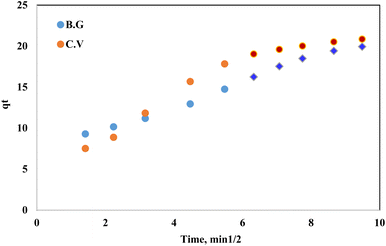 |
| | Fig. 10 Weber–Morris plot of the sorbed dyes BG and CV from aqueous solutions onto the A-PH-CMC/MWCNT nanocomposites versus the square root of time. Experimental conditions are mentioned in the batch extraction step. | |
The fractional power function kinetic model was modified and derived from the Freundlich equation. This was represented by the following formula:48
where
qt (mg g
−1) is the amount of dye species (BG and CV) adsorbed per unit mass of A-PH-CMC/MWCNT nanocomposites at any time
t. At the same time,
a and
b are coefficients with
b equal to 1. When the fractional power function equation was applied to the experimental data of the adsorption process, as shown in
Fig. 11, the data fit well, with a correlation coefficient (
R2) value of 0.963 for the BG dyes and 0.973 for the CV dyes. The values of
a and
b are provided in
Table 1. These findings may indicate that the fractional power function kinetic model is insufficient for describing the dye species adsorption by the A-PH-CMC/MWCNT nanocomposite.
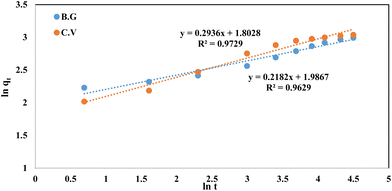 |
| | Fig. 11 Fractional power model plots of dyes BG and CV from aqueous solutions onto A-PH-CMC/MWCNT nanocomposites. Experimental conditions are mentioned in the batch extraction. | |
Table 1 Adsorption of BG and CV dyes onto A-PH-CMC/MWCNT nanocomposites at 293 K, using varying kinetic model parameters
| Weber–Morris model |
| |
|
Rd |
|
R2 |
| BG |
|
1.43 |
|
0.991 |
| CV |
|
1.75 |
|
0.919 |
| Fractional power function kinetic model |
| |
a |
b |
ab |
R2 |
| BG |
7.24 |
0.218 |
1.57 |
0.963 |
| CV |
6.05 |
0.293 |
1.77 |
0.973 |
| The pseudo-first-order kinetic (Lagregen) model |
| |
qe, exp (mg g−1) |
qe, calc (mg g−1) |
k1 |
R2 |
| BG |
19.93 |
13.8 |
0.04 |
0.958 |
| CV |
20.85 |
14.4 |
0.05 |
0.995 |
| The pseudo-second-order kinetic model |
| |
qe, exp (mg g−1) |
qe, calc (mg g−1) |
k2 |
R2 |
| BG |
19.93 |
20.83 |
5.9 × 10⁻³ |
0.991 |
| CV |
20.85 |
22.42 |
6.2 × 10⁻³ |
0.998 |
| Elovich kinetic model |
| |
α, (g mg−1 min−1) |
β, (mg g−1 min−1) |
|
R2 |
| BG |
2.05 |
3.015 |
|
0.926 |
| CV |
0.655 |
3.944 |
|
0.976 |
Correlation-coefficient values for the fractional power function, the Lagergren pseudo-first order, the pseudo-second order and the Elovich models used to fit the experimental data on the adsorption of dyes species (BG and CV) are shown in Table 1. The pseudo-second-order kinetic model was the most appropriate to describe the adsorption of dyes species by the A-PH-CMC/MWCNT nanocomposites.
When modelling adsorption rates in liquid-phase systems, the Lagergren equation is often used. The Lagergren equation was applied to the data describing the shift in sorption of dyes (BG and CV) from aqueous media onto the A-PH-CMC/MWCNT nanocomposites solid phase:49
| |
log(qe − qt) = log![[thin space (1/6-em)]](https://www.rsc.org/images/entities/char_2009.gif) qe − K Lagert/2.303 qe − K Lagert/2.303
| (3) |
where
qe is the equilibrium sorbed quantity of chemical species per unit mass of sorbent,
K Lager is the first-order overall rate constant for the retention process and
t is the duration. A linear relationship between log(
qe −
qt) and time is shown in
Fig. 12. The calculated values of
K Lager and
qe for the BG dye were 0.040 min
−1 and 13.8 mg g
−1, respectively, with a correlation coefficient (
R2) of 0.958. For the CV dye, these values were 0.050 min
−1 and 14.4 mg g
−1, respectively, with a correlation coefficient (
R2) of 0.995.
32
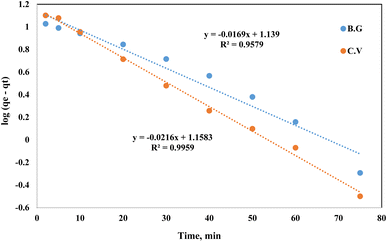 |
| | Fig. 12 Lagergren plot of dyes BG and CV uptake onto A-PH-CMC/MWCNT nanocomposites versus time. Experimental conditions are mentioned in the batch extraction step. | |
The pseudo-second-order equation has also been interpreted as a special kind of Langmuir kinetics,42 assuming that (i) the adsorbate concentration is constant in time and (ii) the total number of binding sites depends on the amount of adsorbate adsorbed at equilibrium. The linearised form of the pseudo-second-order rate was expressed by the following equation:
| |
 | (4) |
In this equation, qe and qt are the equilibrium and time-independent quantities adsorbed per unit mass, respectively, while h is the initial sorption rate. T/qt vs. time graphs were linear under these conditions, as seen in Fig. 13. An excellent correlation (R2 = 0.991) was discovered between the slope and intercept for BG dye and the second-order rate constant (k2) and equilibrium capacity (qe) for dye species. These values were determined to be equivalent at 5.9 × 10⁻³ g (mg min)−1 and 20.83 mg g−1. An excellent correlation (R2 = 0.998) was discovered between the concentrations of CV, the second-order rate constant (k2) and equilibrium capacity (qe) for dyes species. These values were determined to be equivalent at 6.2 × 10⁻³ g (mg min)−1 22.42 mg g−1. Dyes and their rates of consumption (in mg min−1) and concentrations (mg g−1) were determined to be identical. All of the experimental results matched well with the values and the values of the pseudo-second-order rate constant, k2, which frequently relied on observed variables, such as those starting metal concentration, solution pH and temperature.
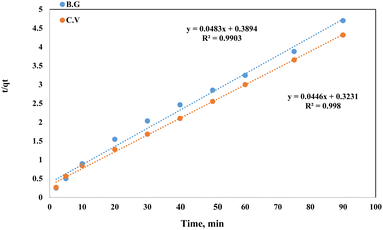 |
| | Fig. 13 Pseudo-second order plot of dyes BG and CV uptake onto A-PH-CMC/MWCNT nanocomposites versus time. Experimental conditions are mentioned in the batch extraction step. | |
The rate equation was derived from the Elovich model of adsorption capacity.28 This model works well for systems with heterogeneous adsorptive surfaces, and may be used for chemisorption kinetics in general. This model is described by the following formula:
The initial adsorption rate is denoted by (α), while the desorption coefficient is represented by (β). Linearity was observed in the plot of qt against the time in Fig. 14. For the BG dye adsorbed onto A-PH-CMC/MWCNTs, the Elovich values were equal to 2.05 g mg−1 min−1 and 3.015 mg g−1 min−1, respectively (R2 = 0.926). At the same time, the dye adsorbed onto the A-PH-CMC/MWCNT nanocomposites for CV was equivalent to 0.655 g mg−1.
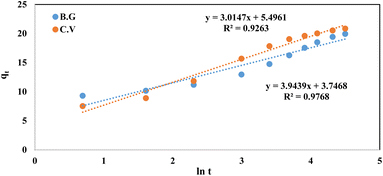 |
| | Fig. 14 Elovich model plot for dyes BG and CV uptake onto A-PH-CMC/MWCNT nanocomposites versus time. Experimental conditions are mentioned in the batch extraction step. | |
Thermodynamic characteristics of BG and CV dye retention onto A-PH-CMC/MWCNT nanocomposites dye species retention onto the A-PH-CMC/MWCNT nanocomposites was investigated by studying the sorption of BG and CV dyes onto the solid phase at different temperatures (283–328 K). The following equations were used to determine values for the thermodynamic constants (ΔH, ΔS and ΔG):39
| |
 | (6) |
| |
ΔG = −RT![[thin space (1/6-em)]](https://www.rsc.org/images/entities/char_2009.gif) ln ln![[thin space (1/6-em)]](https://www.rsc.org/images/entities/char_2009.gif) Kc Kc
| (8) |
where Δ
H, Δ
G and Δ
S represent the changes in enthalpy, Gibbs free energy and entropy, respectively.
K is the equilibrium constant,
T is the temperature in Kelvin, and
R is the gas constant (8.314 J K
−1 mol
−1). Using this equation, we were able to determine the
KC values for the equilibrium retention of BG and CV dyes from the aqueous test solution onto the solid:
| |
 | (9) |
where
Ca is the quantity of BG and CV dyes adsorbed onto the solid phase per litre at equilibrium, and
Ce is the equilibrium concentration of BG and CV dyes in an aqueous solution (in millimoles per litre) (mg L
−1). The retention of BG and CV dyes onto A-PH-CMC/MWCNT nanocomposites solid phase was linear, as shown by a plot of ln
![[thin space (1/6-em)]](https://www.rsc.org/images/entities/char_2009.gif) KC vs.
KC vs. 1000/
T (
Fig. 15) across the temperature range (283–328 K). The retention process of BG and CV dyes onto the utilised sorbents is endothermic, as shown by the fact that the equilibrium constant rises with increasing temperature. The numerical values of Δ
H, Δ
S and Δ
G for dyes species (BG and CV) retention calculated from the slope and intercept of the linear plot of ln
![[thin space (1/6-em)]](https://www.rsc.org/images/entities/char_2009.gif) KC versus
KC versus 1000/
T (
Fig. 15) were 14.7 ± 0.2 kJ mol
−1, 59.5 ± 0.4 J mol
−1 K
−1 and −3.0 ± 0.1 kJ mol
−1 (at 298 K), respectively, for the BG dye. They were 25.2 ± 0.3 kJ mol
−1, 97.6 ± 0.5 J mol
−1 K
−1 and −3.9 ± 0.2 kJ mol
−1 (at 298 K), respectively, for the BG dye.
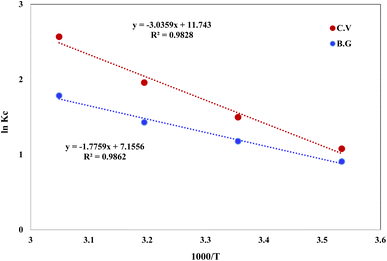 |
| | Fig. 15 Plot of ln KC of BG and CV dyes sorption from aqueous media onto A-PH-CMC/MWCNT nanocomposites versus 1000/T. | |
The extent to which the absorption process is endothermic may be inferred from the H value, which indicates the difference in bond energy between the sorbent and the analyte. The release of water molecules from the hydration sphere during the adsorption processes resulted in a positive value of S for the solid phase A-PH-CMC/MWCNT nanocomposites. This is an indication of an increase in the degree of freedom at the solid–liquid interface, which is commonly observed during the binding of dyes species (BG and CV). The generated solid phase had a negative G at 298 K, suggesting that the dye species were retained onto A-PH-CMC/MWCNT nanocomposites by a spontaneous and physical sorption process.
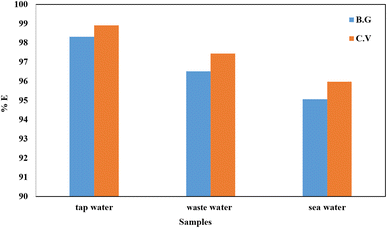
Meanwhile, the A-PH-CMC/MWCNT nanocomposites had adequate recyclability in the actual samples, and the resorption ratio could still approach 95%. Moreover, the pH, contact time, adsorbent dose and temperature and KNO3 effects, which were the most essential factors in the adsorption process, were fine-tuned. As a further step, we calculated the adsorption kinetics of both dyes using several models. Ultimately, we settled on the pseudo-second-order model as the most accurate representation of the data. Electrostatic forces were shown to play a significant role in the adsorption of the BG and CV dyes onto the A-PH-CMC/MWCNT nanocomposites, as demonstrated by the desorption tests. These results show that A-PH-CMC/MWCNT nanocomposites are the most effective low-cost adsorbents for removing harmful BG and CV dyes from wastewater treatment systems.
 Open Access Article
 *a,
Mahmoud A. Hussein
 *ab and
R. M. Guedesc
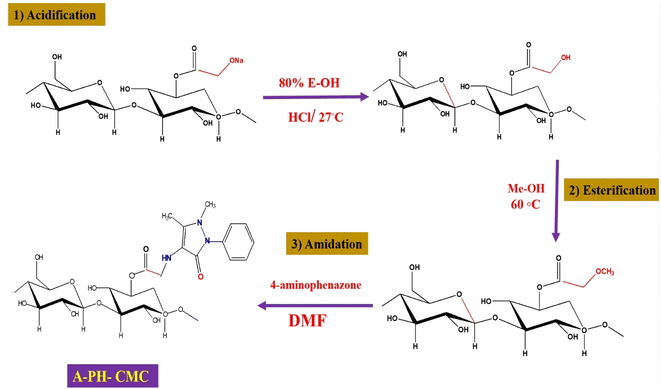
![[thin space (1/6-em)]](https://www.rsc.org/images/entities/char_2009.gif) 000 commercially available colours.15 Moreover, various organic contaminants (e.g., dyes, medicines, pesticides) are increasing in the water due to increased industry, urbanisation and unrestricted human activities. These substances are mutagenic and cause allergic dermatitis, skin burns and serious eye damage.16,17 These organic pollutants can affect human and animal health due to their carcinogenicity and poor biodegradability in nature. Some of them are persistent organic pollutants, resistant to environmental deterioration, and continue to enter the ecosystem.18 Dye levels in wastewater, for instance, are significantly increasing due to extensive clothing usage and everyday life items. This is one of the greatest problems worldwide.19,20 Polysaccharides, a broad class of carbohydrate polymers derived from natural sources, have been distinguished in wastewater treatment applications. This is because of their exceptional properties, including adsorbent performance, renewability, biodegradability, biocompatibility and ease of modification. Nonetheless, polysaccharides have intrinsic drawbacks. For instance, most polysaccharides have low activity and are unsuitable for direct use as adsorbents due to their difficulties in regeneration and reuse. The mechanical characteristics of polysaccharide matrices are often poor and necessitate additional matrices.21 Scientists are committed to creating enhanced, multifunctional polysaccharide-based adsorbents that can adapt to harsh environments and have more desired features. Adjusting the physicochemical parameters of polysaccharides may often improve the efficacy of polysaccharide-based adsorbents for wastewater treatment. For instance, polysaccharide-based adsorbents created by cross-linking reactions are the most commonly used method. Carboxymethyl cellulose (CMC) is an anionic cellulose ether with greater water solubility than cellulose. Due to its hydrophilicity, biodegradability and biocompatibility, CMC is often employed in food packaging, sewage treatment and medicine administration.22–24 Furthermore, CMC has a carboxyl group (COO) on its side chain, resulting in pH sensitivity. Common modification techniques concentrate on the hydroxyl and carboxyl groups on the CMC molecular chain as reactive sites. Furthermore, using the negatively charged properties of the CMC molecular chain enables its production. It has higher activity through its association with materials with high adsorption properties, and is simultaneously biocompatible, biodegradable and highly adsorbable.25–28 In this study, the CMC amide derivative involves converting carboxylic acid to an alkyl ester, and it has been synthesised successfully. First, the carboxylic acid function is converted to an ester via Fisher esterification, which requires acidic conditions. Even though the reaction is normally achieved in strong acids (e.g., sulphuric acid), esters have been produced in autocatalytic conditions. Esters are commonly produced by suspending H-CMC in an alcohol reagent combination to alter the equilibrium of the reaction and prevent intermolecular interactions between CMC chains.29–31 A new nanocomposite material has also been fabricated using a CMC amide derivative (A-PH/CMC) in the presence of MWCNTs. The fabricated material was additionally investigated against the adsorption and removal performance of crystal violet and brilliant green dyes from aqueous solutions. Optimisation procedures have been studied in detail.
000 commercially available colours.15 Moreover, various organic contaminants (e.g., dyes, medicines, pesticides) are increasing in the water due to increased industry, urbanisation and unrestricted human activities. These substances are mutagenic and cause allergic dermatitis, skin burns and serious eye damage.16,17 These organic pollutants can affect human and animal health due to their carcinogenicity and poor biodegradability in nature. Some of them are persistent organic pollutants, resistant to environmental deterioration, and continue to enter the ecosystem.18 Dye levels in wastewater, for instance, are significantly increasing due to extensive clothing usage and everyday life items. This is one of the greatest problems worldwide.19,20 Polysaccharides, a broad class of carbohydrate polymers derived from natural sources, have been distinguished in wastewater treatment applications. This is because of their exceptional properties, including adsorbent performance, renewability, biodegradability, biocompatibility and ease of modification. Nonetheless, polysaccharides have intrinsic drawbacks. For instance, most polysaccharides have low activity and are unsuitable for direct use as adsorbents due to their difficulties in regeneration and reuse. The mechanical characteristics of polysaccharide matrices are often poor and necessitate additional matrices.21 Scientists are committed to creating enhanced, multifunctional polysaccharide-based adsorbents that can adapt to harsh environments and have more desired features. Adjusting the physicochemical parameters of polysaccharides may often improve the efficacy of polysaccharide-based adsorbents for wastewater treatment. For instance, polysaccharide-based adsorbents created by cross-linking reactions are the most commonly used method. Carboxymethyl cellulose (CMC) is an anionic cellulose ether with greater water solubility than cellulose. Due to its hydrophilicity, biodegradability and biocompatibility, CMC is often employed in food packaging, sewage treatment and medicine administration.22–24 Furthermore, CMC has a carboxyl group (COO) on its side chain, resulting in pH sensitivity. Common modification techniques concentrate on the hydroxyl and carboxyl groups on the CMC molecular chain as reactive sites. Furthermore, using the negatively charged properties of the CMC molecular chain enables its production. It has higher activity through its association with materials with high adsorption properties, and is simultaneously biocompatible, biodegradable and highly adsorbable.25–28 In this study, the CMC amide derivative involves converting carboxylic acid to an alkyl ester, and it has been synthesised successfully. First, the carboxylic acid function is converted to an ester via Fisher esterification, which requires acidic conditions. Even though the reaction is normally achieved in strong acids (e.g., sulphuric acid), esters have been produced in autocatalytic conditions. Esters are commonly produced by suspending H-CMC in an alcohol reagent combination to alter the equilibrium of the reaction and prevent intermolecular interactions between CMC chains.29–31 A new nanocomposite material has also been fabricated using a CMC amide derivative (A-PH/CMC) in the presence of MWCNTs. The fabricated material was additionally investigated against the adsorption and removal performance of crystal violet and brilliant green dyes from aqueous solutions. Optimisation procedures have been studied in detail.
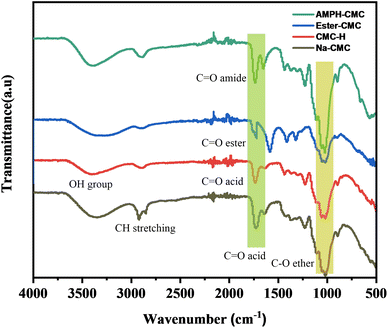
![[double bond, length as m-dash]](https://www.rsc.org/images/entities/char_e001.gif) O stretching vibration of the generated carboxylic acid groups, indicating that acidification was successful. Adsorbed water molecules might have been responsible for the 1630 cm−1 shoulder.36 After the esterification reaction between methanol and CMC, in which the carboxylic group and methanol were bonded after removing water molecules, the ester-CMC compound was produced. A new curve at 1310 cm−1 representing the ester group was observed.37,38 A-PH-CMC/MWCNTs cause the aromatic ring of A-PH-CMC to have C
O stretching vibration of the generated carboxylic acid groups, indicating that acidification was successful. Adsorbed water molecules might have been responsible for the 1630 cm−1 shoulder.36 After the esterification reaction between methanol and CMC, in which the carboxylic group and methanol were bonded after removing water molecules, the ester-CMC compound was produced. A new curve at 1310 cm−1 representing the ester group was observed.37,38 A-PH-CMC/MWCNTs cause the aromatic ring of A-PH-CMC to have C![[double bond, length as m-dash]](https://www.rsc.org/images/entities/char_e001.gif) C stretching vibrations between 1440 and 1503 cm−1, and the covalent coupling with the amine was proven by the appearance of two additional intense bands at about 1662 and 1551 cm−1 attributable to the amide. Moreover, in the A-PH-CMC/MWCNT nanocomposites, absorptions at 2950 cm−1 and 2850 cm−1 were related to C–H stretch modes. At the same time, the peak observed at 1640 cm−1 corresponded to the C–C stretch of the MWCNTs, and the peak at 1460 cm−1 was due to the C–H bending mode of the alkyl chain39–41.
C stretching vibrations between 1440 and 1503 cm−1, and the covalent coupling with the amine was proven by the appearance of two additional intense bands at about 1662 and 1551 cm−1 attributable to the amide. Moreover, in the A-PH-CMC/MWCNT nanocomposites, absorptions at 2950 cm−1 and 2850 cm−1 were related to C–H stretch modes. At the same time, the peak observed at 1640 cm−1 corresponded to the C–C stretch of the MWCNTs, and the peak at 1460 cm−1 was due to the C–H bending mode of the alkyl chain39–41.


![[thin space (1/6-em)]](https://www.rsc.org/images/entities/char_2009.gif) C/Co vs. time for the sorption of BG and CV dyes onto A-PH-CMC/MWCNT nanocomposites were used to obtain the values of t1/2. According to earlier reports, the value of t(1/2) was determined to be 1.5 ± 0.04 min for BG and 1.6 ± 0.05 min for CV dyes.46 Therefore, the overall transport rate is controlled by whichever of the film and intraparticle diffusion processes is faster in the case of dye species sorption onto the A-PH-CMC/MWCNT nanocomposite sorbent. The Weber–Morris model was applied to the dye species absorbed by the A-PH-CMC/MWCNT sorbent:47
C/Co vs. time for the sorption of BG and CV dyes onto A-PH-CMC/MWCNT nanocomposites were used to obtain the values of t1/2. According to earlier reports, the value of t(1/2) was determined to be 1.5 ± 0.04 min for BG and 1.6 ± 0.05 min for CV dyes.46 Therefore, the overall transport rate is controlled by whichever of the film and intraparticle diffusion processes is faster in the case of dye species sorption onto the A-PH-CMC/MWCNT nanocomposite sorbent. The Weber–Morris model was applied to the dye species absorbed by the A-PH-CMC/MWCNT sorbent:47![[thin space (1/6-em)]](https://www.rsc.org/images/entities/char_2009.gif) qt = ln
qt = ln![[thin space (1/6-em)]](https://www.rsc.org/images/entities/char_2009.gif) a + b ln
a + b ln![[thin space (1/6-em)]](https://www.rsc.org/images/entities/char_2009.gif) t
t

![[thin space (1/6-em)]](https://www.rsc.org/images/entities/char_2009.gif) qe − K Lagert/2.303
qe − K Lagert/2.303


![[thin space (1/6-em)]](https://www.rsc.org/images/entities/char_2009.gif) ln(αβ) + β
ln(αβ) + β![[thin space (1/6-em)]](https://www.rsc.org/images/entities/char_2009.gif) ln
ln![[thin space (1/6-em)]](https://www.rsc.org/images/entities/char_2009.gif) t
t


![[thin space (1/6-em)]](https://www.rsc.org/images/entities/char_2009.gif) ln
ln![[thin space (1/6-em)]](https://www.rsc.org/images/entities/char_2009.gif) Kc
Kc

![[thin space (1/6-em)]](https://www.rsc.org/images/entities/char_2009.gif) KC vs. 1000/T (Fig. 15) across the temperature range (283–328 K). The retention process of BG and CV dyes onto the utilised sorbents is endothermic, as shown by the fact that the equilibrium constant rises with increasing temperature. The numerical values of ΔH, ΔS and ΔG for dyes species (BG and CV) retention calculated from the slope and intercept of the linear plot of ln
KC vs. 1000/T (Fig. 15) across the temperature range (283–328 K). The retention process of BG and CV dyes onto the utilised sorbents is endothermic, as shown by the fact that the equilibrium constant rises with increasing temperature. The numerical values of ΔH, ΔS and ΔG for dyes species (BG and CV) retention calculated from the slope and intercept of the linear plot of ln![[thin space (1/6-em)]](https://www.rsc.org/images/entities/char_2009.gif) KC versus 1000/T (Fig. 15) were 14.7 ± 0.2 kJ mol−1, 59.5 ± 0.4 J mol−1 K−1 and −3.0 ± 0.1 kJ mol−1 (at 298 K), respectively, for the BG dye. They were 25.2 ± 0.3 kJ mol−1, 97.6 ± 0.5 J mol−1 K−1 and −3.9 ± 0.2 kJ mol−1 (at 298 K), respectively, for the BG dye.
KC versus 1000/T (Fig. 15) were 14.7 ± 0.2 kJ mol−1, 59.5 ± 0.4 J mol−1 K−1 and −3.0 ± 0.1 kJ mol−1 (at 298 K), respectively, for the BG dye. They were 25.2 ± 0.3 kJ mol−1, 97.6 ± 0.5 J mol−1 K−1 and −3.9 ± 0.2 kJ mol−1 (at 298 K), respectively, for the BG dye.

![[thin space (1/6-em)]](https://www.rsc.org/images/entities/char_2009.gif)

