 Open Access Article
On the specific heat capacity of HITEC-salt nanocomposites for concentrated solar power applications
Dipti Ranjan Parida and
Saptarshi Basu
 *
*
Department of Mechanical Engineering, Indian Institute of Science, Bangalore 560012, India. E-mail: sbasu@iisc.ac.in
First published on 14th February 2023
Abstract
High specific heat capacity or CP of molten salt is crucial for concentrated solar power plants as it will enhance the energy density of thermal energy storage. It can be achieved by doping nanoparticles into molten salts. However, reported results show inconsistency in CP enhancement (positive and negative). Since the results are based on Differential Scanning Calorimeter (DSC) measurements of small batches (<10 mg), the average CP obtained from these results may not represent the bulk-CP of the nanocomposite, which is an important parameter from an application viewpoint. Moreover, the methods of salt-nanoparticle composite production lack industrial scalability. In this work, we examined a potentially scalable method based on mechanical shear mixing. The molten-salt of choice was HITEC due to its lower melting point, while inexpensive alumina and silica nanoparticles were used as dopants. To compare and contrast variability in CP enhancement, the sample selection was made by random sampling; DSC measurement was performed on small-sized batches (<10 mg), and the T-history method was applied on large-sized batches (20 g). While DSC tests indicated a mean decrease in CP for alumina (−43%) and an increase in CP for silica nanocomposite (+15%), T-history tests indicated a mean decrement in the bulk-CP for both alumina (−49%) and silica nanocomposites (−3%). This anomalous behavior in CP values was further compared using a nonparametric statistical test, the Mann–Whitney U test, which revealed that the CP of small-sized batches is statistically different from that of large-sized batches. Given their industrial scale of usage, the CP of the nanocomposite must be measured using both DSC and T-history methods to ascertain the effect of nanoparticles.
1. Introduction
Limited fossil fuel reserves will pose a significant challenge to future electricity demand. This can be evaded by improving alternative renewable electric generation technologies.1 In this regard, concentrated solar power technology plays an essential role as solar energy is abundant. However, solar energy is intermittent owing to day–night, seasonal, and weather fluctuations, necessitating the installation of thermal energy storage in concentrated solar plants (CSP). This storage generally utilizes molten salt as the storage medium because it is stable at higher temperatures (∼600 °C).2 During the peak available hours, excess solar energy is collected in the storage (in the form of the sensible heat of molten salts) and consumed during off-hours. Nevertheless, both the material and operational costs of the molten salts are very high.3 In order to deal with this problem, attempts are being made to enhance the energy density of the storage by increasing the specific heat capacity of molten salts.For the past decade, researchers have focused on improving the CP of molten salt by doping various nanoparticles (NP), usually <3 wt%.4,5 creating a nanocomposite or nanofluid (in molten state).6 This paper uses terms nanofluid (NF) and nanocomposite interchangeably. In 2010, Shin et al.7 studied the effect of silica nanoparticles (1–20 nm) on the eutectic salt of lithium carbonate and potassium carbonate (62![[thin space (1/6-em)]](https://www.rsc.org/images/entities/char_2009.gif) :
:![[thin space (1/6-em)]](https://www.rsc.org/images/entities/char_2009.gif) 38 by molar ratio) for a concentration of 1.5 wt% using a two-step preparation method. They reported 74% and 101% CP enhancement for two selective test samples coarse and fine powders, respectively, taken from a 200 mg prepared sample. The same authors also reported an enhancement of 124% CP for fine powder and negligible CP enhancement for coarse powder8 despite having the same base salt, nanoparticles, concentration, and preparation method as their previous work. For alumina nanoparticles (∼10 nm), Shin and Banerjee9 reported a 32% CP enhancement at a heating rate of 20 °C min−1 in the DSC test. In contrast, Rizvi et al.10 found a 2.53% CP enhancement at a heating rate of 10 °C min−1 for alumina nanoparticles having an average size of 10.8 nm. In addition, they reported that the specific heat capacity enhancement increases with decreasing heating rate with a maximum of 23.4% for a heating rate of 2 °C min−1. Moreover, an anomalous increase in CP of the nanofluid is also reported in ref. 11 which strongly depended on the chemical composition of the base carbonate salt mixtures (lithium carbonate and potassium carbonate).
38 by molar ratio) for a concentration of 1.5 wt% using a two-step preparation method. They reported 74% and 101% CP enhancement for two selective test samples coarse and fine powders, respectively, taken from a 200 mg prepared sample. The same authors also reported an enhancement of 124% CP for fine powder and negligible CP enhancement for coarse powder8 despite having the same base salt, nanoparticles, concentration, and preparation method as their previous work. For alumina nanoparticles (∼10 nm), Shin and Banerjee9 reported a 32% CP enhancement at a heating rate of 20 °C min−1 in the DSC test. In contrast, Rizvi et al.10 found a 2.53% CP enhancement at a heating rate of 10 °C min−1 for alumina nanoparticles having an average size of 10.8 nm. In addition, they reported that the specific heat capacity enhancement increases with decreasing heating rate with a maximum of 23.4% for a heating rate of 2 °C min−1. Moreover, an anomalous increase in CP of the nanofluid is also reported in ref. 11 which strongly depended on the chemical composition of the base carbonate salt mixtures (lithium carbonate and potassium carbonate).
For solar salt (eutectic mixture of 60% NaNO3 and 40% KNO3), 1 wt% SiO2 nanoparticle (5 nm) resulted 25% enhancement in CP12 while in ref. 13 7 nm SiO2 nanoparticle show −19.3%, 0.8%, and −1.4% CP enhancement for 0.5, 1, and 1.5 wt% concentration, respectively. Moreover, the researchers in ref. 13 reported both increment and decrement in CP for Al2O3, TiO2 nanoparticles. A reduction in CP for 13 nm Al2O3 is also reported in ref. 14. With mechanical dispersion of CuO and TiO2 nanoparticles using ball milling,15 reported temperature-dependent CP curves. One interesting observation in their result was that for 1.5 concentration of CuO nanoparticles the CP curve crosses the CP curve of the base salt. For mixed nanoparticles based nanofluid (silica 82–86%, alumina 14–18%, 2–200 nm),16 a minimum −19% and a maximum of 17.9% CP enhancement is reported. The same authors17 also reported a 6.1%, −7.8%, and −3.4% CP enhancement for the salt KNO3 using 1 wt% SiO2, Al2O3, and SiO2–Al2O3 NPs, respectively. Similar observations are also reported in ref. 18 and 19 for solar salt with alumina and silica nanoparticles using water-dispersion, and melt-stirring preparation methods, respectively. Moreover, in some recent investigations, we could see the nonlinear temperature dependent CP for NFs.20,21 To illustrate the inconsistent CP enhancement of NFs clearly, some reported literature results are summarized in Table 1.
| Molten salt | Reference | NPs | Size (nm) | Concentration (wt%) | Temperature (°C) | CP enhanced% |
|---|---|---|---|---|---|---|
Solar salt, NaNO3–KNO3 (60![[thin space (1/6-em)]](https://www.rsc.org/images/entities/char_2009.gif) : :![[thin space (1/6-em)]](https://www.rsc.org/images/entities/char_2009.gif) 40) 40) |
Y. Hu et al. (2017)25 | Al2O3 | 20 | 0.5 | 260–400 | 1.9 |
| 1 | 5.8 | |||||
| 1.5 | 7 | |||||
| 2 | 8.3 | |||||
| M. Chieruzzi et al. (2017)19 | SiO2 | 7 | 1 | 255–290 | 2.5 | |
| −28.1 | ||||||
| 2.6 | ||||||
| −2 | ||||||
| Al2O3 | 13 | 1 | 2.8 | |||
| −7.8 | ||||||
| 1.8 | ||||||
| −0.9 | ||||||
| B. Dudda et al. (2013)26 | SiO2 | 5 | 1 | 250–450 | 10 | |
| 10 | 13 | |||||
| 30 | 21 | |||||
| 60 | 28 | |||||
| M. Schuller et al. (2015)27 | Al2O3 | 40 | 0.3 | 350 | 20.41 | |
| 0.53 | 24.49 | |||||
| 0.78 | 30.61 | |||||
| 0.96 | 23.81 | |||||
| 1.19 | 14.29 | |||||
| Chieruzzi et al. (2013)18 | Al2O3 | 13 | 0.5 | 250–300 | −7.60 | |
| 1 | 5.90 | |||||
| 1.5 | −3.50 | |||||
| SiO2 | 7 | 0.5 | −19.30 | |||
| 1 | 0.80 | |||||
| 1.5 | −1.40 | |||||
| TiO2 | 20 | 0.5 | −15.60 | |||
| 1 | −6.30 | |||||
| 1.5 | −11.80 | |||||
| Andreu-Cabedo et al. (2014)28 | SiO2 | 12 | 0.5 | 250–420 | 3.41 | |
| 1 | 25.03 | |||||
| 1.5 | 2.00 | |||||
| 2 | 3.69 | |||||
| M. Lasfargues et al. (2015)29 | CuO | 29 | 0.1 | 440 | 10.48 | |
| 0.5 | 9.18 | |||||
| 1 | 8.49 | |||||
| 1.5 | 2.19 | |||||
| TiO2 | 34 | 0.1 | 1.57 | |||
| 0.5 | 4.95 | |||||
| 1 | 4.72 | |||||
| 1.5 | 4.85 |
Though extensive research has been conducted on the CP of nanofluids for Li–K carbonate salt mixture and solar salt, there has been a limited investigation for HITEC salt (eutectic mixture of KnO3–NaNO2–NaNO3). However, HITEC salt shows better thermophysical properties than other salts and is one of the prime candidates for CSP as heat storage media.22 In 2014, M. X. Ho et al.23 observed both −1.7% and 7.8% enhanced CP for 0.5 wt% concentration, and −2.8% and 6.5% enhanced CP for 1 wt% concentration from HITEC based NF with alumina nanoparticles using a melt-stirring preparation method. In another investigation,24 the authors reported a 30% enhanced heat capacity for the HITEC salt using Sn/Six core–shell nanoparticles at the melting point of the NPs. However, the CP curves of all HITEC-Sn/Six NFs (as shown in ref. 24) are below the base salt's CP curve (except at the melting point of the NPs) indicating a decrease in heat capacity.
To summarize previous literature, the salt nanocomposite can be synthesized by either wet-dispersion (2-step method) or dry-dispersion (1-step method). The wet-dispersion process can be classified as: (i) water dispersion method (dissolution of salt in water → ultrasonication (100–200 minutes) → drying), (ii) melt-stirring method (nanoparticle addition to molten salt → mechanical stirring → drying) whereas the dry-dispersion process includes (i) ball mill mixing, (ii) mechanical shear mixing. Although nearly all research utilized the 2-step method for salt-nanocomposite preparation, it is very time-consuming, laborious, and unsuitable for industrial production. In contrast, the effect of the 1-step preparation method is rarely studied.30,31 In almost all literature, the prepared nanocomposite sample size was 200 mg, out of which test samples (∼10 mg) are taken for CP measurements using DSC. Therefore, the results that were obtained from the test samples are limited by sampling size ratio  i.e. random sampling is limited, and thus the data variability obtained from these results may not represent for the CP of bulk nanocomposite. As mentioned in Zhang Yingping et al.,32 the thermophysical properties of these samples are not always similar to that of bulk materials. So, it is not confirmed whether such specific heat enhancement effect will be present in the practical systems.
Moreover, we see both increment and decrement in CP for molten salt nanocomposites consisting of same base salt, nanoparticle, concentration, and same measurement procedure, as in ref. 19, and varying CP for selective nanocomposite samples, as in ref. 8 for coarse and fine powder samples. Since we know that the CP enhancement depends strongly on the concentration of nanoparticle33 in the base salt, it is not certain whether the test samples collected from the same prepared samples consist of the same concentration (i.e., the drying process may have altered the NP concentration with respect to varying location due to convection current) and hence the irregular CP enhancements. So, from the perspective of engineering application, a comparative study for the specific heat capacity of molten-salt nanocomposites is needed to capture possible CP variations by random sampling, and to inquire about its bulk-specific heat capacity with respect to DSC results.
Hence, in this study, HITEC salt nanocomposite is synthesized by the dry-dispersion method using high shear mechanical powder mixture for two different nanoparticles, silica (SiO2) and alumina (Al2O3). The concentration of the nanofluid samples is kept at 1 wt%. Differential scanning calorimetry and T-history methods are used for specific heat measurement of small and large nanofluid samples, respectively. Finally, the resulting nanocomposites are examined for possible microstructures.
2. Experiments
2.1 Materials
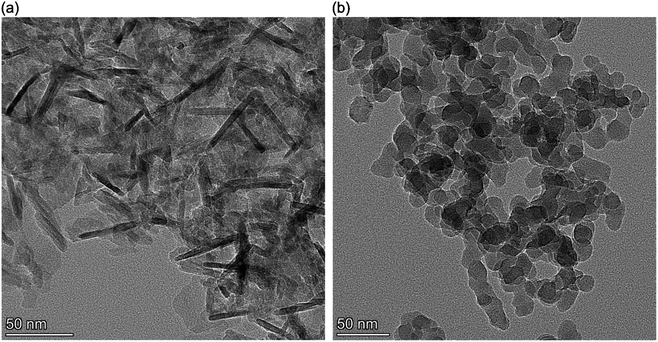
HITEC salt (53% KnO3 + 40% NaNO2 + 7% NaNO3) is used as the base molten salt because its melting point is relatively lower (142 °C), and it is stable at high temperature and less corrosive. The powdered salt was procured from Indrajit Industries (Bangalore, Karnataka, India). Regarding purity, the acceptable level of impurities (as provided by the manufacturer) were 0.025% sulfur and 0.1% chloride. The thermophysical properties of pure HITEC salt, as quoted by the manufacturer, are given in Table 2.Two nanoparticles chosen for this study were silica (SiO2) and alumina (Al2O3) (Sigma-Aldrich Product no: 637238 and 544833). The corresponding nanoparticle size for silica and alumina are 10–20 nm and <50 nm, respectively. The TEM image of Al2O3 nanoparticle indicates that the alumina nanoparticles are of rod type (same as ref. 34). Whereas the TEM image of SiO2 shows that the shape of the silica nanoparticles is nearly spheroid (see Fig. 1b). The physical properties corresponding to the nanoparticles are shown in Table 3.
2.2 Nanocomposite synthesis
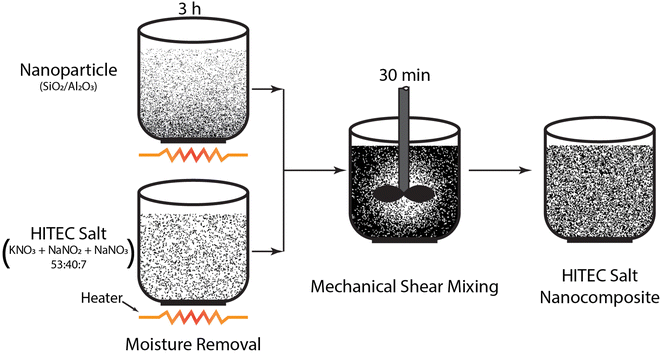
Fig. 2 shows the schematic of the 1-step dry dispersion method for nanocomposite preparation. For this experiment, the nanoparticle (SiO2/Al2O3) concentration in the base salt is chosen to be 1 wt%. First, both HITEC salt and nanoparticles are desiccated at 120 °C for 3 hours. Then measured in a microbalance (A&D GR-202, ±0.01 mg). The salt-nanopowder composite is prepared in an in-house-developed laboratory powder mixture (high shear mixer: 4-blade design, 550 watts, and 18![[thin space (1/6-em)]](https://www.rsc.org/images/entities/char_2009.gif) 000 rpm). In total, 150 grams of nanocomposite (salt = 148.5 g, nanoparticle = 1.5 g) is prepared for each nanoparticle powder so that three samples of 20 grams each can be drawn for the T-history experiment. Since the sample size requirement for the DSC is in milligrams, 150 grams of nanocomposite is sufficient for this random sampling, which is intended to capture any variability in the nanocomposite if present.
000 rpm). In total, 150 grams of nanocomposite (salt = 148.5 g, nanoparticle = 1.5 g) is prepared for each nanoparticle powder so that three samples of 20 grams each can be drawn for the T-history experiment. Since the sample size requirement for the DSC is in milligrams, 150 grams of nanocomposite is sufficient for this random sampling, which is intended to capture any variability in the nanocomposite if present.
2.3 Specific heat capacity measurement
The specific heat capacity of all samples is determined by the direct method;37
 | (1) |
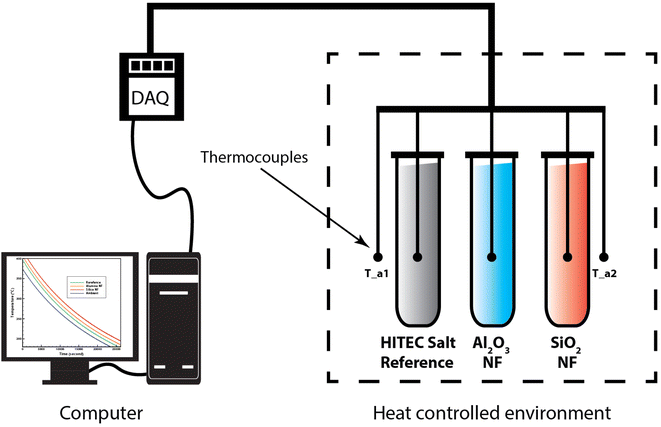
Since the T-history experiment involves dynamic temperature measurement, a priori of the thermal analysis, the following points are checked; (1) cross-sectional thermal gradient in the surrounding atmosphere, (2) time constant of the thermocouple. In the present experiment, a maximum gradient of ±0.285 °C cm−1 along the length and ±0.133 °C cm−1 along the width of the chamber are noticed. Accordingly, the samples are kept side by side along the width. Moreover, a time constant of ∼200 ms is quoted by the supplier for the K-type thermocouple (uncoated, diameter = 1.5 mm). As it is general practice to keep a time gap for sampling higher than that of time constant, we have recorded the thermocouple readings at 1.1 second intervals.
For the thermal analysis, firstly, the temperature of the surrounding air is ramped from room temperature to 170 °C and kept for 0.5 hours to ensure the complete melting of HITEC salt. Then the chamber temperature is again improved to 450 °C with a rate of 10 °C min−1. A dwell time of 2 hours is given so that all samples and the ambient come into equilibrium. Finally, the heaters are switched off, and the cooling temperature history (cooling curve) is recorded. This experiment is repeated three times for three different batches of nanocomposite (alumina NF and silica NF), and their results between 200–400 °C are reported accordingly.
The primary assumption in using the T-history method is to satisfy the lumped capacitance of sample materials, i.e., the Biot number,  ,32,39 where Bi is the Biot number, h is the heat transfer coefficient of the surrounding air, R is the outer radius of the sample holder, and k is the thermal conductivity of the samples. For a laminar natural convection, h usually lies below
  .40,41 So, the Biot number for the pure HITEC salt (∼0.021) satisfies the criterion. Moreover, the thermal conductivity of the HITEC salt increases when doped with nanoparticles.42 Hence the Biot number of nanofluids will be smaller than that of pure salt and will be content with the lumped capacitance assumption.
At any instant of time, the amount of heat released by the samples to the surrounding air can be written as;
 | (2) |
 denotes the slope of the cooling curve (°C s−1), h denotes the convective heat transfer coefficient of surrounding air
  , and AC denotes the characteristic area for convection. In this experiment, the heat conduction from the bottom surface of the sample holder is avoided by keeping an insulation layer (50 mm glass wool insulation) between the tube and the heating chamber during the cooling process. Thus AC represents the cylindrical surface of the tubes. Moreover, T and Tair denote the instantaneous temperatures of the sample and the surrounding air (°C), respectively. Since both m, and AC are constant for all samples, assuming negligible variation in h, the ratio of specific heat capacity at any fixed temperature can be found from :43
 | (3) |
3. Results and discussion
The melting point and the specific heat capacity (CP) of the procured HITEC salt are verified using differential scanning calorimetry. The DSC curve of the pure salt is shown in Fig. 4. It is seen that the melting peak of HITEC salt starts at around 142 °C and ends at 162 °C. Moreover, the specific heat capacity at the liquid phase is weakly dependent on the temperature having an average value of 1.42347 J g−1 °C−1. It is important to note that the upper bound of the CP for HITEC salt is reported to be 1.56 J g−1 °C−1 in previous literature.46,47 However, average CP of the present study is found to be in good agreement with the literature ref. 48 (CP = 1.424 J g−1 °C−1), ref. 23 (CP = 1.37–1.48 J g−1 °C−1), ref. 49 (CP = 1.439 J g−1 °C−1), and ref. 50 (CP = 1.40 J g−1 °C−1) as well as with the value cited by the manufacturer (0.34 kcal kg−1 °C−1).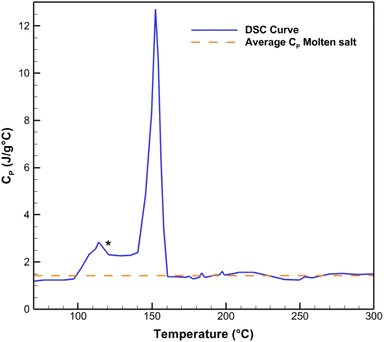 | ||
| Fig. 4 CP curve of HITEC salt obtained from DSC measurement. The melting point is found to be 142 °C (beginning of melting peak). The average specific heat capacity of 1.42347 J g−1 °C−1 is obtained from the curve in the liquid phase. The minor peak (highlighted as *) is caused by solid transformation, as reported in previous literature.51,52 | ||
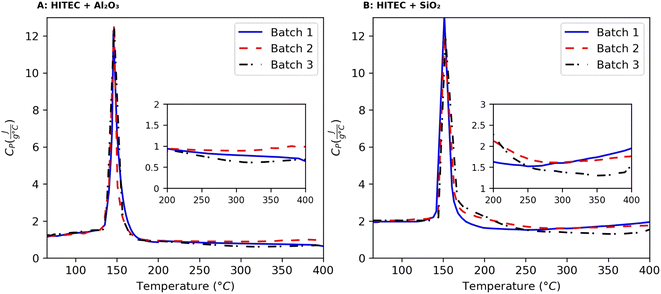
The results obtained from the DSC measurements (CP vs. T curves) of alumina and silica nanofluids are shown in Fig. 5, which reveals two interesting features. Firstly, the CP of both nanofluids are temperature dependent. Secondly, there is a decrease in CP with respect to the base molten salt (CP = 1.42347 J g−1 °C−1) for Al2O3 NF for all three batches (#1 to #3), and an increase in CP for SiO2 NF (batch #1 and #2). However, there is a decrease in CP for the batch #3 of SiO2 NF. Regarding the mean specific heat capacity of nanofluids, a sampling interval of 10 °C gives 0.810684 ± 0.1138 for alumina NF, and 1.634839 ± 0.204117 for silica NF. In consequence, the enhancement in CP of HITEC salt owing to the doping of 1% nanoparticle can be presumed to be −43.0487%, and 14.84886% for alumina and silica nanofluids, respectively. In addition, the theoretical CP of the NFs can be calculated from the mixing theory:
 | (4) |
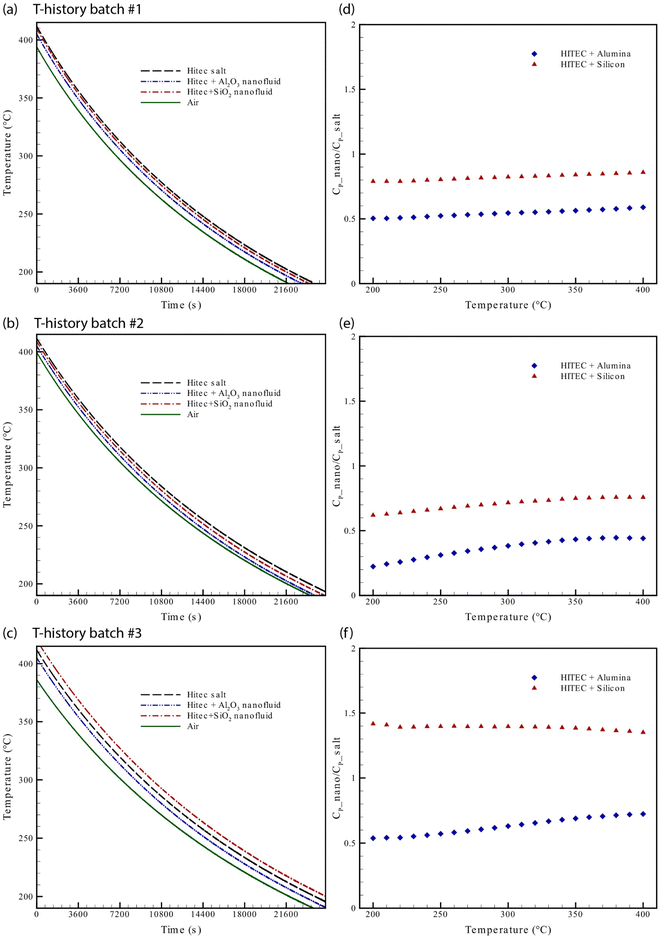
In the present work, therefore, the T-history method is used to investigate whether such microscopic phenomena have any profound effect on the bulk-specific heat capacity of the nanofluids. The results obtained from this temperature history experiment are shown in Fig. 6a–c, where the test samples are cooled inside the static-air chamber, as described in Section 2.3.2. The primary observation of these cooling curves reveals that both Al2O3 and SiO2 nanofluids cool faster than base HITEC salt in test #1, and #2; however, the cooling curve in the SiO2 NF for the test #3 is slower compared to the base salt indicating an increase in specific heat capacity. On reverting to the previous discussion of DSC results, a similar variation is observed in SiO2 NF, where sample #3 diverges from samples #1 and #2. These results are not surprising as both increment and decrement of CP of nanofluids are already reported in earlier studies18,19 using DSC. The critical point, however, to note here is that we still see such irregular CP behavior in the bulk samples.
Regarding quantitative estimation, the CP ratios of the nanocomposites  are calculated from the cooling curves using eqn (3) at 10 °C intervals and are shown in Fig. 6d–f. On average, the bulk-specific heat capacity of the nanofluids is 0.729959 ± 0.176598 for alumina NF and 1.383344 ± 0.426798 for silica NF. In consequence, a decrement in CP of HITEC salt owing to the doping of 1% nanoparticle can be found to be −48.7198% and −2.81887% for alumina and silica nanofluids, respectively. While average CP values of the alumina NFs as obtained from both DSC and T-history methods are comparable, the outcomes for silica NFs are quite different. The minimum and maximum enhancement in CP of silica-NF are −9% and 60% from DSC, and −38% and 42% from T-history tests. Thus, it indicates that the result obtained from small samples using DSC may not represent the bulk behavior/CP of the NFs. In addition, Fig. 6d–f shows that the CP ratios of all nanofluid samples are nearly linear with respect to temperature and are approaching a unit value (i.e.,
  ; specific heat capacity of the base molten salt). This observation, however, is consistent with Ho an Pan,23 in which the CP curves of nanocomposites at different concentrations approaches the base salt with increase in temperature. So, it signifies that the microscopic phenomena which are contributing to an increment/decrement of CP of the nanofluid are quasi-stable. Rapid agglomeration and sedimentation of nanoparticles may be responsible for this instability owing to the decrease in density of the base molten salt (specific gravity: from 1.94 at 200 °C to 1.81 at 400 °C) with rising temperature.
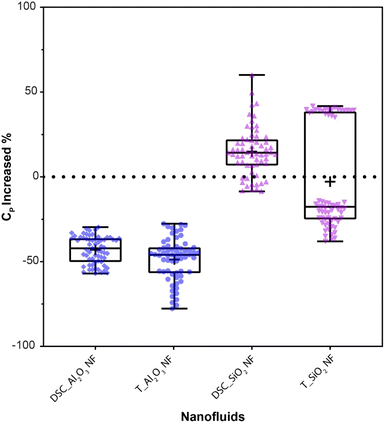
For a concise comparison between DSC and T-history experimental results, the CP increment/decrement percentage of both nanocomposites are shown in a Box-and-Whisker plot with data overlay (Fig. 7). Upon closer inspection, it reveals that the results of both tests are not completely different but rather show different central measures and variability in one test compared to the other as:
• For Al2O3 nanoparticle-based composite, both tests show a decrement in CP.
• For SiO2 nanoparticle-based composite, both tests show increment and decrement in CP.
• The interquartile ranges of the results obtained in both tests overlap for Al2O3 and SiO2 nanocomposites.
However, there are differences in their statistical moments (mean and median). From these statistical moments, we deduce the central tendency/measure of the samples. For this study, the central measures of the tests are not comparable as:
• Although the interquartile ranges overlap, the medians of the T-history results are lower than that of the DSC results for both nanofluids.
• Both T-history mean and median values of SiO2 nanofluid are of opposite sign to that of the DSC experiment.
• A wider interquartile range for SiO2 NF results obtained from the T-hisory test indicates a larger variability of bulk CP.
This indicates that the resultant effect on CP of salt nanocomposite for larger weight samples (bulk-CP) can be different than it seems from the smaller samples. There are two potential reasons for such behavior. Firstly, the agglomerative scale of nanoparticles can vary in large-size samples, and there is a possibility that we may not be able to capture these in small-size samples. Secondly, there is a possibility of a difference in the nanoparticle distribution in both samples, and we only capture a subset of the overall distribution in the DSC test.
Considering all the above analysis, we now ask an interesting question: are the results obtained from both DSC and T-history experiments from the same population? In an attempt to answer this question, we have performed a nonparametric Mann–Whitney U test.53,54 It is a well-known statistical test for comparing two sample groups where the null hypothesis is H0: both sample groups are the subsets of the same population. In this test, the U-test static is the minimum Ui, which is obtained by
 | (5) |
 is the sum of the ranks from sampe of interest. The characteristic z-score (z*) is also calculated by
 | (6) |
 , and SU are the mean and standard deviation obtained by
  , and
, and  , respectively. In order to test the null hypothesis, this z* is then compared to a critical threshold obtained from a standard normal distribution for a fixed confidence level. For the details of this method, the readers may refer to the book.55 The z* obtained for alumina and silica nanofluids are −2.505, and −3.656, respectively. Since the critical threshold of z-score for 95% confidence is ±1.96, z* lies outside of this interval, and we reject the null (H0) in both tests with the inference that the results obtained from DSC and T-history experiments aren't from the same population. The point of this discussion is that the bulk-specific heat capacity values are statistically different than that of the specific heat capacity values obtained from the DSC test (certainly for this 1-step dry dispersion preparation method).
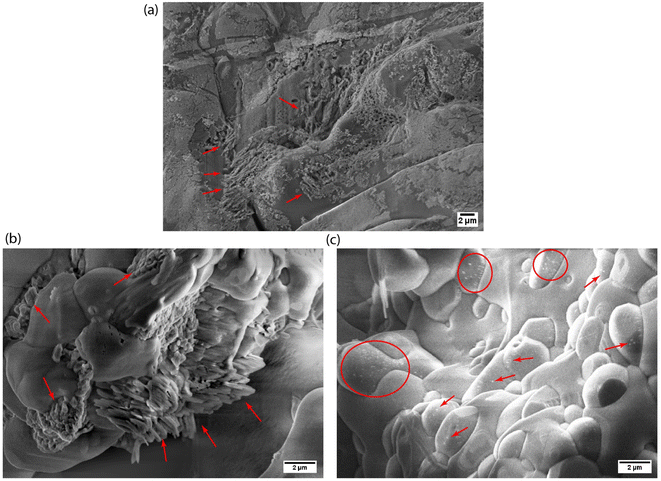
From a microstructure point of view, we have characterized the nanofluid samples obtained from the T-history experiment using scanning electron microscopy (SEM). The representative microstructures of both Al2O3 and SiO2 nanocomposites are shown in Fig. 8. Based on the observation, the obtained microstructures can be classified into two types: (i) aggregated network structure, as seen in Fig. 8a and b, and (ii) isolated particle structure, as seen in Fig. 8c. Similar network-like microstructures were observed earlier in ref. 56 and 57 and an isolated-particle structure was reported in ref. 23. We presume that the aggregated network structures are semisolid layers and are responsible for a decrease in CP whereas the isolated particle structures favor CP enhancement. Moreover, the percentage of these microstructures may vary with in a nanocomposite batch owing to the variations in nanoparticle dispersion which further depend on the preparation method and agglomeration of nanoparticles. Furthermore, we believe the rod type Al2O3 nanoparticles are favorable to form network structures, and hence we see a decreased CP in DSC and T-history experiments. However, spheroid shape of SiO2 nanoparticles forms both type of structures and depending on their percentage we see either an enhancement or diminution of CP. In the view of above analysis, it can be concluded that there is an agglomerative-scale dependency on the bulk CP of molten salt nanocomposites.
4. Conclusion
The current article reports on the specific heat capacity (CP) of HITEC salt nanocomposites prepared by 1-step dry dispersion method using mechanical shear mixing. In which alumina and silica nanoparticles with distinct morphological features (Al2O3: rod type, <50 nm; SiO2: spheroid type, 10–20 nm) were doped into the base salt at 1 wt% concentration. The CP measurements were carried out using DSC and T-history test methods for small (≤10 mg), and large (20 g) random samples, respectively, aiming to determine whether or not the specific heat capacity measured in DSC is representative of the bulk specific heat capacity of the nanocomposite. The key findings of the study can be summarized as follows.1. The rod type Al2O3 nanoparticle results in a decrement in CP of the HITEC salt, about −43% from the DSC, and −49% from the T-history experiment.
2. The spheroid type SiO2 nanoparticle results in both increments and decrements in CP for silica nanocomposite as obtained from DSC and T-history tests. The minimum and maximum CP enhancement in silica-NF are found to be −9% and 60% from DSC, and −38% and 42% from T-history tests, respectively. However, the average CP enhancement percentages are of opposite sign (+15% for DSC test and −3% for T-history test), which indicates that the CP result of DSC test is not representative of the bulk CP that obtained from T-history test.
3. More importantly, from the statistical analysis (Mann–Whitney U test with 95% confidence interval), it is inferred that the parent nanocomposite samples/statistical population of the DSC and the T-history test batches are unalike. Since the test batches are taken randomly from the same original sample, it is believed that there is an inhomogeneity in nanoparticle dispersion within the prepared nanocomposite sample; which explains why diverging CP increment/decrement is observed for selective nanocomposite samples within the same prepared sample, even in studies by other groups reporting 2-step preparation method.
4. From microscopic characterization, only aggregated-network microstructure is found for Al2O3 nanocomposite, whereas both network and isolated-particle type microstructures are found in SiO2 nanocomposite. It is believed that the bulk CP of the silica NF in the T-history experiment differs from the DSC test due to a non-uniform distribution of these representative microstructures in the large samples, which depends on the preparation procedure and stability of nanoparticles.
Based on the presented results, there is a possibility that the behavior of CP obtained from DSC may differ from the bulk-specific heat capacity substantially. To conclude whether the prepared nanocomposite has indeed achieved CP enhancement, both DSC and T-history methods must be used in a complementary manner.
Author contributions
Dipti Ranjan Parida: conceptualization, investigation, data curation, formal analysis, writing – original draft. Saptarshi Basu: conceptualization, project administration, supervision, writing – review & editing.Conflicts of interest
There are no conflicts to declare.Nomenclature
Acknowledgements
The present study is supported by the Ministry of human resource development and the Ministry of New and Renewable Energy, Govt. of India, under the IMPRINT initiative (grant number/Project no: 4424).References
- P. A. Owusu and S. Asumadu-Sarkodie, A review of renewable energy sources, sustainability issues and climate change mitigation, Cogent Engineering, 2016, 3(1) DOI:10.1080/23311916.2016.1167990.
- E. González-Roubaud, D. Pérez-Osorio and C. Prieto, Review of commercial thermal energy storage in concentrated solar power plants: steam vs. molten salts, Renewable Sustainable Energy Rev., 2017, 80, 133–148, DOI:10.1016/j.rser.2017.05.084.
- C. S. Turchi, J. Vidal and M. Bauer, Molten salt power towers operating at 600–650 °C: salt selection and cost benefits, Sol. Energy, 2018, 164, 38–46, DOI:10.1016/j.solener.2018.01.063.
- H. E. Kwak, D. Shin and D. Banerjee, Enhanced Sensible Heat Capacity of Molten Salt and Conventional Heat Transfer Fluid Based Nanofluid for Solar Thermal Energy Storage Application, ASME 2010 4th Int. Conf. Energy Sustain. ES, 2010, vol. 2, pp. 735–739, DOI:10.1115/ES2010-90295.
- D. Shin, B. Jo, H. E. Kwak and D. Banerjee, Investigation of High Temperature Nanofluids for Solar Thermal Power Conversion and Storage Applications, 2010, 14th Int. Heat Transf. Conf. IHTC 14, vol. 7, pp. 583–591, 2011, DOI:10.1115/IHTC14-23296.
- S. Choi and J. Eastman, Enhancing thermal conductivity of fluids with nanoparticles, 1995, https://www.osti.gov/biblio/196525.
- D. Shin, D. B.-I. J. of S. C. in, and undefined 2010, Effects of silica nanoparticles on enhancing the specific heat capacity of carbonate salt eutectic (work in progress), http://journals.tdl.org, vol. 2, pp. 25–31, 2010, accessed May 30, 2022, available https://journals.tdl.org/ijscs/index.php/ijscs/article/view/2337.
- D. Shin and D. Banerjee, Enhanced specific heat capacity of nanomaterials synthesized by dispersing silica nanoparticles in eutectic mixtures, J. Heat Transfer, 2013, 135(13), 032801, DOI:10.1115/1.4005163.
- D. Shin and D. Banerjee, Specific heat of nanofluids synthesized by dispersing alumina nanoparticles in alkali salt eutectic, Int. J. Heat Mass Transfer, Jul. 2014, 74, 210–214, DOI:10.1016/j.ijheatmasstransfer.2014.02.066.
- S. M. M. Rizvi, B. El Far, Y. Nayfeh and D. Shin, Investigation of time–temperature dependency of heat capacity enhancement in molten salt nanofluids, RSC Adv., 2020, 10(39), 22972–22982, 10.1039/D0RA03666H.
- H. J. Kim and B. Jo, Anomalous Increase in Specific Heat of Binary Molten Salt-Based Graphite Nanofluids for Thermal Energy Storage, Appl. Sci., 2018, 8, 1305, DOI:10.3390/APP8081305.
- B. Dudda and D. Shin, Investigation of Molten Salt Nanomaterial as Thermal Energy Storage in Concentrated Solar Power, ASME Int. Mech. Eng. Congr. Expo. Proc., 2013, 9, 813–818, DOI:10.1115/IMECE2012-87707.
- M. Chieruzzi, G. F. Cerritelli, A. Miliozzi and J. M. Kenny, Effect of nanoparticles on heat capacity of nanofluids based on molten salts as PCM for thermal energy storage, Nanoscale Res. Lett., 2013, 8(1), 1–9, DOI:10.1186/1556-276X-8-448/FIGURES/6.
- M. C. Lu and C. H. Huang, Specific heat capacity of molten salt-based alumina nanofluid, Nanoscale Res. Lett., 2013, 8(1), 1–7, DOI:10.1186/1556-276X-8-292/FIGURES/5.
- M. Lasfargues, Q. Geng, H. Cao and Y. Ding, Mechanical Dispersion of Nanoparticles and Its Effect on the Specific Heat Capacity of Impure Binary Nitrate Salt Mixtures, Nanomater., 2015, 5(3), 1136–1146, DOI:10.3390/NANO5031136.
- M. Chieruzzi, A. Miliozzi, T. Crescenzi, J. M. Kenny and L. Torre, Synthesis and Characterization of Nanofluids Useful in Concentrated Solar Power Plants Produced by New Mixing Methodologies for Large-Scale Production, J. Heat Transfer, 2018, 140(4) DOI:10.1115/1.4038415/367882.
- M. Chieruzzi, A. Miliozzi, T. Crescenzi, L. Torre and J. M. Kenny, A New Phase Change Material Based on Potassium Nitrate with Silica and Alumina Nanoparticles for Thermal Energy Storage, Nanoscale Res. Lett., 2015, 10(1), 1–10, DOI:10.1186/S11671-015-0984-2/FIGURES/8.
- M. Chieruzzi, G. F. Cerritelli, A. Miliozzi and J. M. Kenny, Effect of nanoparticles on heat capacity of nanofluids based on molten salts as PCM for thermal energy storage, Nanoscale Res. Lett., 2013, 8(1), 1–9, DOI:10.1186/1556-276X-8-448.
- M. Chieruzzi, G. F. Cerritelli, A. Miliozzi, J. M. Kenny and L. Torre, Heat capacity of nanofluids for solar energy storage produced by dispersing oxide nanoparticles in nitrate salt mixture directly at high temperature, Sol. Energy Mater. Sol. Cells, 2017, 167, 60–69, DOI:10.1016/j.solmat.2017.04.011.
- Z. Li, B. Li, X. Du and H. Wu, Experimental investigation on stability of thermal performances of solar salt based nanocomposite, Renewable Energy, 2020, 146, 816–827, DOI:10.1016/J.RENENE.2019.07.009.
- N. Aslfattahi, R. Saidur, N. A. Che Sidik, M. F. Mohd Sabri and M. H. Zahir, Experimental Assessment of a Novel Eutectic Binary Molten Salt-based Hexagonal Boron Nitride Nanocomposite as a Promising PCM with Enhanced Specific Heat Capacity, J. Adv. Res. Fluid Mech. Therm. Sci., 2020, 68(1), 73–85, DOI:10.37934/arfmts.68.1.7385.
- E. González-Roubaud, D. Pérez-Osorio and C. Prieto, Review of commercial thermal energy storage in concentrated solar power plants: steam vs. molten salts, Renewable Sustainable Energy Rev., 2017, 80, 133–148, DOI:10.1016/j.rser.2017.05.084.
- M. X. Ho and C. Pan, Optimal concentration of alumina nanoparticles in molten Hitec salt to maximize its specific heat capacity, Int. J. Heat Mass Transfer, 2014, 70, 174–184, DOI:10.1016/J.Ijheatmasstransfer.2013.10.078.
- C.-C. Lai, W.-C. Chang, W.-L. Hu, Z. M. Wang, M.-C. Lu and Y.-L. Chueh, A solar-thermal energy harvesting scheme: enhanced heat capacity of molten HITEC salt mixed with Sn/SiOx core–shell nanoparticles, Nanoscale, 2014, 6(9), 4555, 10.1039/c3nr06810b.
- Y. Hu, Y. He, Z. Zhang and D. Wen, Effect of Al2O3 nanoparticle dispersion on the specific heat capacity of a eutectic binary nitrate salt for solar power applications, Energy Convers. Manage., 2017, 142, 366–373, DOI:10.1016/j.enconman.2017.03.062.
- B. Dudda and D. Shin, Effect of nanoparticle dispersion on specific heat capacity of a binary nitrate salt eutectic for concentrated solar power applications, Int. J. Therm. Sci., 2013, 69, 37–42, DOI:10.1016/j.ijthermalsci.2013.02.003.
- M. Schuller, Q. Shao and T. Lalk, Experimental investigation of the specific heat of a nitrate-alumina nanofluid for solar thermal energy storage systems, Int. J. Therm. Sci., 2015, 91, 142–145, DOI:10.1016/j.ijthermalsci.2015.01.012.
- P. Andreu-Cabedo, R. Mondragon, L. Hernandez, R. Martinez-Cuenca, L. Cabedo and J. E. Julia, Increment of specific heat capacity of solar salt with SiO2 nanoparticles, Nanoscale Res. Lett., 2014, 9(1), 1–11, DOI:10.1186/1556-276X-9-582.
- M. Lasfargues, Q. Geng, H. Cao and Y. Ding, Mechanical dispersion of nanoparticles and its effect on the specific heat capacity of impure binary nitrate salt mixtures, Nanomaterials, 2015, 5(3), 1136–1146, DOI:10.3390/nano5031136.
- N. Navarrete, L. Hernández, A. Vela and R. Mondragón, Influence of the production method on the thermophysical properties of high temperature molten salt-based nanofluids, J. Mol. Liq., 2020, 302, 112570, DOI:10.1016/j.molliq.2020.112570.
- U. Nithiyanantham, L. González-Fernández, Y. Grosu, A. Zaki, J. M. Igartua and A. Faik, Shape effect of Al2O3 nanoparticles on the thermophysical properties and viscosity of molten salt nanofluids for TES application at CSP plants, Appl. Therm. Eng., 2020, 169, 114942, DOI:10.1016/j.applthermaleng.2020.114942.
- Z. Yinping, J. Yi and J. Yi, A simple method, the history method, of determining the heat of fusion, specific heat and thermal conductivity of phase-change materials, Meas. Sci. Technol., 1999, 10(3), 201–205, DOI:10.1088/0957-0233/10/3/015.
- D. Ranjan Parida, N. Dani and S. Basu, Data-driven analysis of molten-salt nanofluids for specific heat enhancement using unsupervised machine learning methodologies, Sol. Energy, 2021, 227, 447–456, DOI:10.1016/J.SOLENER.2021.09.022.
- Sigma-Aldrich, TEM image of aluminum oxide (544833), https://www.sigmaaldrich.com/deepweb/content/dam/sigma-aldrich/product2/056/e033342.jpg/_jcr_content/renditions/e033342-large.jpg.
- C. Y. Tang, Q. Shiang Fu, D. Gao, C. S. Criddle and J. O. Leckie, Effect of solution chemistry on the adsorption of perfluorooctane sulfonate onto mineral surfaces, Water Res., 2010, 44(8), 2654–2662, DOI:10.1016/J.WATRES.2010.01.038.
- F. Inam, H. Yan, T. Peijs and M. J. Reece, The sintering and grain growth behaviour of ceramic–carbon nanotube nanocomposites, Compos. Sci. Technol., Jun. 2010, 70(6), 947–952, DOI:10.1016/j.compscitech.2010.02.010.
- M. Toledo, Thermal Analysis UserCom, 7, 1998, available https://www.mt.com/us/en/home/library/usercoms/lab-analytical-instruments/thermal-analysis-usercom-7.html Search PubMed.
- ASTM International, E1269-11 Standard Test Method for Determining Specific Heat Capacity by Differential Scanning Calorimetry, ASTM Int., 2011, doi: DOI:10.1520/E1269-11.
- T. L. Bergman, F. P. Incropera, D. P. DeWitt and A. S. Lavine, Fundamentals of heat and mass transfer, John Wiley & Sons, 2011 Search PubMed.
- A. J. N. Khalifa, Natural convective heat transfer coefficient – a review: I. Isolated vertical and horizontal surfaces, Energy Convers. Manag., 2001, 42(4), 491–504, DOI:10.1016/S0196-8904(00)00042-X.
- A. J. N. Khalifa, Natural convective heat transfer coefficient – a review: II. Surfaces in two- and three-dimensional enc`losures, Energy Convers. Manage., 2001, 42(4), 505–517, DOI:10.1016/S0196-8904(00)00043-1.
- M. X. Ho and C. Pan, Experimental investigation of heat transfer performance of molten HITEC salt flow with alumina nanoparticles, Int. J. Heat Mass Transfer, 2017, 107, 1094–1103, DOI:10.1016/j.ijheatmasstransfer.2016.11.015.
- B. Ma, D. Shin and D. Banerjee, Synthesis and Characterization of Molten Salt Nanofluids for Thermal Energy Storage Application in Concentrated Solar Power Plants—Mechanistic Understanding of Specific Heat Capacity Enhancement, Nanomater., 2020, 10(11), 2266, DOI:10.3390/NANO10112266.
- A. Solé, L. Miró, C. Barreneche, I. Martorell and L. F. Cabeza, Review of the T-history method to determine thermophysical properties of phase change materials (PCM), Renewable Sustainable Energy Rev., 2013, 26, 425–436, DOI:10.1016/J.RSER.2013.05.066.
- E. D. Kravvaritis, K. A. Antonopoulos and C. Tzivanidis, Experimental determination of the effective thermal capacity function and other thermal properties for various phase change materials using the thermal delay method, Appl. Energy, 2011, 88(12), 4459–4469, DOI:10.1016/J.APENERGY.2011.05.032.
- A. Caraballo, S. Galán-Casado, Á. Caballero and S. Serena, Molten salts for sensible thermal energy storage: a review and an energy performance analysis, Energies, 2021, 14(4), 1197, DOI:10.3390/en14041197.
- M. D. Silverman and J. R. Engel, Survey of technology for storage of thermal energy in heat transfer salt, 1977 Search PubMed.
- Y. T. Wu, C. Chen, B. Liu and C. F. Ma, Investigation on forced convective heat transfer of molten salts in circular tubes, Int. Commun. Heat Mass Transfer, 2012, 39(10), 1550–1555, DOI:10.1016/j.icheatmasstransfer.2012.09.002.
- A. G. Fernández, H. Galleguillos, E. Fuentealba and F. J. Pérez, Thermal characterization of HITEC molten salt for energy storage in solar linear concentrated technology, J. Therm. Anal. Calorim., 2015, 122(1), 3–9, DOI:10.1007/s10973-015-4715-9.
- Y. T. Wu, Y. Li, N. Ren, R. P. Zhi and C. F. Ma, Experimental study on the thermal stability of a new molten salt with low melting point for thermal energy storage applications, Sol. Energy Mater. Sol. Cells, 2018, 176, 181–189, DOI:10.1016/J.SOLMAT.2017.12.001.
- G. J. Janz and G. N. Truong, Melting and Premelting Properties of the KN03-NaN02-NaN03 Eutectic System, J. Chem. Eng. Data, 1983, 28(2), 201–202, DOI:10.1021/je00032a022.
- P. Zhang, J. Cheng, Y. Jin and X. An, Evaluation of thermal physical properties of molten nitrate salts with low melting temperature, Sol. Energy Mater. Sol. Cells, 2018, 176, 36–41, DOI:10.1016/j.solmat.2017.11.011.
- P. E. McKnight and J. Najab, Mann-Whitney U test, Corsini Encycl. Psychol., pp. 1, Jan. 2010, DOI:10.1002/9780470479216.CORPSY0524.
- T. W. MacFarland and J. M. Yates, Mann–Whitney U test, Introd. to Nonparametric Stat. Biol. Sci. Using R, 2016, pp. 103–132, DOI:10.1007/978-3-319-30634-6_4.
- G. W. Corder and D. I. Foreman, Nonparametric Statistics for Non-Statisticians: A Step-by-Step Approach, John Wiley & Sons, Inc., 2011 Search PubMed.
- D. Shin and D. Banerjee, Enhanced specific heat of silica nanofluid, J. Heat Transfer, 2011, 133(2) DOI:10.1115/1.4002600/467874.
- L. Sang and T. Liu, The enhanced specific heat capacity of ternary carbonates nanofluids with different nanoparticles, Sol. Energy Mater. Sol. Cells, 2017, 169, 297–303, DOI:10.1016/J.SOLMAT.2017.05.032.
| This journal is © The Royal Society of Chemistry 2023 |


