DOI:
10.1039/D2RA07537G
(Paper)
RSC Adv., 2023,
13, 3438-3447
Structure-based approach: molecular insight of pyranocumarins against α-glucosidase through computational studies†
Received
27th November 2022
, Accepted 16th January 2023
First published on 25th January 2023
Abstract
α-glucosidase is an enzyme that catalyzes the release of α-glucose molecules through hydrolysis reactions. Regulation of this enzyme can increase sugar levels in type-2 diabetes mellitus (DM) patients. Pyranocoumarin derivatives have been identified as α-glucosidase inhibitors. Through an in silico approach, this work studied the inhibition of three pyranocoumarin compounds against the α-glucosidase at the molecular level. Molecular docking and molecular dynamics simulation were performed to understand the dynamics behavior of pyranocoumarin derivatives against α-glucosidase. The prediction of free binding energy (ΔGbind) using the Quantum Mechanics/Molecular Mechanics-Generalized Born (QM/MM-GBSA) approach for each system had the following results, PC1-α-Glu: −13.97 kcal mol−1, PC2-α-Glu: −3.69 kcal mol−1, and PC3-α-Glu: −13.68 kcal mol−1. The interaction energy of each system shows that the grid score, ΔGbind, and ΔGexp values had a similar correlation, that was PC1-α-Glu > PC3-α-Glu > PC2-α-Glu. Additionally, the decomposition energy analysis (ΔGresiduebind) was carried out to find out the contribution of the key binding residue. The results showed that there were 15 key binding residues responsible for stabilizing pyranocumarin binding with criteria of ΔGresiduebind < −1.00 kcal mol−1. The evaluation presented in this work could provide information on the molecular level about the inhibitory efficiency of pyranocoumarin derivatives against a-glucosidase enzyme based on computational studies.
Introduction
α-Glucosidase is a carbohydrase enzyme that catalyzes the release of α-glucose molecules.1 In general, several types of glucosidase are found in the small intestine, namely maltase-glucoamylase and sucrose-isomaltase, which play a role in the release of glucose monomers.2 The glucosidase enzyme is located in the small intestine area, specifically in epithelial cells. Excessive activity of this enzyme causes the release of glucose which is absorbed by the small intestine lumen and enters through blood circulation. The glucose release causes blood sugar levels and uncontrolled hyperglycemia to increase in type-2 diabetes mellitus (DM) patients.3 α-Glucosidase is one of the glucosidase enzymes, which is responsible for the mechanism of DM. α-glucosidase catalyzes the hydrolysis reaction in breaking the α -(1,4)-glycosidic linkage of carbohydrates to become a free monosaccharide (α-D-glucose) before it penetrates the bloodstream.4 It has been reported that several inhibitors from small compounds can bind to the active site of a-glycosidase and delay the absorption of carbohydrates by the small intestine. It makes the α-glucosidase become an essential target in reducing blood sugar levels.5–7 Inhibition of this enzyme is expected to reduce the process of releasing glucose from the breakdown of oligosaccharides and disaccharides into their monomers. Therefore, drug candidates are needed that can interfere with and inhibit the activity of this enzyme. The inhibitory mechanism can be studied through molecular studies on the α-glucosidase active site as a targeted protein.4 Several previous studies stated that inhibition of the α-glucosidase was a promising main target in treating type-2 DM patients.5–7
Inhibition of the α-glucosidase is expected to stop its activity in breaking down carbohydrates into glucose molecules. It should be noted that α-glucosidase inhibitors are small molecules that act as competitive inhibitors.8 The investigation for candidate inhibitors that can bind to the active site is a promising opportunity to control the release of α-D-glucose molecules into epithelial cells.9 Inhibition of α-glucosidase activity slows down the digestion of carbohydrates, thereby reducing glucose absorption into the blood and controlling blood sugar levels. Acarbose has been known as an inhibitor to have good activity in inhibiting α-glucosidase.10,11 It binds very well to the α-glucosidase active site compared to the native substrate (α-glucose, disaccharides, and oligosaccharides). As a result, the carbohydrate hydrolysis pathway at the α-glucosidase active site can be stopped.11 Therefore, the development of α-glucosidase inhibitors needs to be studied to find more efficient drug candidates. Previous studies showed that coumarin derivatives played a promising role in inhibiting the activity of α-glucosidase.12–14 One of them is nordentatin, where nordentatin is the majority secondary metabolite compound of Clausena excavata. This compound was modified using a semi-synthetic method into ester derivatives to develop anti-diabetic candidates.14 The availability of nordentatin from natural products has advantages in anti-diabetic development. Therefore, the study of structural modification becomes crucial in developing anti-diabetic candidates. As reported by our previous work, structural modification of nordentatin through the semi-synthetic reaction of pyranocoumarin can increase the inhibitory activity of the α-glucosidase compared to acarbose (IC50: 7.57 mM) as the positive control. Some of them, namely PC1 (IC50: 1.54 mM), PC2 (IC50: 4.87 mM), and PC3 (IC50: 2.43 mM).14 Based on the report, three semi-synthetic pyranocoumarin derivatives (Fig. 1) are selected as the main focus in this study for further study of the mechanism of α-glucosidase inhibition at the molecular level.
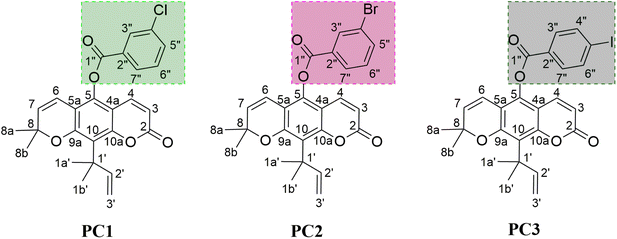 |
| | Fig. 1 The chemical structure of pyranocoumarin derivatives: 2,2-dimethyl-10-(2-methylbut-3-en-2-yl)-8-oxo-2H,8H-pyrano[3,2-g]chromen-5-yl 3-chlorobenzoate (PC1), 2,2-dimethyl-10-(2-methylbut-3-en-2-yl)-8-oxo-2H,8H-pyrano[3,2-g]chromen-5-yl 3-bromobenzoate (PC2), and 2,2-dimethyl-10-(2-methylbut-3-en-2-yl)-8-oxo-2H,8H-pyrano[3,2-g]chromen-5-yl 4-iodobenzoate (PC3). | |
The structure-based approach is known as one of the reliable in silico approaches. It helps predict free energy binding (ΔGbind) between ligands and targeted proteins. The advantage alternative that can be offered is to combine molecular docking and molecular dynamics (MD) simulation, which can predict the value of ΔGbind more accurately in representing the ligand-receptor binding affinity. The ΔGbind can be calculated using two approaches, namely conventional (MM) and hybrid (QM/MM). Conventional or molecular mechanics are computational approaches that are often relied upon in ΔGbind calculation. This approach can be used through two solvent models, such as Poisson-Boltzmann surface area (PBSA) and generalized Born surface area (GBSA).15 It is known that the PBSA solvent model takes considerable computation time compared to GBSA. Therefore, the GBSA solvent model attracts more attention for further development in ΔGbind calculations for several computing systems. One way is to use a hybrid approach with the GBSA solvent model. In the QM approach, the internal energy is calculated using several basis sets, such as PM3 and DFTB methods. However, the DFTB method requires a high computational cost compared to the PM3 method. Additionally, the QM method is focused on the ligand, whereas the MM method is focused on the receptor. The application of this approach in conducting ΔGbind analysis has proven to be successfully applied to many systems.16 Therefore, the prediction of ΔGbind values can be calculated through the Quantum Mechanic/Molecular Mechanic-Generalized Born Surface Area (QM/MM-GBSA) approach. Its calculated prediction can detail the ΔGbind values of each system, such as ligand, receptor, and complex.15 Additionally, the calculation of ΔGbind using a hybrid approach (QM/MM) is considered to have better prediction accuracy than the conventional approach (MM). The expectancy is that the prediction of ΔGbind using this method has a level of accuracy close to the experimental results.
Structural units and functional groups affect the activity of a drug candidate through a series of targeted protein-inhibitory mechanisms in the human body. Therefore, molecular studies play a crucial role in understanding the inhibitory mechanism of a drug candidate.17 The goal is to be able to determine the key binding residue that plays regulation in the inhibition of the target protein. In addition, the advantages of molecular studies are being able to provide promising lead compounds to be continued in modifying functional groups through semi-synthesis methods. In this present study, we tried to study the inhibitory mechanism of pyranocoumarin derivatives (PC1, PC2, and PC3), which have good inhibitory activity against the α-glucosidase at the molecular level through computational studies. Molecular studies regarding the activity of pyranocoumarin derivatives (PC1, PC2, and PC3) against α-glucosidase are first reported in this paper. Several main variables measured in this study are conformational dynamics, binding affinity, and key binding residue. The information and data obtained from this study are expected to be a reference for future drug designs based on pyranocumarin compounds.
Methodology
Ligand and receptor preparation
The inhibition target selected in this study was the α-glucosidase enzyme from Saccharomyces cerevisiae. Meanwhile, the selection of the protein code: 3A4A for the α-glucosidase enzyme is obtained from the protein data bank (https://www.rcsb.org/structure/3a4a). The selected protein is a crystal complex of the α-glucosidase enzyme successfully characterized from Saccharomyces cerevisiae.4 Reconstruction of the standard missing residue using the modeller 9.21 package. In addition, at the α-glucosidase active site, there is a native ligand, namely α-D-glucopyranose (PDB ID: GLC). The GLC coordinates were used as a reference for determining the α-glucosidase active site. Acarbose is also performed in this study as a control. Meanwhile, the pyranocoumarin derivatives (PC1, PC2, and PC3) modeled in this study have been successfully synthesized and characterized by previous studies.14 For the preparation of pyranocoumarins, the electrostatic potential (ESP) charges were calculated using semiempirical quantum parametric method-3 (SQM-PM3) via Gaussian 16 package.18 Additionally, the addition of hydrogen atoms, AMBER FF14SB force field, and AM1-BCC aims to calculate missing parameters, such as bonded, non-bonded, and charge.
Molecular docking
All stages of molecular docking were performed using the DOCK6 package.19 The cluster sphere is determined using the sphgen tool to find the coordinates of the receptor active site. Furthermore, native ligand coordinates are used to select cluster spheres with a radius of 10.0 Å based on GLC ligand coordinates using the sphere_selector tool. The selected cluster sphere is used as a coordinate where ligand and receptor interaction occurs. Grid-box preparation uses several crucial parameters, such as grid-spacing (0.3 Å), center (X: 20.53, Y: −10.11, Z: 22.38), and dimensions (X: 27.31, Y: 29.51, Z: 29.35). Meanwhile, the interaction energy of ligand-α-Glu was calculated using a functional gird scoring with an anchor-and-grow algorithm.20 The ligand-receptor scoring process (Eqn. (1)) takes place in the gaseous state with energy considerations in the form of van der Waals (EvdW) and electrostatic (Eele) energies.| | |
Grid-Score = EvdW + Eele
| (1) |
System preparation for MD simulation
The topology preparation before the simulation is carried out through the tleap tool21 contained in the AMBER22 package, which consists of ligand, receptor, solvated receptor, complex, and solvated complex topologies. The ligand topology is prepared using the parmchk tool to generate a frcmod file containing bond, angle, dihedral, improper, and non-bond parameters. The preparation of receptor topology consists of standard amino acids with the leaprc_source_protein tool based on force field ffSB14.22 The complex topology combines the ligand and receptor coordinates obtained previously using the amberparm tool available in the AMBER22 package. Meanwhile, the solvated topologies are applied through solvatebox TIP3PBOX (distance: 12 Å) with the leaprc.water.tip3p tool. The addition of sodium ions (Na+) is done to neutralize the system randomly. Then, the system minimization is performed in three stages, that are (i) water molecules and sodium ions, (ii) ligand-receptor, and (iii) the whole system. The crucial parameters in the minimization process are the steepest descent: 1500 steps and conjugate gradient: 500 steps. Finally, the minimization process is calculated using the sander tools available in the AMBER22 package. The minimization process aims to keep the formed system does not experience excessive fluctuations during the simulation process due to the influence of bad atomic contacts.23
MD simulation
The simulation process is carried out through several stages, followed by heating, equilibrium, and production using PMEMD.cuda tool contained in the AMBER22 package. First, the heating stage is carried out for 200 ps with temperature settings from 10 K to 310 K gradually. Second, the system is equilibrated for 1300 ps at a temperature of 310 K in stages with harmonic restraints of 30, 20, 10, and 5 kcal−1 mol−1 A2. Third, the production stage is carried out for 100 ns under NPT ensemble conditions (1 atm and 310 K). Furthermore, the trajectories generated during the simulation process are analyzed using cpptraj24 and MMPBSA.py15 tools, which are available in the AMBER22 package. Trajectories analysis is used to analyze several variables, such as conformational dynamics, binding affinity, key binding residue, inhibitor-α-glucosidase interaction, and water accessibility.
Free energy binding
The calculation of free energy binding Δ(Gbind) uses the last 20 ns (80–100 ns) of trajectories with a hybrid-based approach. The enthalpy (ΔH) term is calculated by using the Quantum Mechanics/Molecular Mechanics-Generalized Born (QM/MM-GBSA) approach.25 Furthermore, several crucial parameters, such as the generalized Born solvation model: 5 and QM level theory: PM3 method, were utilized in this work. Meanwhile, the entropy change (−TΔS) term is calculated based on the normal mode approach (NMODE). In summary, the ΔGbind can be calculated through eqn (2). Free energy decomposition (ΔGresiduebind) is also calculated to find the interaction energy between the ligand and the amino acid residue responsible for the interaction on the receptor active site. The ΔGresiduebind calculation is calculated using the Molecular Mechanics-Generalized Born (MM-GBSA) approach. Meanwhile, the experimental ΔGbind calculation uses eqn (3), the IC50 value as a reference variable.26 The variables R and T are the ideal gas constant (1.9872 × 10⁻³ kcal K−1 mol−1) and room temperature (300 K), respectively.
Results and discussion
Molecular docking analysis
The molecular docking aims to determine the initial orientation of each ligand on the targeted protein active site. The molecular docking stage begins with determining the active site through the redocking method. This step has advantages in determining the active site of targeted proteins very well.27 It should be noted that the coordinates of the native ligand obtained from the co-crystal are known. Briefly, GLC coordinates have been extracted using the chimera version 13 package. The cluster spheres on the receptor surface are shown in Fig. S1.† It shows that each color of the cluster spheres indicates the possible coordinates of the interactions on the receptor surface. The selection of spheres clusters is based on the GLC coordinates as the native ligand of the α-glucosidase. The redocking shows a good superposition with an RMSD value of 0.99 Å (Fig. 2). It also identified that the superposition of the redocking result (pose) gave coordinate values similar to the native ligand from the co-crystal.19,20,28 Hence, the obtained coordinate from redocking is feasible for further analysis.
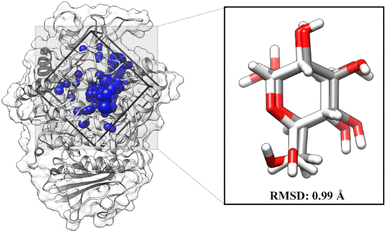 |
| | Fig. 2 Redocking analysis: the grid-box coordinate is based on the selected cluster sphere. The GLC superposition between co-cristal (white) and pose (grey). | |
The second stage is to dock the ligand to the α-glucosidase active site. The variables measured at this stage are energy and type of interaction on the receptor active site. Docking results show that each ligand is well occupied to the receptor active site. Several amino acid residues are responsible for the interaction process for each ligand, such as GLC-α-Glu: eight, AC1-α-Glu: seven, PC1-α-Glu: six, PC2-α-Glu: seven, and PC3-α-Glu: seven (Fig. S2†). In particular, the pyranocoumarin derivatives, which are this study's main focus, show several interactions with amino acid residues on the receptor active site. In detail, PC1-α-Glu (K153, Y155, F300, F311, R312, and N412), PC2-α-Glu (K153, Y155, H277, F300, F311, R312, and D349), and PC3-α- Glu (K153, Y155, H277, F300, F311, R312, and N412). More specifically, the hydrogen bond shows that PC1-α-Glu and PC3-α-Glu have one hydrogen bond with the residue N412. Meanwhile, PC2-α-Glu did not show any hydrogen bonds. This finding will be discussed further in the next section to look at the hydrogen bond occupation of pyranocoumarin derivatives. The interaction energy showed that the pyranocumarins have a better grid score than acarbose and GLC (Fig. 3). This result is indicated by the increasingly negative value of the grid score (kcal mol−1). The grid score value is obtained from the contribution of energy in the gas phase, namely van der Waals (EvdW) and electrostatic (Eele) energies. In particular, EvdW shows a significant energy contribution (>−60.00 kcal mol−1) to the interaction energy of pyranocoumarins against α-glucosidase. Overall, the grid score analysis showed an inhibitory activity (IC50) which is similar to the results of the in vitro test that we previously reported,14 PC1 > PC3 > PC2 > AC1. We assume that the contribution of EvdW has a significant contributor to the interaction energy between pyranocumarins and α-glucosidase, thermodynamically. It should be noted that this assumption needs to be studied further through the MD simulation, which is explained in detail in the next section. Therefore, the analysis of pyranocoumarins (PC1, PC2, and PC3) is feasible to study their dynamic behavior. This consideration was taken based on its excellent inhibitory activity against the α-glucosidase in the form of IC50 and grid score values. The obtained coordinates from molecular docking were used for further analysis, such as conformational dynamics, binding affinity, key binding residue, water accessibility, and inhibitor-α-glucosidase interaction.
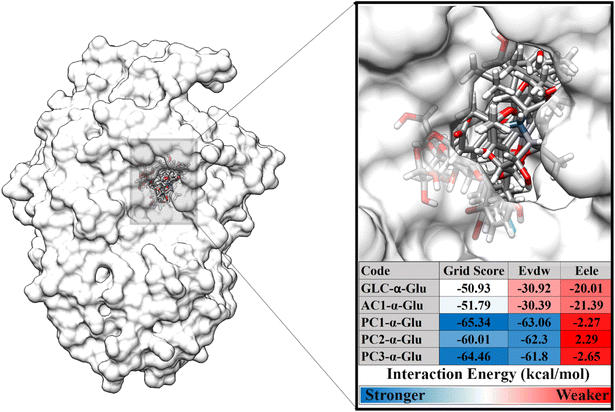 |
| | Fig. 3 Ligand-receptor docking based on grid score functional (EvdW + Eele). | |
Conformational dynamics of each system: stability, compactness, and flexibility
For the conformational dynamics evaluation of each system, we use 100 ns trajectories to analyze several variables, such as the root-mean-square displacement (RMSD), total energy, the radius of gyration (RoG), B-factor, and the root-mean-square fluctuations (RMSF). These variables aim to see the quality of each system.
The RMSD value identifies the system's stability formed during the simulation time.29 Notably, the RMSD of each system showed insignificant fluctuation, which is <0.4 nm (Fig. 4). The RMSD value of each system rapidly increased during the first 2 ns and then fluctuated at ∼0.19–0.25 nm in all systems until 100 ns. In particular, the last 40 ns trajectories (60–100 ns) show good stability. From the thermodynamic aspect, the total energy also shows that each system has converged because it does not have excessive energy fluctuations during the heating, equilibrium, and production stages under NPT assembly. It can be seen through the fluctuation plot (Fig. S3†) and the average value (Table S1†) of the total energy.
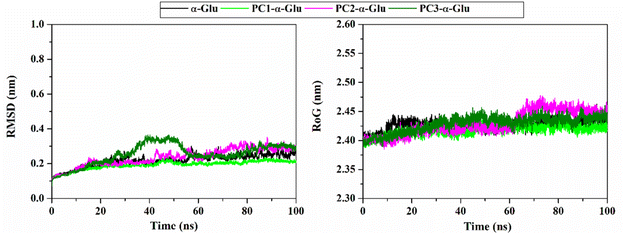 |
| | Fig. 4 The root-mean-square displacement of all atoms (left) and radius of gyration (right) for each system plotted along the 100 ns simulation time. | |
The analysis continued to see the compactness of the formed structure during the simulation through RoG analysis. In tune with system stability, the RoG value showed insignificant fluctuation for each system (Fig. 4). Overall, the RoG values showed an average fluctuation at ∼2.41–2.42 nm. The insignificant difference in RoG values indicates that each system's structure is rigid and stably folded.30 This statement is supported by looking at the average structure during 100 ns simulation time (Fig. 5). On the opposite, we also analyze the flexibility of each system (Fig. 5) through B-factor and RMSF values.31 The analysis shows that the apoprotein structure is more flexible than the three formed complexes. We suggest that pyranocumarins that bind to the receptor active site can increase the rigidity of the complex. It can be seen from the average values of the B-factor and RMSF, which show a flexibility trend as follows α-Glu > PC1- α-Glu > PC2- α-Glu > PC3- α-Glu (Table S1†).
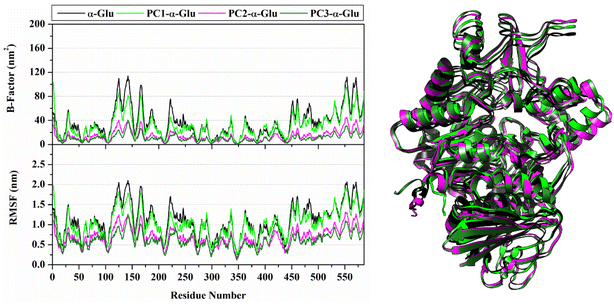 |
| | Fig. 5 System flexibility is shown by B-factor and the root-mean-square fluctuations (left) and the superposition of average structure (right) plotted along 100 ns simulation time. | |
The conformational dynamics analysis shows that each system has reached its equilibrium and is suitable for further analysis. Based on the stability analysis that has been described, we use the last 10 ns trajectories to calculate free energy binding and energy decomposition.
Binding affinity of inhibitors against α-glucosidase
Free energy binding (ΔGbind) was calculated using the MMPBSA.py tool available in the AMBER22 package. The ΔGbind calculation uses 100 snapshots extracted from the last 10 ns trajectories. It is because system stability has been achieved on its trajectories range (Fig. 4). In addition, the pyranocoumarins superposition extracted from the trajectories range does not experience a significant change in coordinates on the receptor active site (Fig. 6). Therefore, visualization data is the indicator that considered to analyze the ΔGbind of each system. In detail, Energy component calculations from ΔGbind are listed in Table 1.
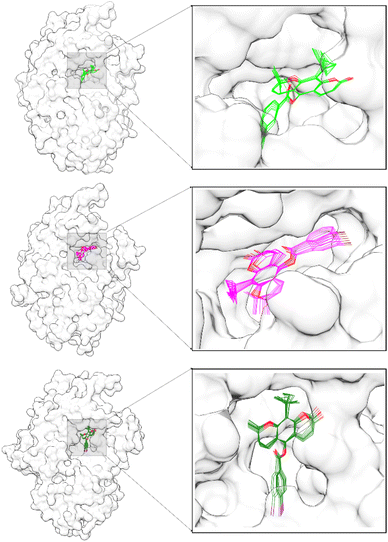 |
| | Fig. 6 The ligand superposition on the α-glucosidase active site was extracted in 10 snapshots from the last 10 ns trajectories: PC1-α-Glu (top), PC2-α-Glu (middle), and PC3-α-Glu (bottom). | |
Table 1 Energy components (kcal mol−1) of each system were calculated by using QM/MM-GBSA approach. Data are shown as mean ± standard error of the mean (SEM)
| Energy Components |
PC1-α-Glu |
PC2-α-Glu |
PC3-α-Glu |
| QM/MM (PM3) |
| ΔEvdW |
−50.53 ± 0.21 |
−42.96 ± 0.25 |
−50.48 ± 0.42 |
| ΔEele |
−0.30 ± 0.00 |
0.93 ± 0.00 |
0.68 ± 0.00 |
| ΔGgas |
−50.83 ± 0.21 |
−42.03 ± 0.25 |
−49.79 ± 0.42 |
| ΔGSCF |
−17.67 ± 0.29 |
−14.48 ± 0.63 |
−22.14 ± 0.61 |
![[thin space (1/6-em)]](https://www.rsc.org/images/entities/char_2009.gif) |
| GBSA |
| ΔGelesolv |
40.79 ± 0.32 |
33.50 ± 0.49 |
41.00 ± 0.51 |
| ΔGnonpolarsolv |
−6.43 ± 0.01 |
−5.16 ± 0.03 |
−6.07 ± 0.03 |
| ΔGsol |
34.36 ± 0.31 |
28.34 ± 0.51 |
34.93 ± 0.50 |
![[thin space (1/6-em)]](https://www.rsc.org/images/entities/char_2009.gif) |
| NMODE |
| −TΔS |
20.17 ± 1.26 |
24.48 ± 0.98 |
23.32 ± 1.34 |
![[thin space (1/6-em)]](https://www.rsc.org/images/entities/char_2009.gif) |
| Hybrid-based free energy binding |
| ΔH |
−34.14 ± 0.27 |
−28.17 ± 0.26 |
−37.00 ± 0.46 |
| ΔGbind |
−13.97 |
−3.69 |
−13.68 |
![[thin space (1/6-em)]](https://www.rsc.org/images/entities/char_2009.gif) |
| Experimental free energy binding |
| ΔGexp |
−3.86 |
−3.17 |
−3.58 |
The enthalpy energy component (ΔH) is divided into two main categories, that is, gas (ΔGgas) and solvation (ΔGsol) terms.32 In detail, the ΔGgas term is obtained from the contribution of van der Waals (ΔEvdW) and electrostatic (ΔEele) energies.33,34 Meanwhile, the ΔGsol term is obtained from the contribution of the generalized Born model (ΔGelesolv) and solvent-accessible surface area energy (ΔGnonpolarsolv). The results show that ΔGgas is the most significant main contribution to ΔH for each system compared to ΔGsol. More specifically, ΔEvdW is the main contributor to the ΔGbind value. It is inseparable from the results of molecular docking analysis, which show a similar trend. In particular, in calculations using the QM method, self-consistent energy (ΔGSCF) also contribute to the ΔGbind value of each system33,35 It should be noted that the pyranocoumarin molecules are treated as a QM region using the SQM-PM3 method. Interestingly, the value of ΔGSCF shows a significant difference for each system. It indicates that the differences in functional groups (Cl, Br, and I) in each pyranocoumarins significantly influence the ΔGSCF value. Meanwhile, changes in entropy (−TΔS) make a crucial contribution to the value of free energy binding.26 It can be seen through eqn (2), described in the previous section. Briefly, the free energy binding value (kcal mol−1) shows a good correlation between the predicted (ΔGbind) and experimental (ΔGexp) results with the binding affinity strength as follows: PC1 > PC3 > PC2. Interestingly, the grid score from molecular docking also shows a similar trend (Fig. 3). Based on ΔGbind, PC3 has –I (larger size) as a functional group showing better binding affinity in comparison to –Br (PC2). However, the PC1 having –Cl (smallest in size) is showing the best results. It should be noted that PC1, PC2, and PC3 structures have different halogen atoms on the 4′′ and 5′′ positions of the phenyl ring. Additionally, the difference in the size of the halogen atom can increase the possibility of interaction with amino acid residues on the α-glucosidase active site. Meanwhile, the difference in position leads to a change in the binding orientation of the phenyl ring in each inhibitor. Differences in size and position also affect the interaction energy of ΔGSCF, ΔH, and −TΔS (Table 1). These factors are the main reasons for determining the binding affinity of each system thermodynamically. Systems with a more substantial ΔGbind value are expected to bind well on the α-glucosidase active site and inhibit the regulation of carbohydrate hydrolysis into glucose monomers by this enzyme.
Key binding residues
In this section, we suspect several key binding residues are the main contributors to stabilizing the pyranocoumarins binding. Therefore we evaluated the decomposition energy (ΔGresiduebind) using the MM-GBSA approach.15 The calculation of ΔGresiduebind aims to study the interaction energy of amino acids that are at the receptor active site.33 Meanwhile, consideration of interaction energy criteria is indicated by the value of ΔGresiduebind < −1.00 kcal mol−1. The value of ΔGresiduebind is obtained from the energy contribution of Evdw and Eele for each residue. The results show that each system has key bindingresidues that meet the criteria (Fig. 7), such as PC1-α-Glu (three residues: F165, R312, and N412), PC2-α-Glu (seven residues: Y155, F156, R210, R312, V407, R439, and R443), and PC3-α-Glu (eleven residues: Y155, R173, R210, R219, F300, R312, Q350, R352, R356, R439, and R443). In particular, PC1-α-Glu shows that the residue R312 has ΔGresiduebind, which is −5.11 kcal mol−1. It identifies that the residue is favorable to PC1 bindings. In addition, we suspect that residue N412 is leading for PC1 bindings because it has several crucial interactions, such as atomic contact and hydrogen bond, which will be explained in the next section. In the case of PC3-α-Glu, showing amino acid residues that have a substansial ΔGresiduebind contribution, that is, R210 (−8.98 kcal mol−1), R312 (−4.80 kcal mol−1), and R439 (−6.54 kcal mol−1). The presence of the –I atom on the 5′′ position of phenyl contributes to stabilizing three key binding residues, namely F300, R312, and Q350 (Fig. 7). It is seen that the phenyl-5′′-I ring enters and binds the receptor pocket very well (Fig. 6). The –I atom size may influence the binding orientation of the PC3 molecule.
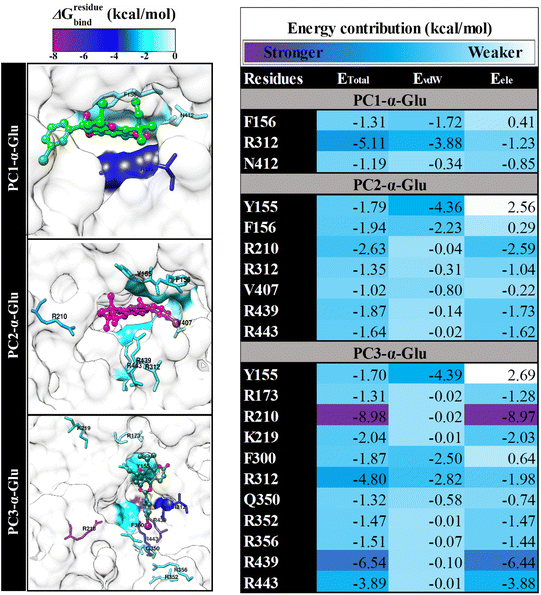 |
| | Fig. 7 The energy decomposition (ΔGresiduebind) and energy contribution (EvdW + Eele) were calculated by using the MM-GBSA approach. The results were plotted over the last 10 ns trajectories. | |
Therefore, the presence of the –I atom on the 5′′ position of phenyl is crucial in stabilizing the interaction in the receptor active site. Meanwhile, PC2-α-Glu showed a contribution of ΔGresiduebind from −1.02 to −2.63 kcal mol−1. It is hoped that the information obtained from the key binding residue can lead us to understand the binding pattern of the ligand-receptor.23 It is helpful as a reference for consideration in the rational selection of functional groups in obtaining reliable candidate α-glucosidase inhibitors.
Inhibitor-α-glucosidase interaction in the binding pocket
For the following evaluation, we tried to describe the interaction between the pyranocoumarins and the α-glucosidase at the atomistic level. Here we describe two main variables, namely atomic contact and hydrogen bond. Those variables are analyzed using 100 ns trajectories. The results show that each system has intense contact atoms with several amino acid residues on the receptor active site (Fig. 8 and Table S2†), namely PC1-α-Glu: 13 contacts, PC2-α-Glu: 18 contacts, and PC3-α-Glu: 10 contacts. Furthermore, we found that among the amino acid residues, several key binding residues have intense contact with each of the pyranocoumarins. In particular, residue N412, one of the key binding residues, experienced intense contact with oxygen atoms (2C![[double bond, length as m-dash]](https://www.rsc.org/images/entities/char_e001.gif) O) from PC1 by 92.39% during a simulation time of 100 ns. Furthermore, we analyzed the hydrogen occupation for each system (Table 2). Hydrogen bonds with an acceptable percentage of PHB ≥ 90% identify the strong category.36 Once again, occupation N412 shows a good hydrogen bond category with PHB equal to 90.88%. This finding reinforces our previous assumptions about residue N412 as a guide for the binding pattern of PC1-α-Glu. In another site, PC3-α-Glu showed a PHB value of 19.25% for residue N412 with a weak hydrogen bond category. Meanwhile, PC2-α-Glu did not show hydrogen bond criteria even though two bonds were recorded with residue R312 during a simulation time of 100 ns. It is because the two bonds have a tiny percentage of hydrogen bond occupation, which is <10%. This finding shows a correlation with the results of molecular docking (Fig. S2†). It might explain why PC2 has lower inhibitory activity than the other two pyranocoumarin derivatives. Therefore, the selection of functional groups greatly influences the binding orientation of a molecule.
O) from PC1 by 92.39% during a simulation time of 100 ns. Furthermore, we analyzed the hydrogen occupation for each system (Table 2). Hydrogen bonds with an acceptable percentage of PHB ≥ 90% identify the strong category.36 Once again, occupation N412 shows a good hydrogen bond category with PHB equal to 90.88%. This finding reinforces our previous assumptions about residue N412 as a guide for the binding pattern of PC1-α-Glu. In another site, PC3-α-Glu showed a PHB value of 19.25% for residue N412 with a weak hydrogen bond category. Meanwhile, PC2-α-Glu did not show hydrogen bond criteria even though two bonds were recorded with residue R312 during a simulation time of 100 ns. It is because the two bonds have a tiny percentage of hydrogen bond occupation, which is <10%. This finding shows a correlation with the results of molecular docking (Fig. S2†). It might explain why PC2 has lower inhibitory activity than the other two pyranocoumarin derivatives. Therefore, the selection of functional groups greatly influences the binding orientation of a molecule.
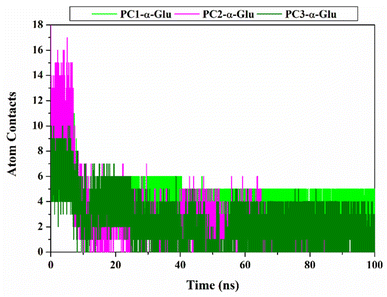 |
| | Fig. 8 Inhibitor- α-glucosidase interaction: Atom contacts was plotted along 100 ns simulation time. | |
Table 2 The hydrogen bond was calculated using 100 ns trajectories (the cut value: distance 3.5 Å and angle 120°)
| H-Bond |
PHB (%) |
AvgDist (Å) |
AvgAng (o) |
| PC1-α-Glu |
2C![[double bond, length as m-dash]](https://www.rsc.org/images/entities/char_e001.gif) ![[O with combining low line]](https://www.rsc.org/images/entities/char_004f_0332.gif) ⋯H–ND2(N412) ⋯H–ND2(N412) |
90.88 |
3.04 |
153.10 |
![[thin space (1/6-em)]](https://www.rsc.org/images/entities/char_2009.gif) |
| PC2-α-Glu |
1′′C![[double bond, length as m-dash]](https://www.rsc.org/images/entities/char_e001.gif) ![[O with combining low line]](https://www.rsc.org/images/entities/char_004f_0332.gif) ⋯H–NH1(R312) ⋯H–NH1(R312) |
1.43 |
3.25 |
126.54 |
8C–![[O with combining low line]](https://www.rsc.org/images/entities/char_004f_0332.gif) ⋯H–N(R312) ⋯H–N(R312) |
1.10 |
3.37 |
160.63 |
![[thin space (1/6-em)]](https://www.rsc.org/images/entities/char_2009.gif) |
| PC2-α-Glu |
2C![[double bond, length as m-dash]](https://www.rsc.org/images/entities/char_e001.gif) ![[O with combining low line]](https://www.rsc.org/images/entities/char_004f_0332.gif) ⋯H-ND2(N412) ⋯H-ND2(N412) |
19.25 |
3.08 |
151.98 |
Water accessibility of inhibitor-α-glucosidase
The water molecules to access the receptor surface area were presented through the solvent-accessible surface area (SASA).37,38 The analysis process uses 100 ns trajectories during the simulation time (Fig. 9). In particular, the solvent access to the receptor pocket uses a radius of 5 Å from the coordinates of each ligand. The obtained results show the access value of water molecules for each system, followed by PC2-α-Glu > PC3-α-Glu > PC1-α-Glu (Table 3). We suspect that the difference in SASA values in each system is caused by differences in the size (–Cl, –Br, and –I) and position (meta/para) of the functional groups of each molecule. The difference in SASA values in the pocket surface area indicates that the difference in size and position of the halogen atoms can impact the water molecule's access. In general, access to water molecules can be affected by a ligand in the receptor pocket area.39 It is caused by the lack of free space in the pocket surface area to be accessed by water molecules. Meanwhile, the functional group position can change the orientation of a molecule in the binding pattern. Consequently, this orientation affects the number of water molecules to access the pocket surface area. As we know, the role of water molecules is crucial for maintaining protein structure.40
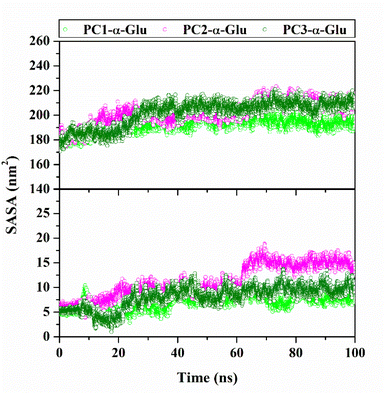 |
| | Fig. 9 The solvent-accessible surface (SASA) plotted along 100![[thin space (1/6-em)]](https://www.rsc.org/images/entities/char_2009.gif) 100 ns simulation time: All surface area (top) and pocket surface area (bottom). 100 ns simulation time: All surface area (top) and pocket surface area (bottom). | |
Table 3 The average value of SASA was calculated using 100 ns trajectories
| System |
All surface area (nm2) |
Pocket surface area (nm2) |
| PC1-α-Glu |
192.65 ± 5.65 |
7.07 ± 1.43 |
| PC2-α-Glu |
202.28 ± 8.86 |
11.14 ± 3.32 |
| PC3-α-Glu |
201.77 ± 10.33 |
8.09 ± 2.19 |
Conclusions
In this work, we describe the differences in the inhibitory activity of three pyranocoumarin derivatives (PC1, PC2, and PC3) against the α-glucosidase enzyme at the molecular level. The analysis process is carried out through a structure-based approach in the form of molecular docking and molecular dynamics simulation. We found that the differences in the functional groups and the positions of the halogen atoms in the modeled molecular structures lead to differences in the inhibitory activity of the α-glucosidase. The simulation results suggest that pyranocoumarins that bind to the receptor active site can increase the rigidity and stability of the complex. From the thermodynamic aspect, the binding affinity calculation shows a good correlation with the predicted and experimental free energy binding value, following the trend of PC1 > PC3 > PC2. Meanwhile, we found that there are 15 key binding residues (ΔGresiduebind) that play a role in stabilizing the pyranocoumarins binding, such as Y155, Y156, F165, R173, R210, R219, F300, R312, Q350, R352, R356, V407, N412, R439, and R443. Hopefully, obtained information from this work can provide insight into designing candidates for α-glucosidase enzyme inhibitors based on pyranocoumarin derivatives.
Author contributions
M. I. A conceived the in silico research, analyzed the results, wrote the initial manuscript, and finalized the manuscript. I. S. and B. S. contained computational resources. N. S. A and A. N. K. supervised the research and revised the manuscript. A. P. W and Y. T. helped with the supervised data collection. All authors discussed and commented on the manuscript.
Conflicts of interest
The authors declare no conflict of interest.
Acknowledgements
This study was supported by the Research Program of “Penelitian Pasca Sarjana – Penelitian Disertasi Doktor” from DRTPM KEMENDIKBUDRISTEK TAHUN 2022. Contract Number: 923/UN3.15/PT/2022. Additionally, we are grateful for this work's computational resources supported by UCoE Research Center for Bio-Molecule Engineering, Universitas Airlangga (BIOME-UNAIR).
References
- T. Tian, G. Y. Chen, H. Zhang and F. Q. Yang, Molecules, 2021, 26, 1–11 Search PubMed.
- D. R. Rose, M. M. Chaudet and K. Jones, J. Pediatr. Gastroenterol. Nutr., 2018, 66, S11–S13 CrossRef CAS PubMed.
- F. J. Pasquel, M. C. Lansang, K. Dhatariya and G. E. Umpierrez, Lancet Diabetes Endocrinol., 2021, 9, 174–188 CrossRef CAS PubMed.
- K. Yamamoto, H. Miyake, M. Kusunoki and S. Osaki, FEBS J., 2010, 277, 4205–4214 CrossRef CAS PubMed.
- U. Ghani, Eur. J. Med. Chem., 2015, 103, 133–162 CrossRef CAS PubMed.
- C. Proença, M. Freitas, D. Ribeiro, E. F. T. Oliveira, J. L. C. Sousa, S. M. Tomé, M. J. Ramos, A. M. S. Silva, P. A. Fernandes and E. Fernandes, J. Enzyme Inhib. Med. Chem., 2017, 32, 1216–1228 CrossRef PubMed.
- A. M. Dirir, M. Daou, A. F. Yousef and L. F. Yousef, Phytochem. Rev., 2022, 21, 1049–1079 CrossRef CAS PubMed.
- U. Hossain, A. K. Das, S. Ghosh and P. C. Sil, Food Chem. Toxicol., 2020, 145, 111738 CrossRef CAS PubMed.
- S. T. Assefa, E. Y. Yang, S. Y. Chae, M. Song, J. Lee, M. C. Cho and S. Jang, Plants, 2020, 9, 1–17 CrossRef PubMed.
- J. J. DiNicolantonio, J. Bhutani and J. H. O'Keefe, Open Heart, 2015, 2, e000327 CrossRef PubMed.
- L. Gong, D. Feng, T. Wang, Y. Ren, Y. Liu and J. Wang, Food Sci. Nutr., 2020, 8, 6320–6337 CrossRef CAS PubMed.
- T. M. Thant, N. S. Aminah, A. N. Kristanti, R. Ramadhan, P. Phuwapraisirisan and Y. Takaya, Nat. Prod. Res., 2021, 35, 556–561 CrossRef CAS PubMed.
- A. Athipornchai, R. Kumpang and S. Semsri, J. Oleo Sci., 2021, 70, 1669–1676 CrossRef CAS PubMed.
- T. M. Thant, N. S. Aminah, A. N. Kristanti, R. Ramadhan, H. T. Aung and Y. Takaya, Open Chem., 2020, 18, 890–897 CAS.
- B. R. Miller, T. D. McGee, J. M. Swails, N. Homeyer, H. Gohlke and A. E. Roitberg, J. Chem. Theory Comput., 2012, 8, 3314–3321 CrossRef CAS PubMed.
- T. Hou, J. Wang, Y. Li and W. Wang, J. Chem. Inf. Model., 2011, 51, 69–82 CrossRef CAS PubMed.
- Q. Li and C. Kang, Int. J. Mol. Sci., 2020, 21, 1–18 Search PubMed.
- M. J. Frisch, G. W. Trucks, H. B. Schlegel, G. E. Scuseria, M. A. Robb, J. R. Cheeseman, G. Scalmani, V. Barone, B. Mennucci, G. A. Petersson, H. Nakatsuji, M. Caricato, X. Li, H. P. Hratchian, A. F. Izmaylov, J. Bloino, G. Zheng, J. L. Sonnenberg, M. Hada, M. Ehara, K. Toyota, R. Fukuda, J. Hasegawa, M. Ishida, T. Nakajima, Y. Honda, O. Kitao, H. Nakai, T. Vreven, J. A. Montgomery, Jr., J. E. Peralta, F. Ogliaro, M. Bearpark, J. J. Heyd, E. Brothers, K. N. Kudin, V. N. Staroverov, R. Kobayashi, J. Normand, K. Raghavachari, A. Rendell, J. C. Burant, S. S. Iyengar, J. Tomasi, M. Cossi, N. Rega, J. M. Millam, M. Klene, J. E. Knox, J. B. Cross, V. Bakken, C. Adamo, J. Jaramillo, R. Gomperts, R. E. Stratmann, O. Yazyev, A. J. Austin, R. Cammi, C. Pomelli, J. W. Ochterski, R. L. Martin, K. Morokuma, V. G. Zakrzewski, G. A. Voth, P. Salvador, J. J. Dannenberg, S. Dapprich, A. D. Daniels, O. Farkas, J. B. Foresman, J. V. Ortiz, J. Cioslowski, and D. J. Fox, Gaussian 16, Revision C.01, Gaussian, Inc., Wallingford CT, 2016 Search PubMed.
- W. J. Allen, T. E. Balius, S. Mukherjee, S. R. Brozell, D. T. Moustakas, P. T. Lang, D. A. Case, I. D. Kuntz and R. C. Rizzo, J. Comput. Chem., 2015, 36, 1132–1156 CrossRef CAS PubMed.
- S. R. Brozell, S. Mukherjee, T. E. Balius, D. R. Roe, D. A. Case and R. C. Rizzo, J. Comput.-Aided Mol. Des., 2012, 26, 749–773 CrossRef CAS PubMed.
- D. A. Case, T. E. Cheatham, T. Darden, H. Gohlke, R. Luo, K. M. Merz, A. Onufriev, C. Simmerling, B. Wang and R. J. Woods, J. Comput. Chem., 2005, 26, 1668–1688 CrossRef CAS PubMed.
- J. A. Maier, C. Martinez, K. Kasavajhala, L. Wickstrom, K. E. Hauser and C. Simmerling, J. Chem. Theory Comput., 2015, 11, 3696–3713 CrossRef CAS PubMed.
- B. Nutho, S. Pengthaisong, A. Tankrathok, V. S. Lee, J. R. K. Cairns, T. Rungrotmongkol and S. Hannongbua, Biomolecules, 2020, 10, 1–19 CrossRef PubMed.
- D. R. Roe and T. E. Cheatham, J. Chem. Theory Comput., 2013, 9, 3084–3095 CrossRef CAS PubMed.
- A. S. Christensen, T. Kubař, Q. Cui and M. Elstner, Chem. Rev., 2016, 116, 5301–5337 CrossRef CAS PubMed.
- P. C. Su, C. C. Tsai, S. Mehboob, K. E. Hevener and M. E. Johnson, J. Comput. Chem., 2015, 36, 1859–1873 CrossRef CAS PubMed.
- E. D. Boittier, Y. Y. Tang, M. E. Buckley, Z. P. Schuurs, D. J. Richard and N. S. Gandhi, Int. J. Mol. Sci., 2020, 21, 1–19 Search PubMed.
- P. C. H. Lam, R. Abagyan and M. Totrov, J. Comput.-Aided Mol. Des., 2018, 32, 187–198 CrossRef CAS PubMed.
- M. Askarzadeh, H. Azizian, M. Adib, M. Mohammadi-Khanaposhtani, S. Mojtabavi, M. A. Faramarzi, S. M. Sajjadi-Jazi, B. Larijani, H. Hamedifar and M. Mahdavi, Sci. Rep., 2022, 12, 1–16 CrossRef PubMed.
- M. Y. Lobanov, N. S. Bogatyreva and O. V. Galzitskaya, Mol. Biol., 2008, 42, 623–628 CrossRef CAS.
- A. Bornot, C. Etchebest and A. G. De Brevern, Proteins: Struct., Funct., Bioinf., 2011, 79, 839–852 CrossRef CAS PubMed.
- C. Wang, D. Greene, L. Xiao, R. Qi and R. Luo, Front. Mol. Biosci., 2018, 4, 1–18 CrossRef.
- E. Wang, H. Sun, J. Wang, Z. Wang, H. Liu, J. Z. H. Zhang and T. Hou, Chem. Rev., 2019, 119, 9478–9508 CrossRef CAS PubMed.
- S. Genheden and U. Ryde, Expert Opin. Drug Discovery, 2015, 10, 449–461 CrossRef CAS PubMed.
- S. K. Mishra and J. Koča, J. Phys. Chem. B, 2018, 122, 8113–8121 CrossRef CAS PubMed.
- J. Kästner, H. H. Loeffler, S. K. Roberts, M. L. Martin-fernandez and M. D. Winn, J. Struct. Biol., 2009, 167, 117–128 CrossRef PubMed.
- S. Zhang, Y. Wang, L. Han, X. Fu, S. Wang, W. Li and W. Han, Front. Chem., 2021, 9, 1–13 CAS.
- S. Ahmed, M. C. Ali, R. A. Ruma, S. Mahmud, G. K. Paul, M. A. Saleh, M. M. Alshahrani, A. J. Obaidullah, S. K. Biswas, M. M. Rahman, M. M. Rahman and M. R. Islam, Molecules, 2022, 27, 1–19 Search PubMed.
- C. Barillari, J. Taylor, R. Viner and J. W. Essex, J. Am. Chem. Soc., 2007, 129, 2577–2587 CrossRef CAS PubMed.
- T. Vajda and A. Perczel, J. Pept. Sci., 2014, 20, 747–759 CrossRef CAS PubMed.
|
| This journal is © The Royal Society of Chemistry 2023 |
Click here to see how this site uses Cookies. View our privacy policy here.  Open Access Article
 *bc,
Alfinda Novi Kristanti
 bc,
Imam Siswantoad,
Baso Ilhamb,
Andika Pramudya Wardanaab and
Yoshiaki Takayae


![[thin space (1/6-em)]](https://www.rsc.org/images/entities/char_2009.gif)
![[thin space (1/6-em)]](https://www.rsc.org/images/entities/char_2009.gif)
![[thin space (1/6-em)]](https://www.rsc.org/images/entities/char_2009.gif)
![[thin space (1/6-em)]](https://www.rsc.org/images/entities/char_2009.gif)

![[double bond, length as m-dash]](https://www.rsc.org/images/entities/char_e001.gif) O) from PC1 by 92.39% during a simulation time of 100 ns. Furthermore, we analyzed the hydrogen occupation for each system (Table 2). Hydrogen bonds with an acceptable percentage of PHB ≥ 90% identify the strong category.36 Once again, occupation N412 shows a good hydrogen bond category with PHB equal to 90.88%. This finding reinforces our previous assumptions about residue N412 as a guide for the binding pattern of PC1-α-Glu. In another site, PC3-α-Glu showed a PHB value of 19.25% for residue N412 with a weak hydrogen bond category. Meanwhile, PC2-α-Glu did not show hydrogen bond criteria even though two bonds were recorded with residue R312 during a simulation time of 100 ns. It is because the two bonds have a tiny percentage of hydrogen bond occupation, which is <10%. This finding shows a correlation with the results of molecular docking (Fig. S2†). It might explain why PC2 has lower inhibitory activity than the other two pyranocoumarin derivatives. Therefore, the selection of functional groups greatly influences the binding orientation of a molecule.
O) from PC1 by 92.39% during a simulation time of 100 ns. Furthermore, we analyzed the hydrogen occupation for each system (Table 2). Hydrogen bonds with an acceptable percentage of PHB ≥ 90% identify the strong category.36 Once again, occupation N412 shows a good hydrogen bond category with PHB equal to 90.88%. This finding reinforces our previous assumptions about residue N412 as a guide for the binding pattern of PC1-α-Glu. In another site, PC3-α-Glu showed a PHB value of 19.25% for residue N412 with a weak hydrogen bond category. Meanwhile, PC2-α-Glu did not show hydrogen bond criteria even though two bonds were recorded with residue R312 during a simulation time of 100 ns. It is because the two bonds have a tiny percentage of hydrogen bond occupation, which is <10%. This finding shows a correlation with the results of molecular docking (Fig. S2†). It might explain why PC2 has lower inhibitory activity than the other two pyranocoumarin derivatives. Therefore, the selection of functional groups greatly influences the binding orientation of a molecule.

![[double bond, length as m-dash]](https://www.rsc.org/images/entities/char_e001.gif)
![[O with combining low line]](https://www.rsc.org/images/entities/char_004f_0332.gif) ⋯H–ND2(N412)
⋯H–ND2(N412)![[thin space (1/6-em)]](https://www.rsc.org/images/entities/char_2009.gif)
![[double bond, length as m-dash]](https://www.rsc.org/images/entities/char_e001.gif)
![[O with combining low line]](https://www.rsc.org/images/entities/char_004f_0332.gif) ⋯H–NH1(R312)
⋯H–NH1(R312)![[O with combining low line]](https://www.rsc.org/images/entities/char_004f_0332.gif) ⋯H–N(R312)
⋯H–N(R312)![[thin space (1/6-em)]](https://www.rsc.org/images/entities/char_2009.gif)
![[double bond, length as m-dash]](https://www.rsc.org/images/entities/char_e001.gif)
![[O with combining low line]](https://www.rsc.org/images/entities/char_004f_0332.gif) ⋯H-ND2(N412)
⋯H-ND2(N412)
![[thin space (1/6-em)]](https://www.rsc.org/images/entities/char_2009.gif) 100 ns simulation time: All surface area (top) and pocket surface area (bottom).
100 ns simulation time: All surface area (top) and pocket surface area (bottom).

