
 Open Access Article
 This Open Access Article is licensed under a Creative Commons Attribution-Non Commercial 3.0 Unported Licence
Dual fluorescence properties and enhanced thermal stability of SrSi2O2N2:Eu2+ phosphors by coupling with g-C3N4
Jinlong Wanga,
Hao Songa,
Peipei Dong*b,
Zihan Zhao a and
Yanjie Zhang*a
a and
Yanjie Zhang*a
aResearch Institute of Photonics, Dalian Polytechnic University, Dalian 116034, China. E-mail: zhang_yj@dlpu.edu.cn
bCollege (Institute) of Integrative Medicine, Dalian Medical University, Dalian 116044, China. E-mail: dongpeipei11@163.com
First published on 23rd February 2023
Abstract
Nowadays, considerable efforts have been extensively devoted to explore a general strategy for improving the color uniformity and thermal stability of phosphors, which is vital for its applications in health and comfort lighting. In this study, the SrSi2O2N2:Eu2+/g-C3N4 composites were successfully prepared via a facile and effective solid-state method to improve their photoluminescence properties and thermal stability. The coupling microstructure and chemical composition of the composites were demonstrated by high-resolution transmission electron microscopy (HRTEM) and EDS line-scanning analyses. Notably, the dual emissions at ∼460 nm (blue) and ∼520 nm (green) were observed for the SrSi2O2N2:Eu2+/g-C3N4 composite under near-ultraviolet (NUV) excitation, attributed to the g-C3N4 and 5d–4f transition of Eu2+ ions, respectively. The coupling structure will be beneficial to the color uniformity of the blue/green emitting light. Further, SrSi2O2N2:Eu2+/g-C3N4 composites exhibited a similar photoluminescence intensity compared with the SrSi2O2N2:Eu2+ phosphor even after thermal treatment at 500 °C for 2 h due to the protection of g-C3N4. The decreased decay time (1798.3 ns) of green emission for SSON/CN compared with SSON phosphor (1835.5 ns) indicated that the coupling structure suppressed the non-radiative transition and improved photoluminescence properties and thermal stability. This work provides a facile strategy to construct SrSi2O2N2:Eu2+/g-C3N4 composites with coupling structure for improved color uniformity and thermal stability.
1. Introduction
White light emitting diodes (wLEDs), as the next generation of solid-state lighting sources, have been intensely studied in recent years due to their distinctive characteristics including high brightness, low power consumption, and brilliant stability.1,2 The development of RGB (red, green, and blue) phosphors excited by near ultraviolet (NUV) LED chips has received much attention to achieve high-quality white light, which is highly corresponding to the requirement of health lighting. As the indispensable green component in wLEDs, Eu2+-activated nitrides, and oxynitride phosphors, for example SrSi2O2N2:Eu2+ green phosphors, have received close attention due to their high luminescent efficiency.3,4 However, the thermal stability and anti-aging properties of nitrides and oxynitrides phosphors are inhibited due to the tendency of Eu2+ oxidation at high temperatures and high humidity.5 In addition, the problems of reabsorption and color nonuniformity in the mixtures of tricolor phosphors limit their application in indoor lighting.3 Therefore, it is an urgent task to explore a general strategy to improve both the color uniformity and thermal stability of phosphors.The strategy of coating the particles with inorganic layers (e.g. SiO2, C, SiC, Al2O3) can effectively improve the thermal stability of phosphors.5–10 Yan et al. have prepared thermally stable SrSi2O2N2:Eu2+ green phosphors by coating a thin carbon layer on the phosphor surface particles by the chemical vapor deposition (CVD) method.7 Recently, major innovations in g-C3N4-based materials have emerged in large numbers for their excellent properties such as high photocatalytic activity, nontoxic nature, intense luminescence emission, and diverse access.11,12 Actually, the research of carbon nitride (C3N4) can be traced back to 1834 when Liebig first obtained CN polymer and named it “melon”.13 Since then, the graphitic carbon nitride (g-C3N4) was reported by Franklin in 1922 through the thermal decomposition of mercuric thiocyanate.14 In 1989, Liu and Cohen predicted the presence of ultra-hard material β-C3N4 by C replacing Si in the structure of β-Si3N4, theoretically.15 In 1996, Teter and Hemley predicted five different phases of C3N4, which included α-C3N4, β-C3N4, c-C3N4, p-C3N4, and g-C3N4.16 g-C3N4 has been widely used in several domains, such as photocatalysis,17–19 solar energy conversion,20,21 electrocatalysis,22 illumination display23,24 and biomedicine.25 g-C3N4 can also be used as an optical material due to its unique energy-level structure, which is related to the transition between the conduction band and valence band formed by the lone pair (LP) states of nitrogen.26 Furthermore, g-C3N4, which improves the color uniformity of composite phosphors with an increased blue component in a coupled manner is widely available and non-dependent on the doping of rare earth ions. It can reduce the consumption of rare earth's finite resources on the planet for applying in white LEDs. Remarkably, tunable wavelength emission can be achieved by controlling the polymerization temperature of g-C3N4.26,27 Further, the modified g-C3N4 phosphors indicate considerable potential for practical applications in optical materials due to their environmental friendliness, high quantum efficiency, and simple synthesis process.28,29
Thus, g-C3N4 is expected to improve the optical properties of the phosphor and keep it from thermal attack. Some researchers have combined g-C3N4 with long-afterglow phosphors, such as SrAl2O4, CaAl2O4, and Sr2MgSi2O7, to achieve the photocatalytic activity in the dark environment and realize the purification of pollutants around the clock.30–35 The combination of Ag3PO4/g-C3N4/SrAl2O4:Eu2+, Dy3+ prepared by Lei et al. shows high photoactivity both under visible light irradiation and in complete darkness, which simultaneously enhances the photocatalytic activity for the phosphor-enriched composite when compared to pure g-C3N4.32 There are two types of strategies to obtain composite phosphors based on g-C3N4. One of the strategies intends to improve the photoluminescence performance of the phosphor by compounding the phosphor with g-C3N4.36–40 The Y3Al5O12:Ce3+ phosphor with a thin g-C3N4 layer has been reported and exhibits the improved emission intensity, thermal stability, and quantum efficiency.39 The purpose of another strategy is achieving white light by combing g-C3N4 with other red emission materials, such as Eu3+:Y2O3, Cu3Cl(SR)2, NaLuF4:Eu3+, Ba2MgWO6:Eu3+, and Eu3+-doped molybdate phosphor, considering the blue emission at ∼460 nm of g-C3N4 under near-UV excitation.41–47 Guo et al. synthesized the new g-C3N4 composite red luminescent Cu3Cl(SR)2 composite phosphor with white light,39 demonstrating that g-C3N4 is an excellent candidate material for improving phosphor performance and applying in NUV excited wLEDs.
In this work, a series of SrSi2O2N2:Eu2+/g-C3N4 composite phosphors have been prepared directly by facile thermal polymerization of melamine. The coupling structure and chemical composition of SrSi2O2N2:Eu2+/g-C3N4 composite were confirmed by HRTEM with EDS elemental analysis and FT-IR spectroscopy. The results from UV-vis diffuse reflectance spectra (DRS) indicated that the absorption capacity of the composite is improved and the optical band gap energy is reduced from 3.2 to 2.76 eV compared to those in SrSi2O2N2:Eu2+. The shift (from 370 to 448 nm) of the maximum excitation wavelength for SrSi2O2N2:Eu2+/g-C3N4 composite monitoring at 525 nm was found due to the decrease of the optical band gap. Under NUV excitation, the SrSi2O2N2:Eu2+/g-C3N4 composite exhibited the blue emission peak at ∼460 nm and green emission peak at 525 nm corresponding to g-C3N4 and SrSi2O2N2:Eu2+, respectively. Further, it can be found that the thermal stability of the composite was improved and reached the maximum at a 5% molar mass ratio of g-C3N4. The mechanism of the improved photoluminescence properties and thermal stability is attributed to the electron transfer from g-C3N4 to Eu2+ ions through the g-C3N4-SrSi2O2N2 interface.
2. Experimental section
2.1 Materials and synthesis
The high-purity commercial chemical reagents used in this experiment are melamine (99%, A. R., Aladdin, China), SrCO3 (99.9%, A. R., Aladdin, China), SiO2 (99%, Sinopharm, China), α-Si3N4 (SN-E10, UBE Industries, Tokyo), and Eu2O3 (99.9%, Aladdin, China). All chemicals were of analytical grade or the highest purity available and were used without further purifications.SrSi2O2N2:Eu2+ phosphors were first prepared by a two-step solid-state reaction reported in our previous work.48 A facile thermal polycondensation method was utilized to synthesize the SrSi2O2N2:Eu2+/g-C3N4 composite phosphors and pure g-C3N4. The raw materials of melamine and SrSi2O2N2:Eu2+ phosphors were weighed stoichiometrically with various molar ratios and mixed thoroughly in an agate mortar. Then, the mixtures were transferred into an alumina crucible and calcined at 550 °C for 4 h in a tubular furnace under 3% H2/N2 reducing conditions. The yielded samples were denoted as X composites (X = 7/3, 3/2, 1/1, 2/3, 99/1, 97/3, 19/1, 9/1), where X refers to the molar ratio of SrSi2O2N2:Eu2+/g-C3N4. The yellowish fine powders were obtained after cooling down to room temperature and milled.
2.2 Characterizations
The crystal structure of the prepared powders was analyzed by X-ray diffractometer (XRD, Shimadzu, XRD-7000s) with Cu Kα radiation (λ = 1.54 Å) operating at 40 kV and 20 mA via diffraction patterns collected in the range from 10° to 70° at scanning speed of 5° per min. The particle morphology and structure of materials, as well as elemental distribution, were analyzed using a JEOL transmission electron microscope (TEM) equipped with an energy dispersion X-ray detector (EDX, X-Max 50, Oxford) and energy dispersive spectroscopy (EDS, JEM-2100F, JEOL). The microstructure of the composite phosphor was observed using a high-resolution transmission electron microscope (HRTEM) with a field emission tube in an accelerating voltage of 200 kV. Furthermore, the cross-section of the composite phosphor particles was performed by EDX line scanning in TEM. The specimens were dispersed into ethanol solution under ultrasonication for 20 min and a few drops were deposited on the copper grid before microscopic investigation. Fourier transform infrared spectroscopy (FTIR, Thermo Fisher Nicolet IS50) spectra were acquired to identify chemical groups in the samples in the range of 500–4000 cm−1. UV-vis diffuse reflectance spectra (UV-vis DRS) of the composites were obtained using a UV-3600 spectrophotometer (Cary 100, Shimadzu, Japan). The spectra of photoluminescence (PL) and photoluminescence excitation (PLE) were measured on a fluorescence spectrophotometer (Hitachi, F-7000) at room temperature with an excitation source of a 200 W xeon lamp under a scanning rate of 240 nm min−1. The emission spectra cover the wavelength range of 400–650 nm under the excitation wavelength of 370 nm with an interval of 0.2 nm, and the slit width of excitation and emission was set to 1.0 nm. The decay time of SrSi2O2N2:Eu2+, SrSi2O2N2:Eu2+ after 500 °C thermal treatment (SrSi2O2N2:Eu2+-500) for 2 h, SrSi2O2N2:Eu2+/g-C3N4, and SrSi2O2N2:Eu2+/g-C3N4 after 500 °C thermal treatment for 2 h (SrSi2O2N2:Eu2+/g-C3N4-500) were measured under room temperature at the excitation and monitor wavelengths of 375 nm and 525 nm, respectively, on a lifetime spectrofluorometer (FLS980, Edinburgh Instruments) with a picosecond pulsed laser (EPL) of 375 nm. The thermal quenching was measured on Edinburgh Instruments (FLS 1000) at an excitation wavelength of 370 nm, with detection temperatures and ranges of 25–300 °C and 440–630 nm, respectively.3. Results and discussion
3.1 Phase identification and microstructure analysis
Fig. 1 presents XRD patterns of pristine g-C3N4, SrSi2O2N2:Eu2+, SrSi2O2N2/g-C3N4 composites (denoted as SSON/CN) and the standard data on the SrSi2O2N2 crystal (JCPDS no. 14-8213). All the peaks of the as-synthesized SrSi2O2N2 could be indexed using the reference card (JCPDS no. 14-8213), demonstrating that SrSi2O2N2:Eu2+ phosphor prepared by the two-step method exhibited the pure phase of SrSi2O2N2. In Fig. 1, the intense peaks at 13.0° and 27.54° can be clearly observed for the diffraction of pristine g-C3N4, which is attributed to the (100) and (002) plane of the graphitic structure, respectively.33 The diffraction peak at 13.0° is assigned to the intraplanar stacking of tri-s-triazine unit structures, while the major diffraction peak at 27.54° belongs to the interplanar packing of the conjugated aromatic systems of g-C3N4.32 It can be clearly found from Fig. 1 that the diffraction peaks of SSON/CN composites are well-indexed to the SrSi2O2N2 crystal (JCPDS no. 14-8213), but no diffraction peaks of g-C3N4 were observed for SSON/CN composites even in the 2θ range of 25°-29° (right side, Fig. 1).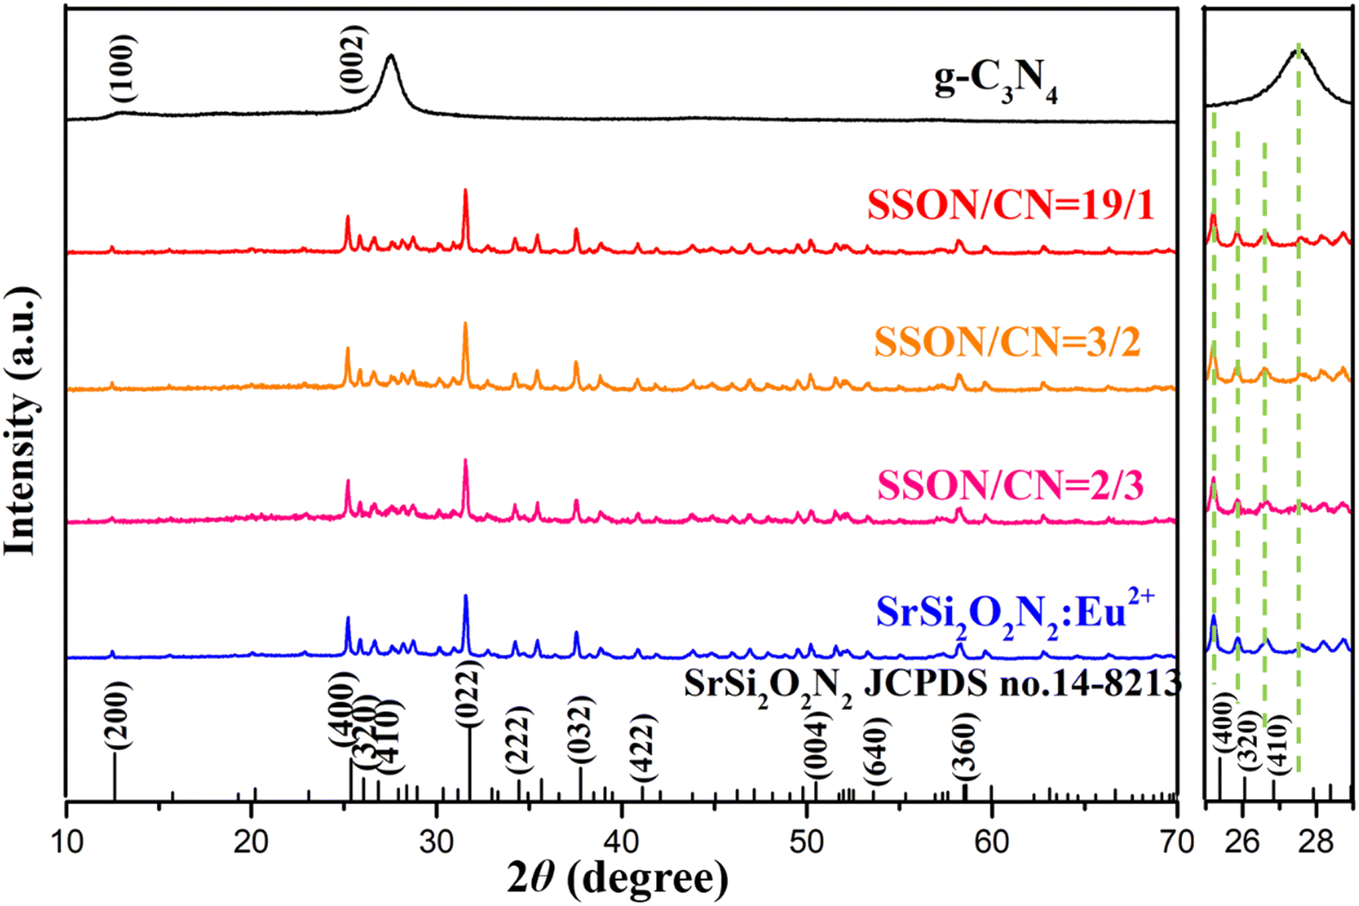 | ||
| Fig. 1 XRD patterns of as-prepared pure g-C3N4, SrSi2O2N2:Eu2+, SrSi2O2N2:Eu2+/g-C3N4 composites (SSON/CN) with different molar ratios of SSON/CN and the standard data of SrSi2O2N2 (JCPDS no. 14-8213). | ||
In order to investigate the g-C3N4 phase and microstructure, HRTEM images with elemental mapping of SSON/CN composites were performed and the data are shown in Fig. 2 and 3, respectively. Fig. 2a presents a TEM image of the SSON/CN composite prepared by molar ratio = 2/3, which clearly indicates the covering microstructure of the g-C3N4 layer on the surface of SrSi2O2N2:Eu2+ crystals with the average thickness in the range of 30–40 nm. In Fig. 2b, the lattice fringes of g-C3N4 with d spacings of 0.28 nm are shown for the SSON/CN sample, corresponding to the (102) crystal plane of g-C3N4 in the standard card data (JCPDS: 87-1526).29 The corresponding energy dispersive X-ray spectroscopy (EDS) elemental mapping was also employed to further investigate the distribution of C, N, O, Si, Sr, and Eu elements for SrSi2O2N2:Eu2+/g-C3N4 composites. As shown in Fig. 3, all the elements of C, N, O, Si, Sr, and Eu appeared in the EDS spectrum and they were uniformly distributed throughout the phosphor particles.
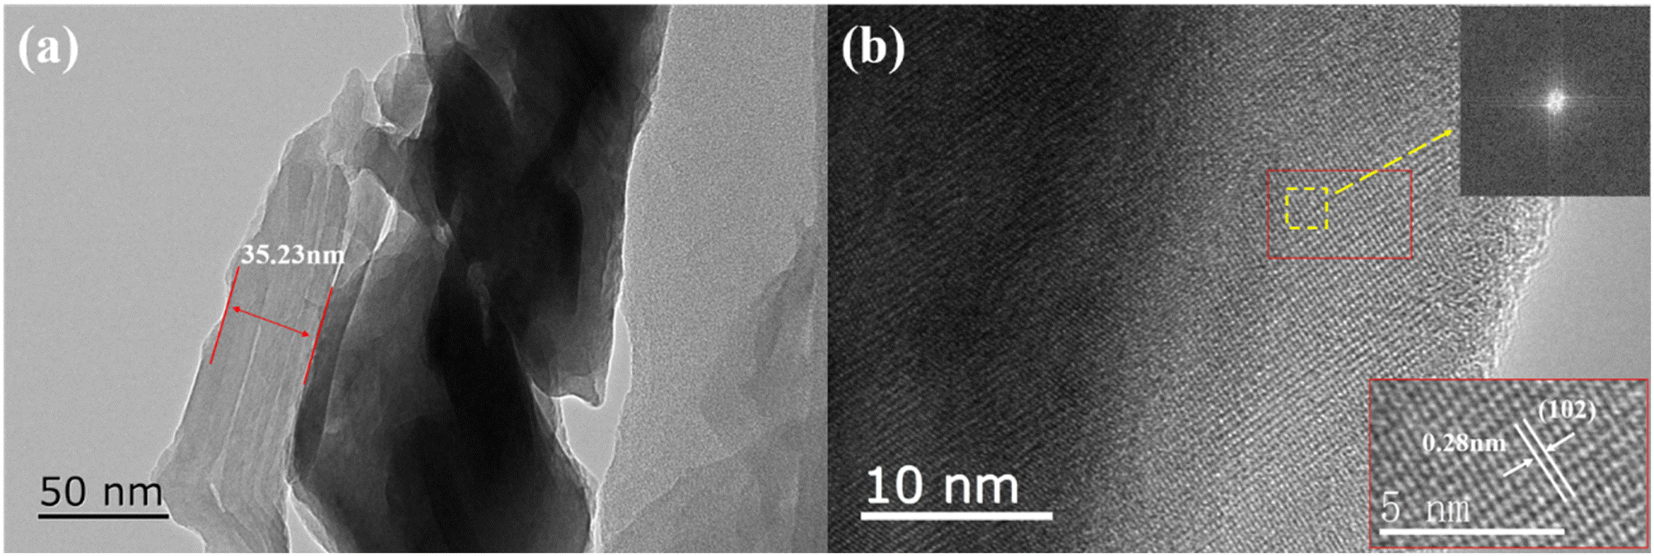 | ||
| Fig. 2 (a) TEM image of SSON/CN sample prepared by molar ratio = 2/3. (b) HRTEM image of SSON/CN composite. The inset shows the FFT transform of the yellow region and the enlarged HRTEM image of the red area. | ||
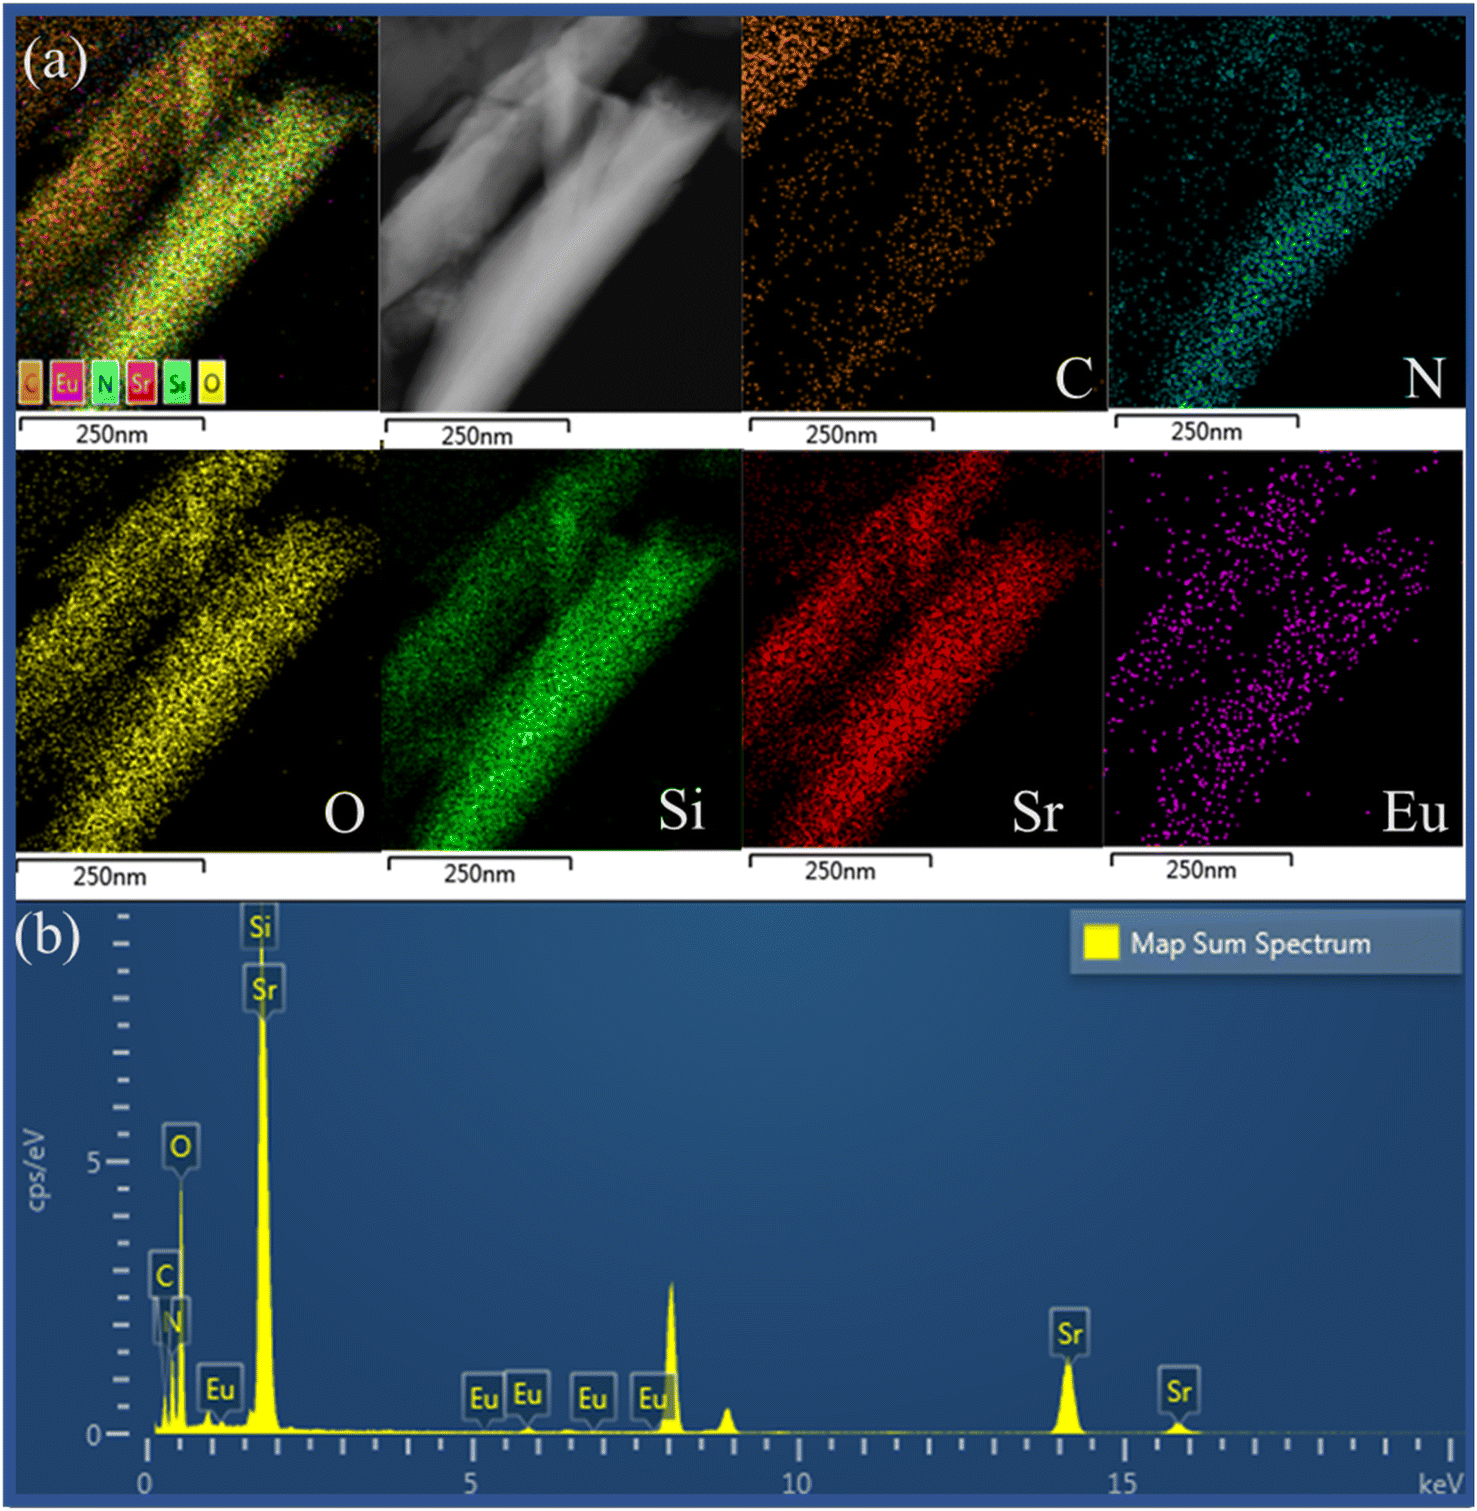 | ||
| Fig. 3 (a) EDS mappings images of C, N, O, Si, Sr, Eu elements, and (b) EDS spectrum for SSON/CN sample prepared by molar ratio = 2/3. | ||
Further, the elemental line scanning analysis was performed on the cross-section of SSON/CN particles and the arrow in the inset indicated the scanning direction in Fig. 4. Along the scanning direction (inset in Fig. 4), the signals of C, N, O, Si, Sr, and Eu elements can be found and increase to the maximum at the center of the particles. Therefore, the coupling structure of SSON/CN composites was demonstrated through HRTEM and EDS analysis, which will have a significant impact on the photoluminescence properties of the samples.
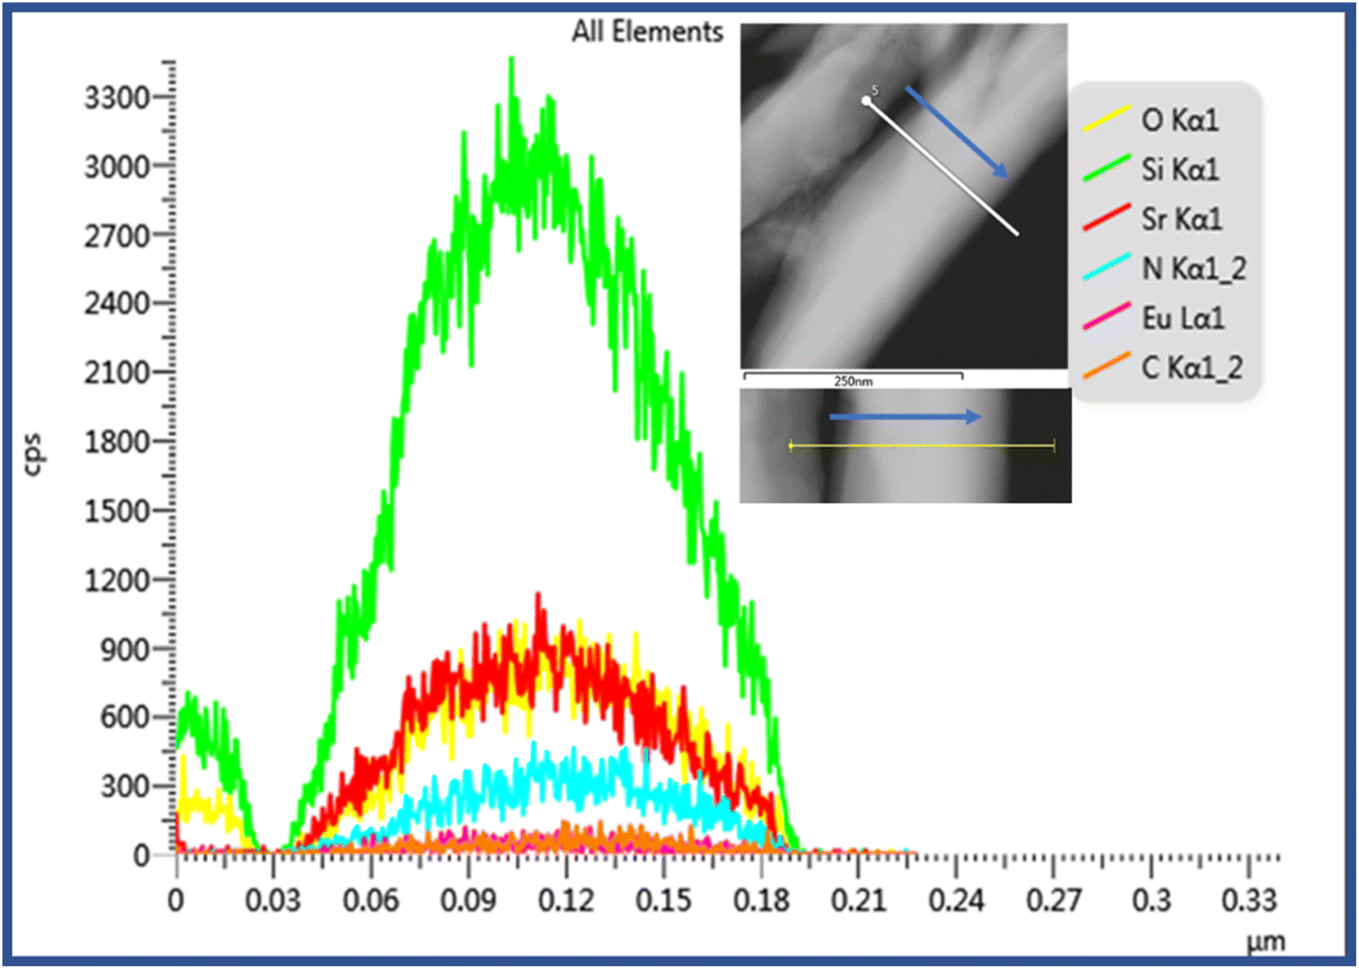 | ||
| Fig. 4 EDS line-scanning analysis of SSON/CN sample with molar ratio = 2/3. | ||
The combination of C3N4 with SrSi2O2N2 was also investigated from FT-IR transmission spectra of g-C3N4, SrSi2O2N2:Eu2+/g-C3N4, and SrSi2O2N2, as shown in Fig. 5. Fig. 5a presents the typical FT-IR spectrum of g-C3N4 with a broad absorption band localized at about 3000–3500 cm−1 attributed to the uncondensed terminal amino groups (–NH2 or ![[double bond, length as m-dash]](https://www.rsc.org/images/entities/char_e001.gif) NH groups).36 In the wavenumber range from 1200 to 1650 cm−1, the absorption bands at 1564 and 1634 cm−1 are assigned to the stretching vibrations of CN, while the bands at 1456, 1402, 1317, and 1244 cm−1 correspond to aromatic C–N stretching. In addition, the absorption peak at 807 cm−1 belongs to the triazine ring mode, attributed to the condensed CN heterocycle.39,50 In Fig. 5c, the absorption peaks at 1024, 904 cm−1, and 502 cm−1 are assigned to two Sr (Eu)–O (N) and Si–O (N) bonds in the SrSi2O2N2:Eu2+ compound, respectively.51 The peaks specified as the stretching and bending vibrations of O–H are located at about 3436 and 1630 cm−1, respectively. Obviously, the FTIR spectrum of the SSON/CN sample with molar ratio = 2/3 shown in Fig. 5b exhibits the characteristic absorption peaks of SrSi2O2N2 and C3N4. A broad absorption band at approximately 3170 cm−1 is attributed to the typical stretching vibration of O–H groups on the surface of the SrSi2O2N2:Eu2+/g-C3N4 composites.
NH groups).36 In the wavenumber range from 1200 to 1650 cm−1, the absorption bands at 1564 and 1634 cm−1 are assigned to the stretching vibrations of CN, while the bands at 1456, 1402, 1317, and 1244 cm−1 correspond to aromatic C–N stretching. In addition, the absorption peak at 807 cm−1 belongs to the triazine ring mode, attributed to the condensed CN heterocycle.39,50 In Fig. 5c, the absorption peaks at 1024, 904 cm−1, and 502 cm−1 are assigned to two Sr (Eu)–O (N) and Si–O (N) bonds in the SrSi2O2N2:Eu2+ compound, respectively.51 The peaks specified as the stretching and bending vibrations of O–H are located at about 3436 and 1630 cm−1, respectively. Obviously, the FTIR spectrum of the SSON/CN sample with molar ratio = 2/3 shown in Fig. 5b exhibits the characteristic absorption peaks of SrSi2O2N2 and C3N4. A broad absorption band at approximately 3170 cm−1 is attributed to the typical stretching vibration of O–H groups on the surface of the SrSi2O2N2:Eu2+/g-C3N4 composites.
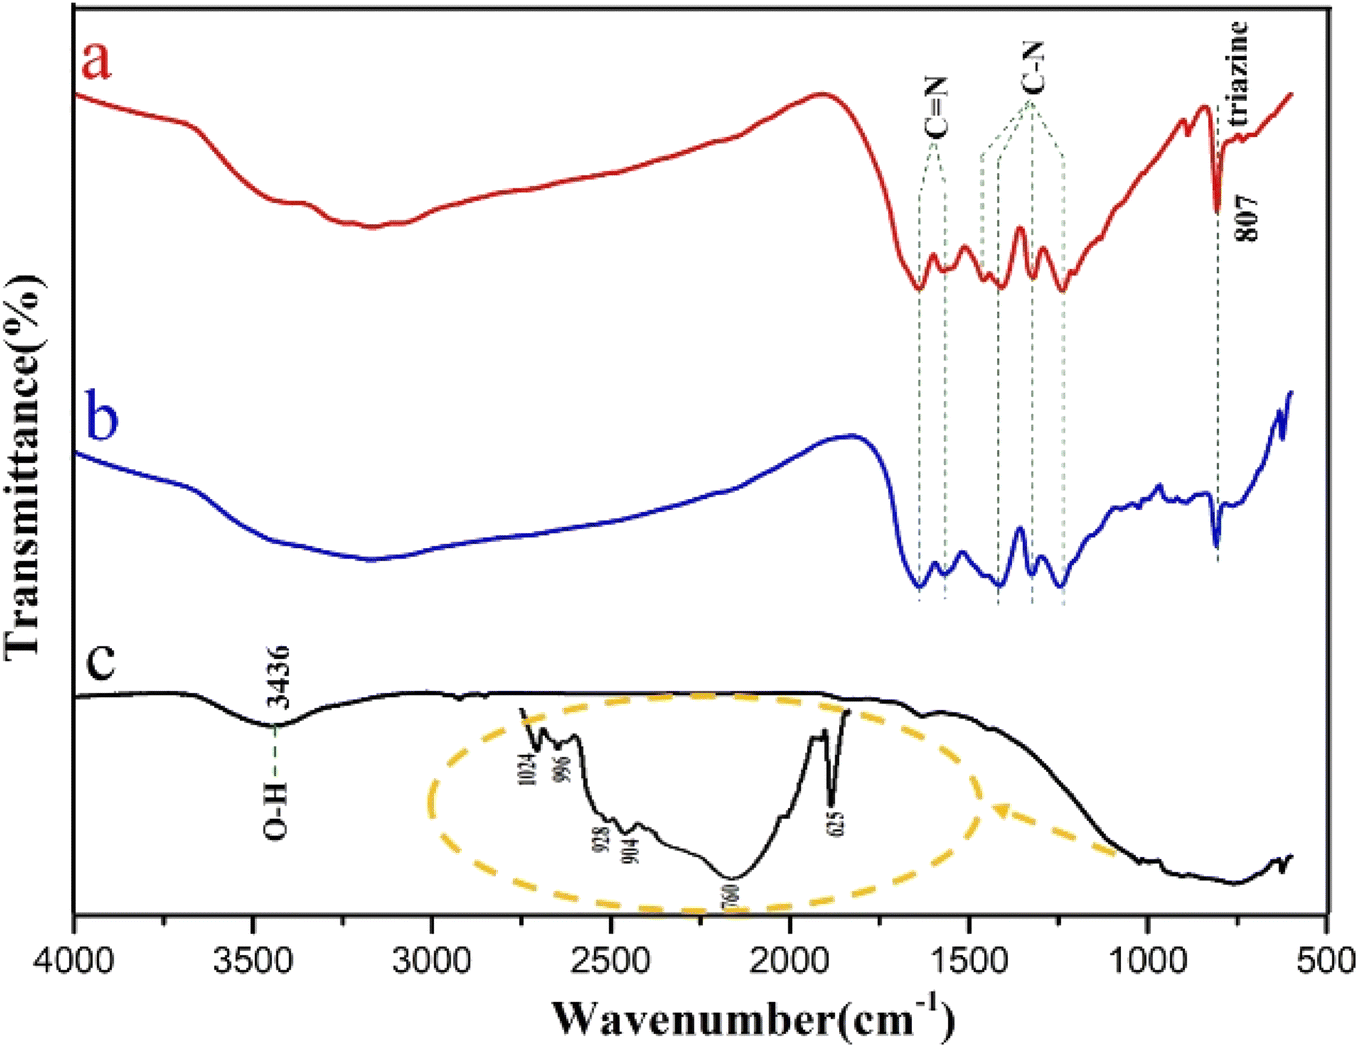 | ||
| Fig. 5 FT-IR spectra of (a) pure g-C3N4, (b) SSON/CN sample with molar ratio = 2/3, and (c) SrSi2O2N2:Eu2+. | ||
3.2 Photoluminescence properties
It is necessary to evaluate the optical absorption of the samples before investigating the photoluminescence properties. Fig. 6a shows the UV-vis diffuse reflectance spectra (DRS) of g-C3N4, SrSi2O2N2:Eu2+, and SSON/CN with strong absorption in the range of 200–450 nm. The obvious blueshift of the absorption edge from ∼527 nm to ∼471 nm can be found for SSON/CN composite phosphor when compared with SrSi2O2N2:Eu2+. The band gaps of g-C3N4, SrSi2O2N2:Eu2+, and SSON/CN were calculated using the Taucplot function:32| (αhv)n = K(hv − Eg) |
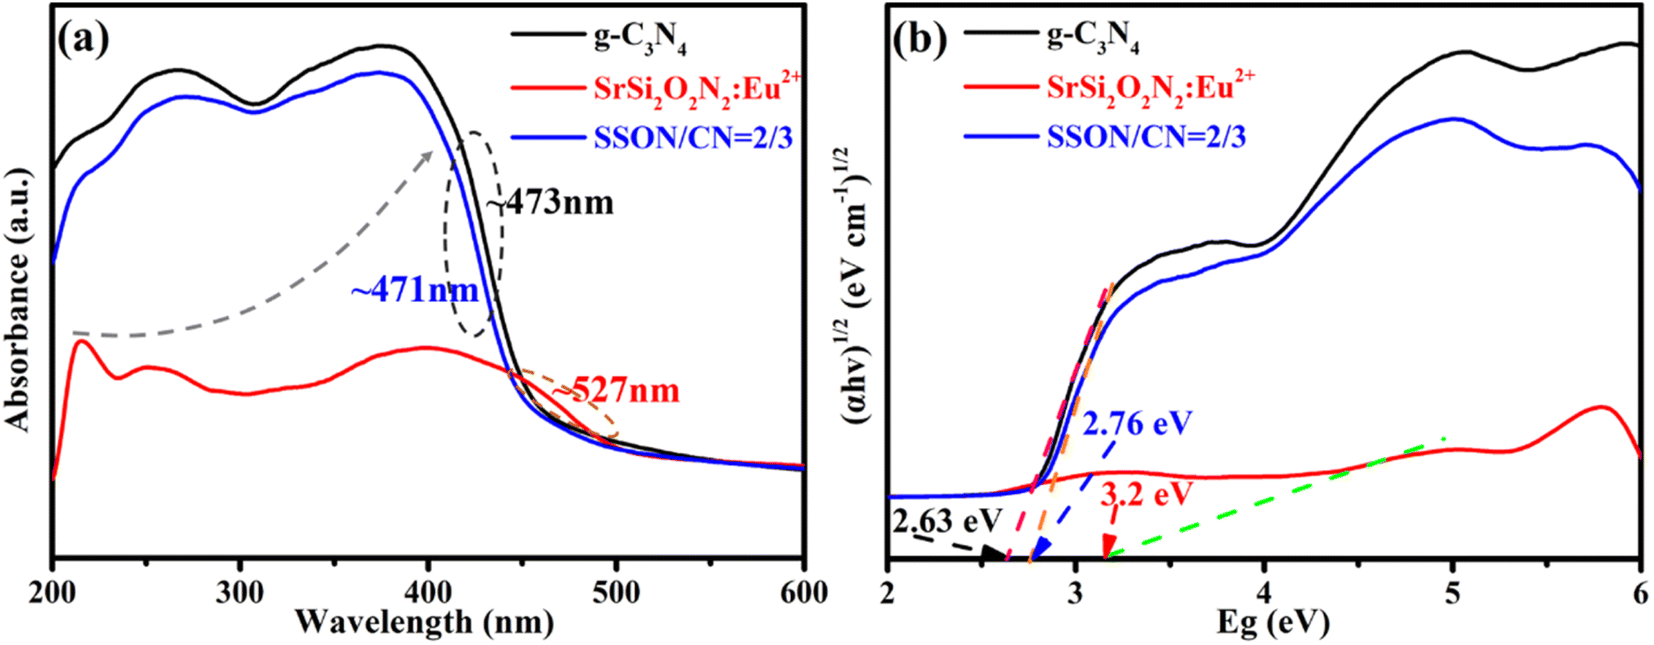 | ||
| Fig. 6 (a) UV-vis diffuse reflectance spectra (DRS) and (b) Plots of (αhv)1/2 versus hv employed to determine the band gaps of g-C3N4 and SSON/CN composites phosphor. The molar ratio of SSON/CN was 2/3. | ||
Fig. 7 portrays the photoluminescence emission (PL) excited at 370 nm and the corresponding excitation (PLE) spectra of SrSi2O2N2:Eu2+, g-C3N4, and SSON/CN composites with the molar ratio of 2/3. As shown in Fig. 7a, the SrSi2O2N2:Eu2+ phosphor exhibits a single broad green emission band peak at 525 nm with full width at half maxima (FWHM) of 61 nm, which is consistent with earlier reports of SrSi2O2N2:Eu2+ phosphors.48 The broad emission band in the range of 470–600 nm is associated with the transition from the lowest excited state of 4f65d1 electronic configuration to the ground state 4f7(8S7/2) of Eu2+ ions. Interestingly, g-C3N4 shows a broad blue emission band covering 400–550 nm and peaking at approximately 458 nm and the FWHM of around 65 nm under the excitation of 370 nm, corresponding to near band edge emission (NBE) due to the direct bandgap transition in g-C3N4.44 The optical properties of carbon nitride materials are mainly influenced by band-to-band transitions and band to tail transitions of lone pair (LP) states of intra-tri-s-triazine and inter-tri-s-triazine nitrogen, while the location of the LP band depends on the bond structure around the nitrogen.26 As for SSON/CN composites, the PL spectra of SSON/CN shown in Fig. 7a exhibit blue-green dual emission peaks at 457 nm and 506 nm via Gaussian fitting under a single excitation wavelength (370 nm). A slight redshift from 458 nm to 463 nm can be observed for the SSON/CN composites compared with the emission of pure g-C3N4. The PL excitation spectrum of g-C3N4 in Fig. 7b displays a broad excitation band in the range of 250 to 430 nm. The strongest excitation bands are located at ∼278 and 370 nm, which are attributed to π–π* transitions and δ–π* transitions, respectively.26 Typically, the broad excitation peak of SrSi2O2N2:Eu2+ phosphor covers the UV-visible region of 275–450 nm and the predominant excitation band appears at ∼370 nm, relating to the parity allowed transitions from the 4f7(8S7/2) to 4f65d1 of the Eu2+ ions. The PLE spectrum consists of structural bands associated with the parity-allowed transition between the ground state and the excited states of the configuration of Eu2+ ions.49 The PLE spectrum of the SSON/CN composites was recorded by monitoring the emission peak at 460 nm and 525 nm. The excitation band of SSON/CN composites monitored at 460 nm is similar to that from pure g-C3N4. Notably, it can be seen that the edge of the excitation band when monitoring the green emission at 525 nm dramatically extends to ∼500 nm and shows the maximum excitation peak at ∼450 nm, which is in accordance with the results of the UV-vis diffuse reflectance spectra shown in Fig. 6.
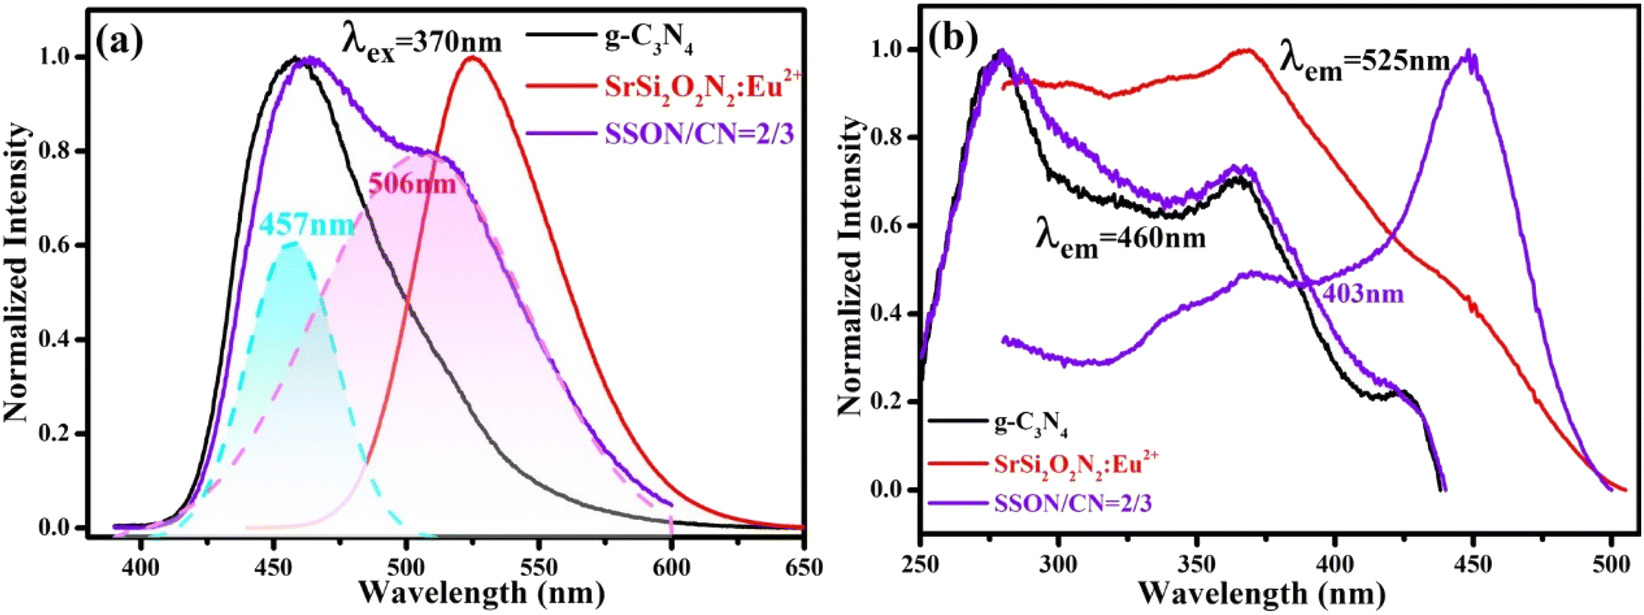 | ||
| Fig. 7 Normalized PL emission (a) and excitation (b) spectra of SrSi2O2N2:Eu2+, g-C3N4, and SSON/CN with molar ratio 2/3. Dashed lines of (a) are Gaussian fitting of SSON/CN PL peak under 370 nm excitation. | ||
A series of SSON/CN composites with different molar ratios (SSON/CN molar ratio = 7/3, 3/2, 1/1, and 2/3) was prepared by thermal polymerization at 550 °C to investigate the photoluminescence properties under 370 nm excitation. It can be clearly noted from the PL emission spectra (Fig. 8a) of the composites under excitation of 370 nm that the samples display broad emission peaks in the range of 400–600 nm with a blue emission peak at ∼460 nm and green emission peak at 525 nm corresponding to g-C3N4 and SrSi2O2N2:Eu2+, respectively. Along with the increase of g-C3N4 content in SSON/CN composites, the intensity of blue emission at ∼460 nm increases and the CIE coordinates shift from (0.2339, 0.5416) to (0.1751, 0.3121) with the adjustable molar ratios, as shown in the inset in Fig. 8a. Fig. 8b displays the relative intensity variation of blue emission, green emission and the corresponding green/blue ratio (G/B) with SSON/CN molar ratios. Obviously, the different green/blue ratios (G/B) from 0.5 to 4.5 can be facilely achieved by adjusting the SSON/CN molar ratios, which is helpful for its application in white light LEDs.
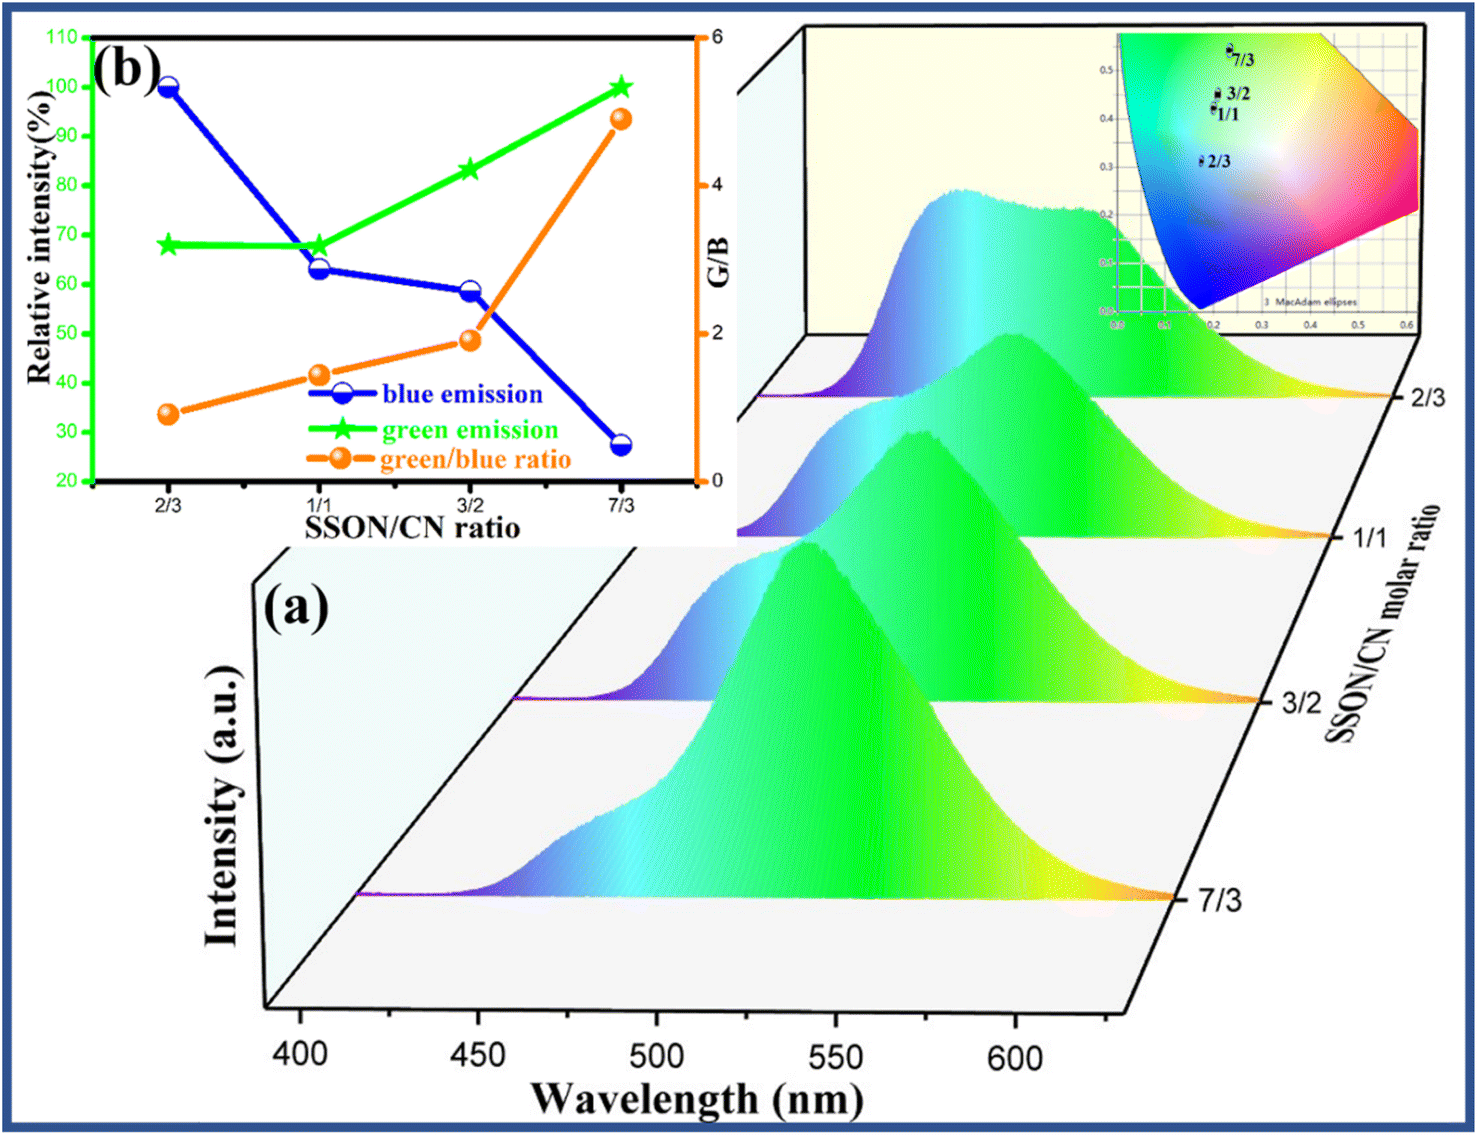 | ||
| Fig. 8 (a) PL emission spectra of SSON/CN composites with different molar ratios (SSON/CN molar ratio = 7/3, 3/2, 1/1, and 2/3) prepared by thermal polymerization at 550 °C under excitation of 370 nm. Inset shows the CIE coordinates of the SSON/CN composite phosphors with different molar ratios. (b) The relative intensity variation of blue emission, green emission, and the corresponding green/blue ratio (G/B) with SSON/CN molar ratio. | ||
As shown in Fig. 9, the tunable proportion of blue and green emission can be facilely acquired by varying the excitation wavelengths (280 nm, 320 nm, 360 nm, 400 nm, 440 nm, and 460 nm, respectively). Obviously, the G/B ratios of the emission for SrSi2O2N2/g-C3N4 composite with the molar ratio at = 2/3 can be adjusted to ∼1 when employing the excitation wavelength of ∼400 nm. Only the green emission peak for the as-prepared composite can be observed under excitation of 440 nm and 460 nm, due to the absence of absorption of g-C3N4 in this wavelength range. As shown in the inset of Fig. 9b, the coordinates in the CIE diagram shift from the blue region (0.1538, 0.1892) to the green region (0.2552, 0.6099) as the excitation wavelength increases. Thus, the dual emission of blue and green light can be achieved simultaneously in SSON/CN by manipulating the excitation wavelength.
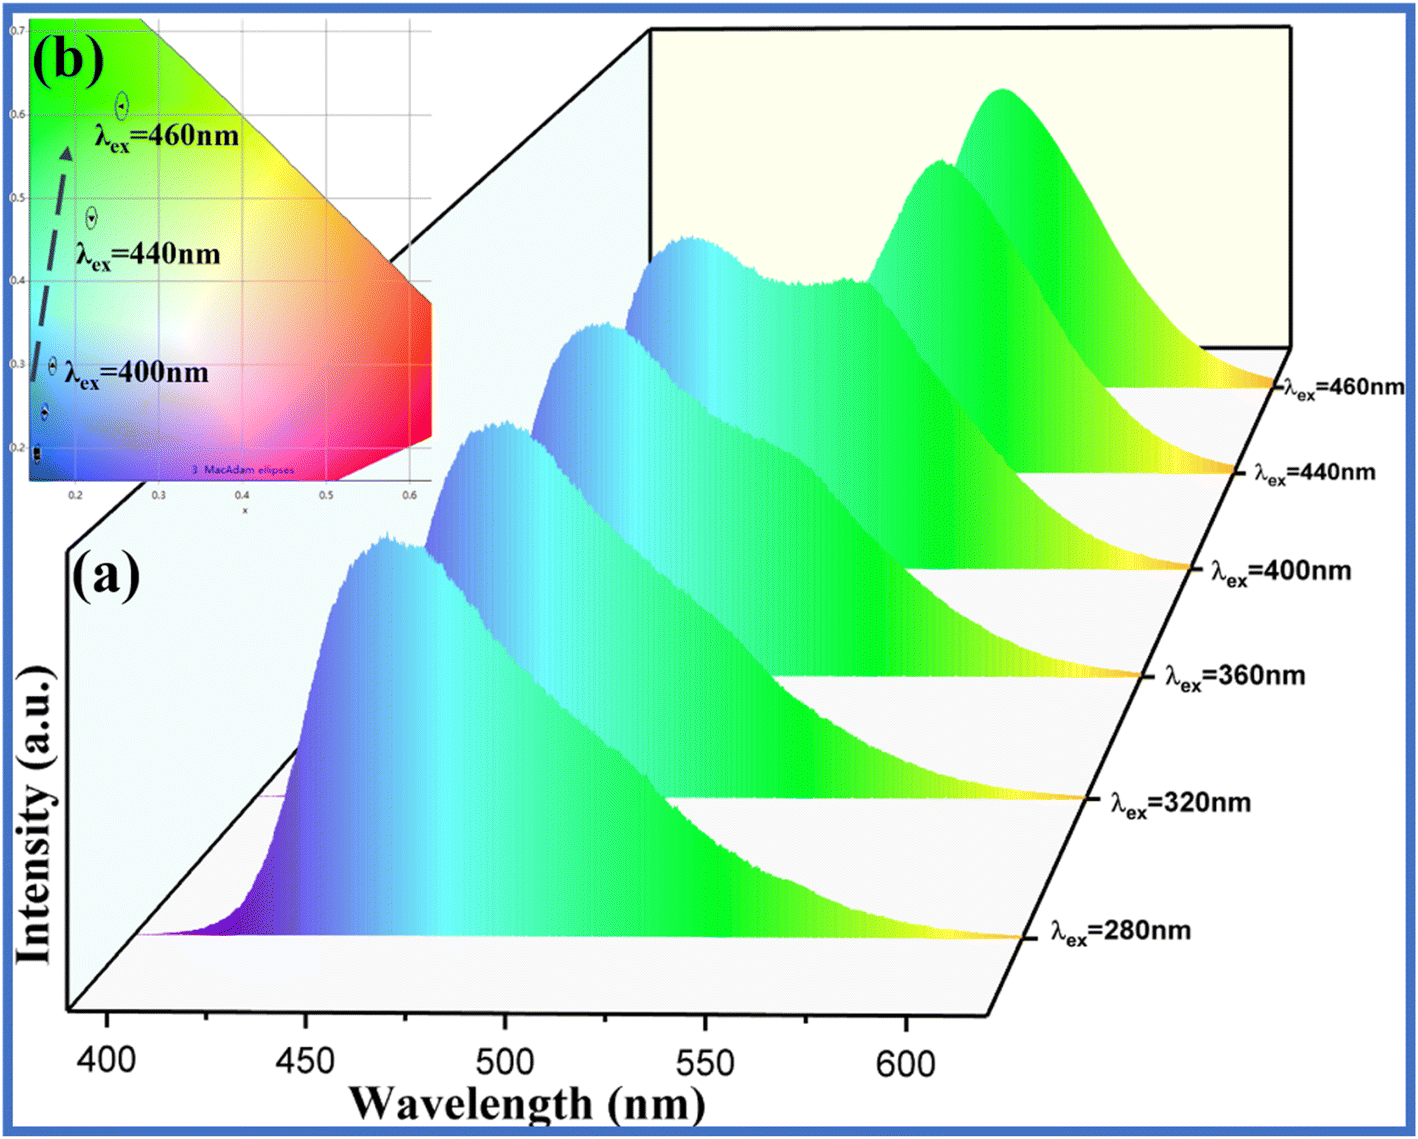 | ||
| Fig. 9 (a) PL emission spectra of the sample prepared by SSON/CN molar ratio at = 2/3 under excitation of 280 nm, 320 nm, 360 nm, 400 nm, 440 nm, and 460 nm. (b) The coordinates of SSON/CN molar ratio at = 2/3 under different excitation wavelengths in CIE. | ||
3.3 Thermal stability of SrSi2O2N2:Eu2+/g-C3N4 composites
The thermal stability of phosphors plays a key role in the application of LED devices. Fig. 10a displays PL relative emission intensities of SrSi2O2N2:Eu2+, SSON/CN composites with different molar ratios (SSON/CN molar ratio = 99/1, 97/3, 19/1, and 9/1, respectively) and the corresponding samples after calcination at 500 °C for 2 h under the excitation of 370 nm. Interestingly, SSON/CN composites with a molar ratio of 19/1 show abnormal fluorescence enhancement by 15.9% after calcination at 500 °C for 2 h, which is totally different from the decreased tendency of pure SSON phosphor after thermal treatment. In addition, the thermal quenching in Fig. 10b further demonstrates that the thermal stability of the SSON/CN composite is improved (molar ratio = 19/1). The activation energy is calculated using the Arrhenius formula.39where I0 and IT represent the emission intensity at room temperature and at a given temperature, respectively. A, K, and ΔE represent the constant coefficient, Boltzmann's constant, and activation energy for thermal quenching, respectively. The graph of ln[(I0/IT) − 1] versus 1/KT was plotted and is shown in the inset of Fig. 10b. The ΔE was calculated as 0.203 and 0.219 eV for SrSi2O2N2:Eu2+ and SSON/CN, respectively. Fig. 10c and d show the temperature dependence of the emission spectra of SrSi2O2N2:Eu2+ and SSON/CN composite, respectively. The property parameters of SrSi2O2N2:Eu2+ and SSON/CN composites, upon thermal quenching, activation energy, and heating to 500 °C for 2 h and then dropping to room temperature, are shown in Table 1. The above observations indicated that the thermal stability can be effectively improved through coupling with g-C3N4. Thus, the coupling structure keeps the phosphor from thermal attack and subsequently improves the efficient electron transfer from g-C3N4 to Eu2+ ions.
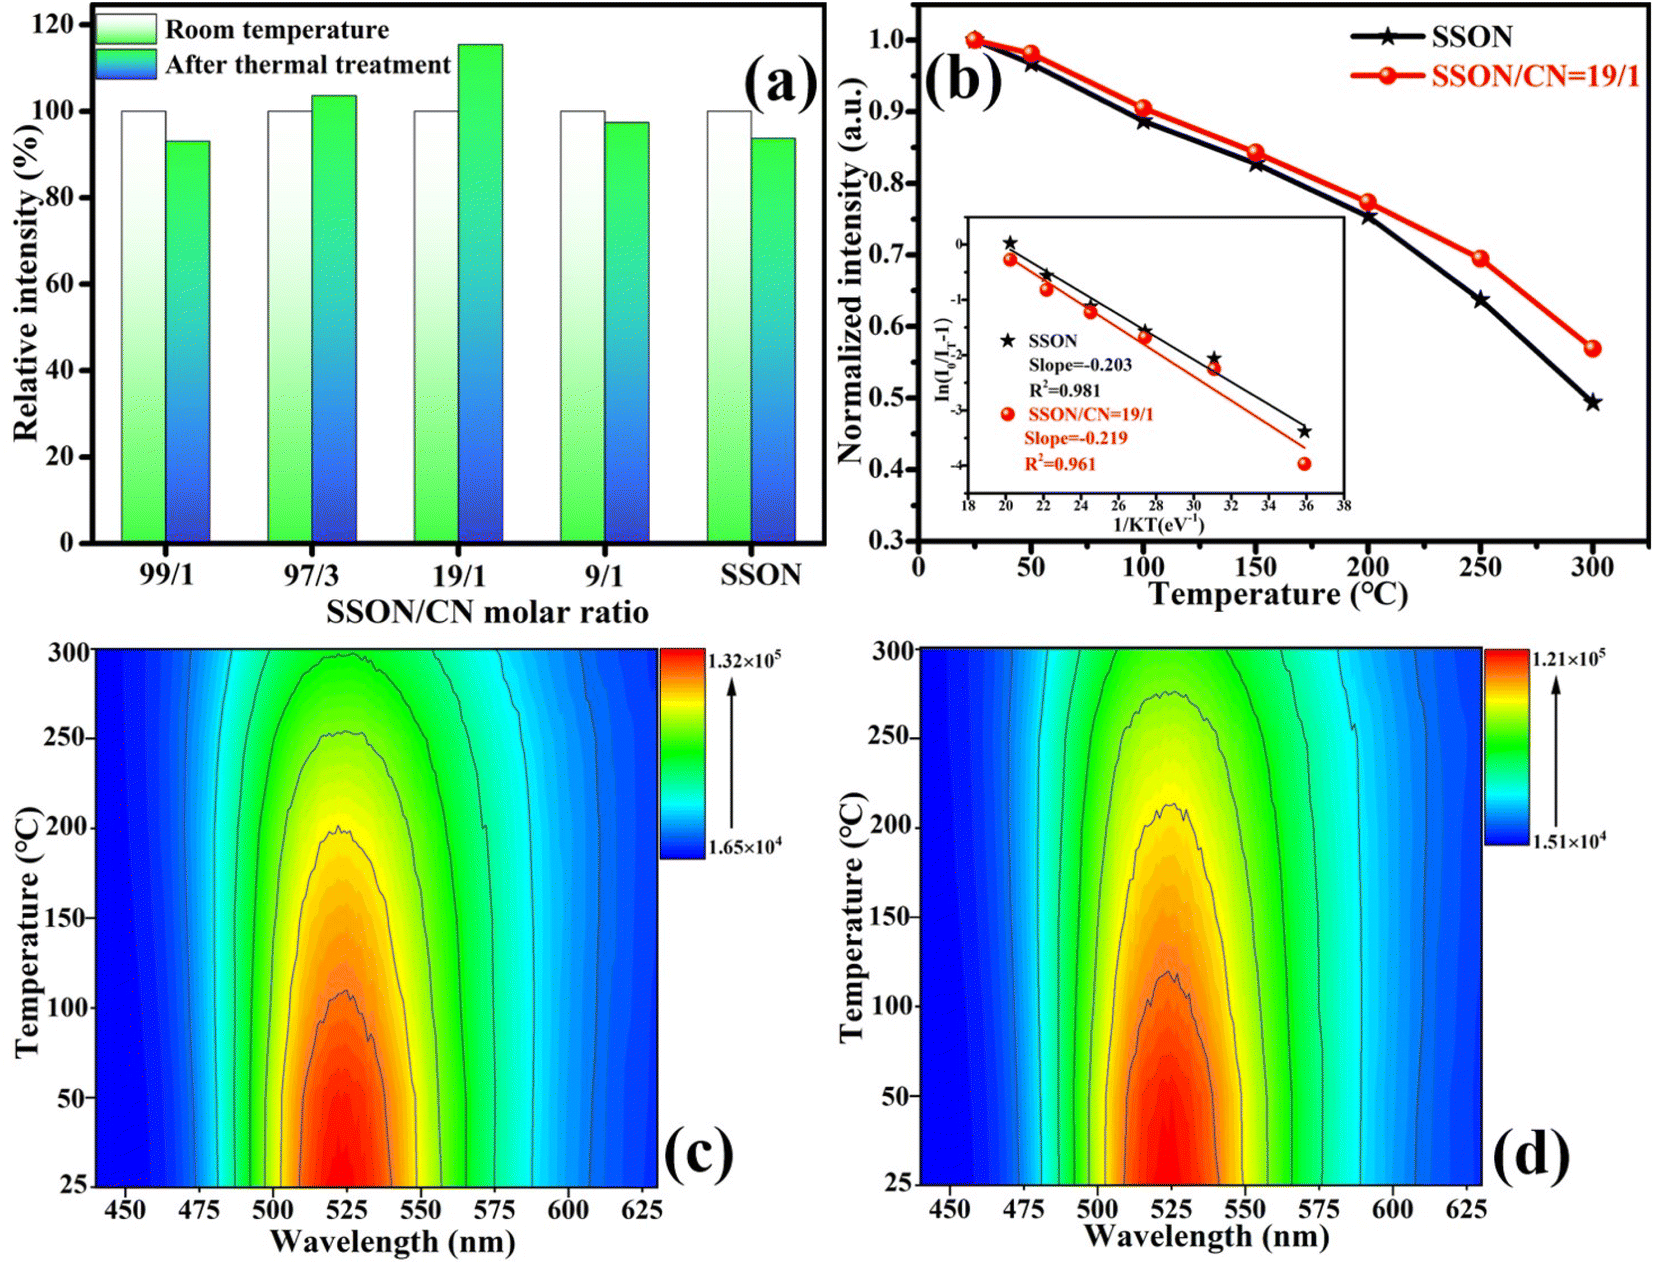 | ||
| Fig. 10 (a) PL intensities of SrSi2O2N2:Eu2+, SSON/CN composites with different molar ratios (SSON/CN molar ratio = 99/1, 97/3, 19/1, and 9/1, respectively) and the corresponding samples after calcination at 500 °C for 2 h under excitation of 370 nm (All the measurements were conducted at room temperature). (b) Normalized PL intensities of SrSi2O2N2:Eu2+ and SSON/CN molar ratio = 19/1 as a function of temperature. The inset of (b) presents the Arrhenius plot to calculate the activation energy for thermal quenching of SrSi2O2N2:Eu2+ and SSON/CN molar ratio = 19/1. Temperature dependence of emission spectra of (c) SrSi2O2N2:Eu2+ and (d) SSON/CN molar ratio = 19/1. | ||
| Phosphors | Excitation wavelength (nm) | Thermal quenching (remain) | Activation energy (eV) | Heated to 500 °C for 2 h | Ref. |
|---|---|---|---|---|---|
| SrSi2O2N2:Eu2+ | 370 | 74% (200 °C) | 0.20 | Decrease | This work |
| SSON/CN | 370 | 78% (200 °C) | 0.22 | Increase | This work |
| SrSi2O2N2:Eu2+ | 380 | 85% (150 °C) | — | — | 52 |
| Sr0.98Si2O2N2:0.02Eu2+ | 450 | — | — | Decrease | 53 |
| SrSi2O2N2:Eu2+ | 440 | 71% (180 °C) | 0.13 | — | 54 |
The room-temperature decay curves were monitored at 525 nm under excitation of 375 nm for SrSi2O2N2:Eu2+, SSON/CN composite (molar ratio = 19/1), and the corresponding samples after 500 °C thermal treatment for 2 h, as shown in Fig. 11. All decay curves can be well fitted with double-exponential to equation [I = I0 + A1![[thin space (1/6-em)]](https://www.rsc.org/images/entities/char_2009.gif) exp(−t/τ1) + A2exp(−t/τ2)], where I0 is the initial luminescence intensity and I is the one at time t, A1, and A2 are the two constants of the function, τ1, and τ2 are the fast and slow components of the luminescent lifetimes, respectively.36 Consequently, the average lifetime was calculated using the formula of τ* = (A1τ12 + A2τ22)/(A1τ1 + A2τ2).36,39 The average decay lifetimes were calculated as 1835.5, 1801.2, 1798.3, and 1820.5 ns for SrSi2O2N2:Eu2+, SrSi2O2N2:Eu2+-500, SSON/CN, and SSON/CN-500, respectively. Obviously, SSON/CN exhibits a decreased decay time (1798.3 ns) compared with SSON phosphor (1835.5 ns), indicating that the coupling structure suppressed the non-radiative transition and improved the photoluminescence properties.
exp(−t/τ1) + A2exp(−t/τ2)], where I0 is the initial luminescence intensity and I is the one at time t, A1, and A2 are the two constants of the function, τ1, and τ2 are the fast and slow components of the luminescent lifetimes, respectively.36 Consequently, the average lifetime was calculated using the formula of τ* = (A1τ12 + A2τ22)/(A1τ1 + A2τ2).36,39 The average decay lifetimes were calculated as 1835.5, 1801.2, 1798.3, and 1820.5 ns for SrSi2O2N2:Eu2+, SrSi2O2N2:Eu2+-500, SSON/CN, and SSON/CN-500, respectively. Obviously, SSON/CN exhibits a decreased decay time (1798.3 ns) compared with SSON phosphor (1835.5 ns), indicating that the coupling structure suppressed the non-radiative transition and improved the photoluminescence properties.
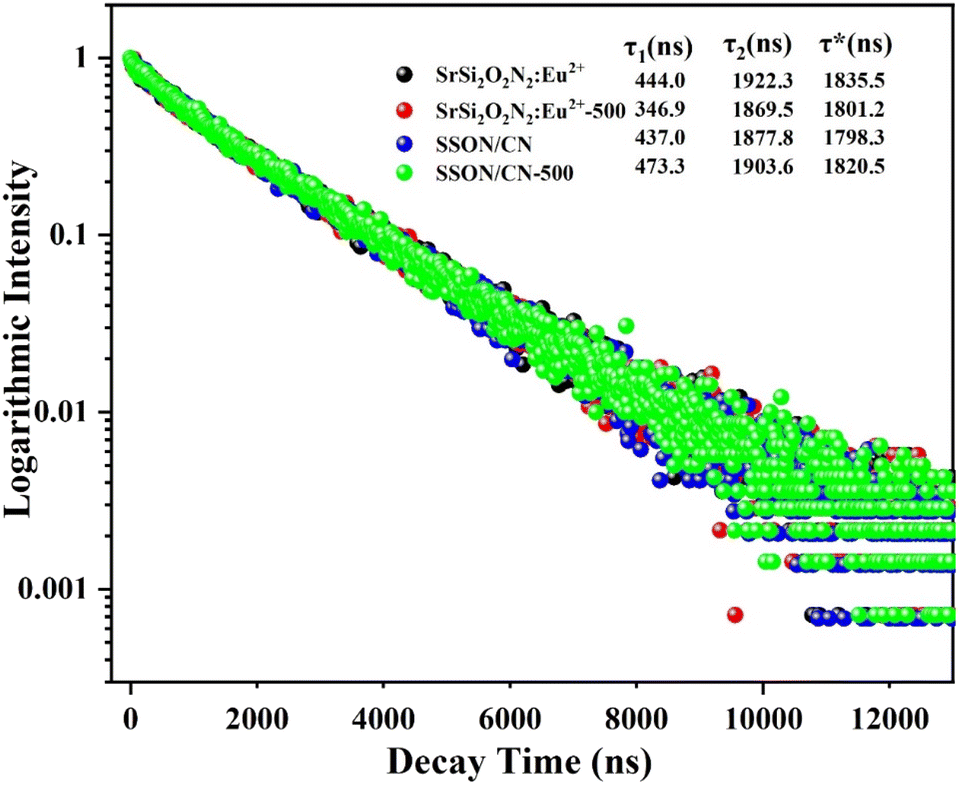 | ||
| Fig. 11 Decay curves of SrSi2O2N2:Eu2+, SSON/CN composite (molar ratio = 19/1) and the corresponding samples after thermal treatment at 500 °C for 2 h. The samples were excited at 375 nm and monitored at 525 nm at room temperature. | ||
3.4 Formation mechanism of SSON/CN composites
Fig. 12 illustrates the schematic diagram for the process for SSON/CN composites with dual fluorescence properties and enhanced thermal stability. Firstly, the SSON/CN composites were formed by the coupling of SrSi2O2N2:Eu2+ particles with stratified g-C3N4 through melamine thermal polycondensation. Under the excitation of 370 nm, SSON/CN composites exhibit dual photoluminescence emission peaks at 460 nm and 525 nm, assigned to g-C3N4 and 5d–4f transition of Eu2+, respectively. The PL intensity and decay time of the as-prepared SSON/CN composite with SSON/CN molar ratio of 19/1 composite decrease slightly compared to that of SrSi2O2N2:Eu2+ phosphor because the g-C3N4 layer can absorb the excitation light and facilitate the electron–hole recombination inside the layer. Notably, the PL intensity of the SSON/CN composite with SSON/CN molar ratio of 19/1 was increased by 15.9% after calcination at 500 °C for 2 h because of the coupling between SrSi2O2N2 and g-C3N4. Simultaneously, the photo-generated carriers (electron–hole) during the thermal treatment process can be transferred to the luminescent center of Eu2+ ions in the SrSi2O2N2 lattice through the interface of g-C3N4–SrSi2O2N2, demonstrated by the transient spectroscopy techniques (Fig. 11). Thus, the formation of the coupling structure of g-C3N4 coated on the surface of SrSi2O2N2:Eu2+ finally facilitated the color uniformity and improved thermal stability.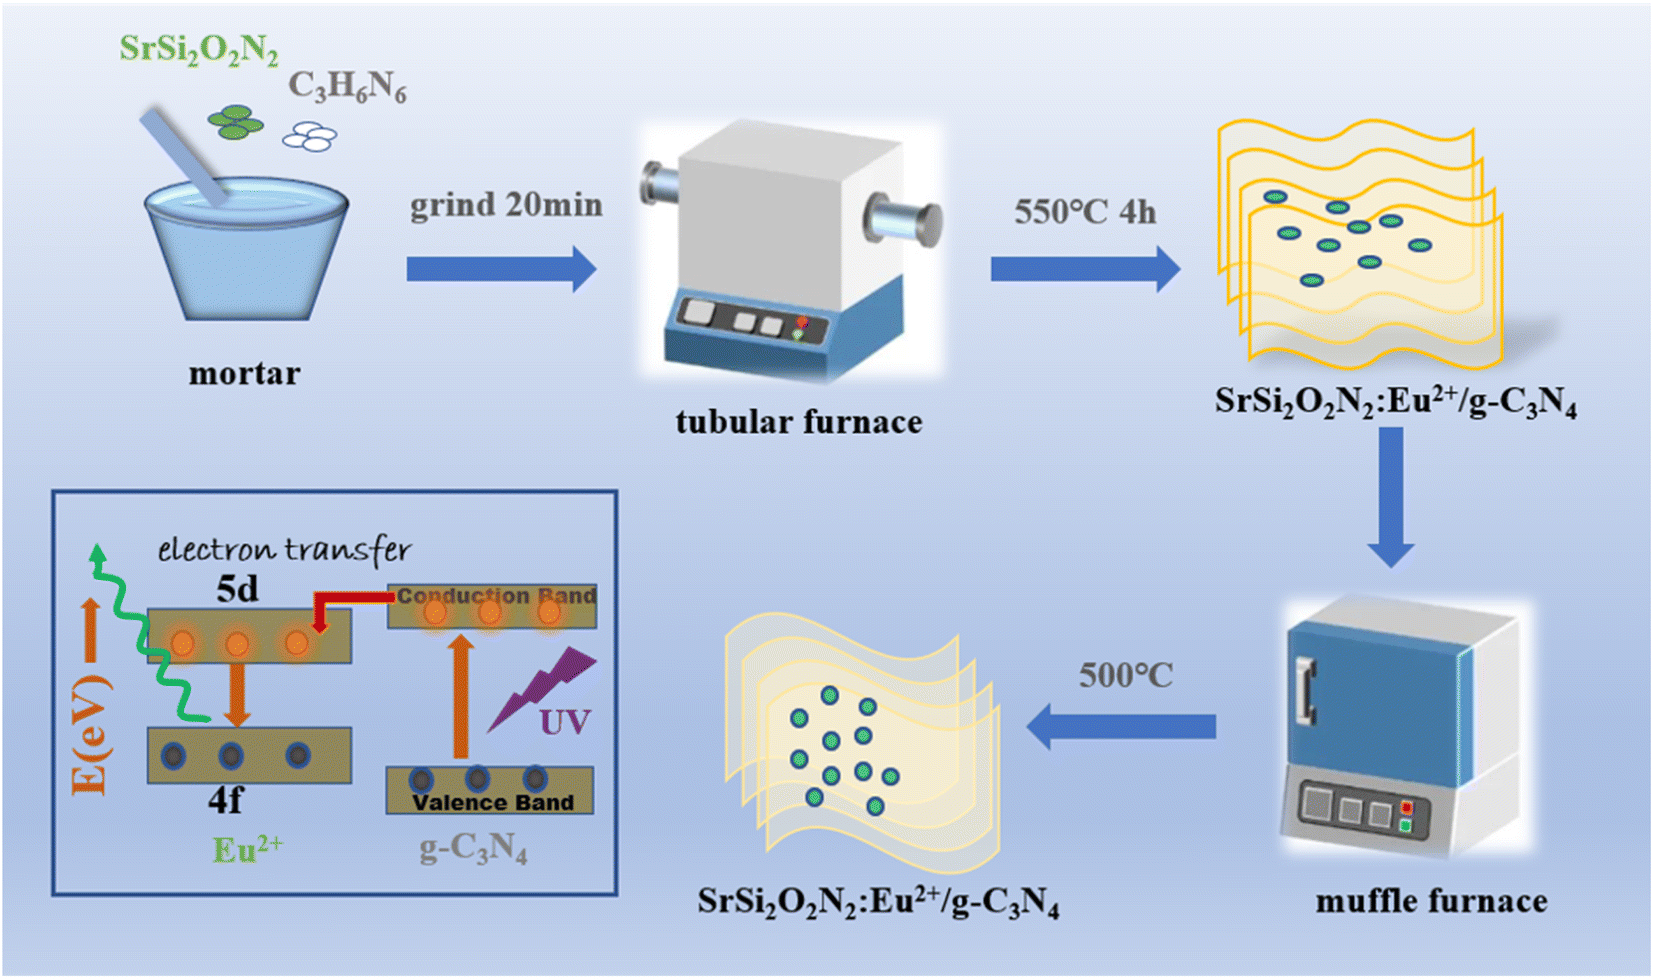 | ||
| Fig. 12 Schematic diagram of the process for SSON/CN composites with dual fluorescence properties and enhanced thermal stability. | ||
4. Conclusions
In summary, a series of SSON/CN composites were successfully synthesized by a facile thermal polymerization of melamine. The coupling structure of g-C3N4 coated on the surface of SrSi2O2N2:Eu2+ in the SSON/CN composite was confirmed by HRTEM with EDS analysis, which could have an essential impact on the color uniformity of the emitting light. The absorption spectra showed that the absorption ability of the composite was increased and the optical band gap energy was dropped from 3.2 eV to 2.76 eV when compared to that in SrSi2O2N2:Eu2+, which results in the redshift of the optimal excitation wavelength from 370 nm to 448 nm. The relative intensity of the blue-green emission can be controlled to improve the color uniformity of the SSON/CN composite by tuning different SSON/CN molar ratios and the excitation wavelength. The various green/blue emission ratios (G/B) from 0.5 to 4.5 can be obtained by the adjustment of SSON/CN molar ratios. Meanwhile, the SSON/CN composite exhibited higher thermal stability compared with the original SrSi2O2N2:Eu2+ phosphor from the thermal quenching results. The above results indicated that the preparation of composite phosphors is simple and effective, and has the potential to be extended to other phosphors for improving thermal stability. This work provides a simple and effective strategy to improve the color uniformity and thermal stability of nitride phosphor by constructing the coupling structure in SrSi2O2N2:Eu2+/g-C3N4 composites.Conflicts of interest
There are no conflicts to declare.Acknowledgements
The work was financially supported by the Shanxi Provincial Key Research and Development Project (202102130501002); the General Project of Liaoning Provincial Education Department (No. LZ2020042 and J2020067) and the Open Fund of Shanxi Province Key Laboratory of Oral Diseases Prevention and New Materials (KF2020-03).References
- S. Reineke, F. Lindner, G. Schwartz, N. Seidler, K. Walzer, B. Lüssem and K. Leo, Nature, 2009, 459, 234–238 CrossRef CAS PubMed.
- S. Nakamura, T. Mukai and M. Senoh, Appl. Phys. Lett., 1994, 64(13), 1687–1689 CrossRef CAS.
- S. Xu, Y. Zhang, X. Wu, J. Wang, B. Li and J. Yu, J. Alloys Compd., 2021, 875, 160076 CrossRef CAS.
- C. Cai, W. Xie, L. Hao, X. Xu and S. Agathopoulos, Mater. Sci. Eng. B, 2012, 177, 635–638 CrossRef CAS.
- D. Wu, L. Fu, S. He, F. Xu, L. Liu, L. Yao, F. Du, J. Peng and X. Ye, Ceram. Int., 2020, 46, 25382–25391 CrossRef CAS.
- J. Zhuang, Z. Xia, H. Liu, Z. Zhang and L. Liao, Appl. Surf. Sci., 2011, 257(9), 4350–4353 CrossRef CAS.
- R.-H. Yan, H. Ding, L. Gao, D.-Y. Chen, L.-W. Yin, A.-L. Xu, H.-L. Lv, X. Xu, L.-C. Ju and L.-J. Yin, Mater. Chem. Phys., 2020, 256, 123759 CrossRef CAS.
- L.-J. Yin, J. Dong, Y. Wang, B. Zhang, Z.-Y. Zhou, X. Jian, M. Wu, X. Xu, J. R. van Ommen and H. T. (Bert) Hintzen, J. Phys. Chem. C, 2016, 120, 2355–2361 CrossRef CAS.
- G. Feng, W. Jiang, J. Liu, C. Li, Q. Zhang, L. Miao and Q. Wu, Ceram. Int., 2018, 44, 8435–8439 CrossRef CAS.
- Z. Chen, Y. Yan, J. Liu, Y. Yin, H. Wen, G. Liao, C. Wu, J. Zao, D. Liu, H. Tian, C. Zhang and S. Li, J. Alloys Compd., 2009, 478(1–2), 679–683 CrossRef CAS.
- M. Groenewolt and M. Antonietti, Adv. Mater., 2005, 17, 1789–1792 CrossRef CAS.
- X. Wang, K. Maeda, A. Thomas, K. Takanabe, G. Xin, J. M. Carlsson, K. Domen and M. Antonietti, Nat. Mater., 2009, 8, 76–80 CrossRef CAS PubMed.
- J. Liebig, Analyse der Harnsäure, Ann. Pharm., 1834, 10, 10 Search PubMed.
- E. C. Franklin, The ammino carbonic acids, J. Am. Chem. Soc., 1922, 44, 486–509 CrossRef CAS.
- A. Y. Liu and M. L. Cohen, Science, 1989, 245, 841–842 CrossRef CAS PubMed.
- D. M. Teter and R. J. Hemley, Low-compressibility carbon nitrides, Science, 1996, 271, 53–55 CrossRef CAS.
- S. Cao, J. Low, J. Yu and M. Jaroniec, Adv. Mater., 2015, 27, 2150–2176 CrossRef CAS PubMed.
- Q. Hao, G. Jia, W. Wei, A. Vinu, Y. Wang, H. Arandiyan and B.-J. Ni, Nano Res., 2020, 13, 18–37 CrossRef CAS.
- S. Lv, et al., Int. J. Hydrogen Energy, 2021, 47(100), 42136–42149 CrossRef.
- X. Chen, Q. Liu, Q. Wu, P. Du, J. Zhu, S. Dai and S. Yang, Adv. Funct. Mater., 2016, 26, 1719–1728 CrossRef CAS.
- W.-W. Liu, Y.-C. Liu, C.-Y. Cui, S.-T. Niu, W.-J. Niu, M.-C. Liu, M.-J. Liu, B. Gu, L.-Y. Zhang, K. Zhao, F. Ran and Y.-L. Chueh, Mater. Today Energy, 2021, 21, 100782 CrossRef CAS.
- J. Zhang, G. Zhang, X. Chen, S. Lin, L. Möhlmann, G. Dołęga, G. Lipner, M. Antonietti, S. Blechert and X. Wang, Angew. Chem., Int. Ed., 2012, 51, 3183–3187 CrossRef CAS PubMed.
- W. Liu, S. Xu, S. Guan, R. Liang, M. Wei, D. G. Evans and X. Duan, Adv. Mater., 2018, 30, 1704376 CrossRef PubMed.
- L. He, M. Fei, J. Chen, Y. Tian, Y. Jiang, Y. Huang, K. Xu, J. Hu, Z. Zhao, Q. Zhang, H. Ni and L. Chen, Mater. Today, 2019, 22, 76–84 CrossRef CAS.
- M.-H. Chan, R.-S. Liu and M. Hsiao, Nanoscale, 2019, 11, 14993–15003 RSC.
- Z. Gan, Y. Shan, J. Chen, Q. Gui, Q. Zhang, S. Nie and X. Wu, Nano Res., 2016, 9, 1801–1812 CrossRef CAS.
- Y. Zhang, Q. Pan, G. Chai, M. Liang, G. Dong, Q. Zhang and J. Qiu, Sci. Rep., 2013, 3, 1943 CrossRef PubMed.
- T. Chen, C. Chen, Q. Liu, Z. Zhang and X. Fang, RSC Adv., 2017, 7, 51702–51710 RSC.
- H. Li, F.-Q. Shao, H. Huang, J.-J. Feng and A.-J. Wang, Sens. Actuators, B, 2016, 226, 506–511 CrossRef CAS.
- Y. Xiong, J. Zhao, Z. Zheng, F. Yi, X. Tang, D. jin and M. Jin, J. Mater. Sci.: Mater. Electron., 2021, 32, 7271–7284 CrossRef CAS.
- C. Zhou, P. Zhan, J. Zhao, X. Tang, W. Liu, M. Jin and X. Wang, Ceram. Int., 2020, 46, 27884–27891 CrossRef CAS.
- L. Lei, D. Wang, Y. Kang, Y. de Rancourt de Mimérand, X. Jin and J. Guo, ACS Appl. Mater. Interfaces, 2022, 14, 11820–11833 CrossRef CAS PubMed.
- X. Liu, X. Chen, Y. Li, B. Wu, X. Luo, S. Ouyang, S. Luo, A. A. Al Kheraif and J. Lin, J. Mater. Chem. A, 2019, 7, 19173–19186 RSC.
- K. Hong, J. Hong and Y. Kim, J. Photochem. Photobiol., A, 2020, 396, 112520 CrossRef CAS.
- X. Yang, B. Tang, X. Cao, Y. Ding and M. Huang, J. Photochem. Photobiol., A, 2021, 411, 113202 CrossRef CAS.
- X. Jiang, S. Song, J. Guo, W. Lv, Y. Li, X. Guo, X. Wang, H. Liu, Y. Han and L. Wang, Phys. Lett. A, 2020, 384, 126149 CrossRef CAS.
- Q. Dong, C. Guo, L. He, X. Yan and X. Lu, Opt. Mater., 2020, 110, 110527 CrossRef CAS.
- Y. Zhu, X. Li, B. Zhu and Y. Liang, Inorg. Chem. Front., 2020, 7, 3126–3135 RSC.
- H.-R. Chen, C. Cai, Z.-W. Zhang, L. Zhang, H.-P. Lu, X. Xu, H. Van Bui, K.-H. Qiu and L.-J. Yin, J. Alloys Compd., 2019, 801, 10–18 CrossRef CAS.
- Y. Gong, Y. Liang, S. Liu, H. Li, Y. Bi, Q. Wang and Y. Dou, Inorg. Chem. Front., 2021, 8, 3760–3766 RSC.
- S. Bayan, N. Gogurla, A. Midya and S. K. Ray, Carbon, 2016, 108, 335–342 CrossRef CAS.
- P. Du, J. Tang, W. Li and L. Luo, Chem. Eng. J., 2021, 406, 127165 CrossRef CAS.
- J. Zhang, B. Han, P. Huang, J. Yu and L. Zhao, Polyhedron, 2017, 133, 398–403 CrossRef CAS.
- H. Guo, J. Zhang, L. Ma, J. L. Chavez, L. Yin, H. Gao, Z. Tang and W. Chen, Adv. Funct. Mater., 2015, 25, 6833–6838 CrossRef CAS.
- B. Han, Y. Xue, P. Li, J. Zhang, J. Zhang and H. Shi, J. Solid State Chem., 2015, 232, 26–30 CrossRef CAS.
- B. Han, B. Liu, J. Zhang and H. Shi, Optik, 2017, 131, 764–768 CrossRef CAS.
- Z. Zheng, Z. Zeng, Q. Guo, Q. Pan, J. Qiu and G. Dong, J. Am. Ceram. Soc., 2020, 103, 4411–4419 CrossRef CAS.
- W. Liang, Y. Zhang and M. Wang, J. Lumin., 2019, 215, 116646 CrossRef CAS.
- S. Mahlik, J. Barzowska, K. Szczodrowski, N. Majewska, M. Grinberg, D. Michalik, B. J. Adamczyk, T. Pawlik, T. Rzychoń, A. Adamczyk and M. Sopicka-Lizer, J. Alloys Compd., 2021, 884, 161047 CrossRef CAS.
- J. Xu, L. Zhang, R. Shi and Y. Zhu, J. Mater. Chem. A, 2013, 1, 14766 RSC.
- J.-Y. Tang, X.-F. Yang, C. Zhan, L.-Y. Hao, X. Xu and W.-H. Zhang, J. Mater. Chem., 2012, 22, 488–494 RSC.
- L. Chen, Z. Cheng, G. Zheng, G. Yao, L. He, L. Wang, J. Liu, H. Zheng, S. Wei and H. Ni, J. Lumin., 2021, 230, 117729 CrossRef CAS.
- H. Wang, Z. Zhu, B. Ma, L. Wei and L. Li, Ceram. Int., 2021, 47, 24163–24169 CrossRef CAS.
- H. Li, H. Chen, L. Yang and M. Guo, J. Lumin., 2018, 194, 661–666 CrossRef CAS.
| This journal is © The Royal Society of Chemistry 2023 |