 Open Access Article
Synergistic effect of modified pore and heterojunction of MOF-derived α-Fe2O3/ZnO for superior photocatalytic degradation of methylene blue
Liyana Labiba Zulfaa,
Ratna Ediati *a,
Alvin Romadhoni Putra Hidayata,
Riki Subagyoa,
Nuhaa Faaizatunnisaa,
Yuly Kusumawatia,
Djoko Hartantoa,
Nurul Widiastuti
 a,
Wahyu Prasetyo Utomoab and
Mardi Santoso
 a
a
aDepartment of Chemistry, Faculty of Science, Institut Teknologi Sepuluh Nopember, Surabaya 60111, Indonesia. E-mail: rediati@chem.its.ac.id
bSchool of Energy and Environment, City University of Hong Kong, Hong Kong 999077, China
First published on 26th January 2023
Abstract
Mesoporous heterojunction MOF-derived α-Fe2O3/ZnO composites were prepared by a simple calcination of α-Fe2O3/ZIF-8 as a sacrificial template. The optical properties confirm that coupling of both the modified pore and the n–n heterojunction effectively reduces the possibility of photoinduced charge carrier recombination under irradiation. The mesoporous Fe(25)ZnO with 25% loading of α-Fe2O3 exhibited the best performance in MB degradation, up to ∼100% after 150 minutes irradiation, higher than that of pristine ZnO and α-Fe2O3. Furthermore, after three cycles reusability, mesoporous Fe(25)ZnO still showed an excellent stability performance of up to 95.42% for degradation of MB. The proposed photocatalytic mechanism of mesoporous Fe(25)ZnO for the degradation of MB corresponds to the n–n heterojunction system. This study provides a valuable reference for preparing mesoporous MOF-derived metal oxides with an n–n heterojunction system to enhance MB photodegradation.
Introduction
The drastic increase in the concentration of azo dyes in the aquatic environment due to increased industrial activity has become an aquatic environmental problem that needs to be addressed. There are several methods for removing dye contaminants, including adsorption, microbial degradation, membrane filtration and photocatalysis. Photocatalysis is part of the advanced oxidation process (AOP) which has advantages over other methods such as (i) reducing the use of chemicals (ii) generating free radicals such as hydroxyl radicals (˙OH) involved in the destructive mineralization of water-soluble organic–inorganic pollutants and (iii) avoiding secondary waste.1–3 Semiconductors are widely used as photocatalysts because they have the ability to convert solar energy into chemical energy via redox reactions.4 Theoretically, the redox process of the photogeneration carrier depends on the values of the conduction band (CB) and the valence band (VB). The CB potential (ECB) must be more negative than the O2/˙O2 reduction potential to generate hydroxide radicals and the VB potential (EVB) must be more positive than the H2O/˙OH oxidation potential to generate superoxide radicals.5Zinc oxide (ZnO) is an n-type semiconductor with a large band gap (3.2–3.5 eV), lower toxicity and high physicochemical stability.6,7 Moreover, ZnO is popular in photocatalytic field due to its high charge carrier mobility, high performance and low exciton binding.8 However, there are some drawbacks of ZnO such as fast carrier recombination rate, low quantum yield efficiency, and lower separation charge transfer.9,10 Moreover, morphology, surface area and pore size distribution are still the main obstacles to ZnO as a photocatalyst. Comparing the performance of semiconductors with bulky and porous structures, it has been reported in previous studies that bulky structures cause volume recombination that will reduce the performance or inactivity of the semiconductor. These results indicate that semiconductors with porous structures have better photocatalytic performance than semiconductors with bulky structures.11,12 Therefore, it is a great effort to produce semiconductors with porous structures to improve the efficiency of charge carriers, to develop new photocatalyst by extending the absorption wavelength, and to develop new synthesis methods to increase the surface area and pore size.
To date, several studies have been reported to improve photocatalytic activity through the development of heterojunction systems.13 The heterojunction system can improve the light sensitivity of the semiconductor, leading to higher absorption and energy conversion efficiency of photons, suppressing electron recombination and charge carrier separation more effectively than a single semiconductor.14–16 The fabrication of heterojunction with a matching bandgap is an effective strategy to produce new high quality photocatalysts. Lei et al., reported that the heterojunction between α-Fe2O3 and SnO2 showed better performance for MB degradation compared to α-Fe2O3 and pure SnO2.17 In another study, Bouziani et al., reported that the heterojunction between α-Fe2O3 and TiO2 performed better for MB degradation than the original. Pure TiO2 has a photocatalytic performance of 30%, after addition of α-Fe2O3 the photocatalytic performance increases to 92% in 160 minutes.18 Therefore, improving the performance of a semiconductor can be done by increasing its porosity.
Metal–organic framework (MOF) is a type of porous material composed of a metal and a ligand with coordination bonds, also known as a porous coordination polymer (PCPy). The adjustable pore size and unique structure of the MOF provide new insights for the preparation of MOF-derived metal oxides.19,20 Unlike other metal oxide precursors, MOFs as metal oxide template offer broad options in the design and fabrication of hierarchical porous structures, abundant active sites, and large surface area. For example, the TiO2/ZrO2 composite made from the Ti/Zr bimetallic MOF showed a high degradation performance toward organic compounds, of up to 86.3% after 120 minutes of irradiation.21–25 When MOFs are heated in air, the ligands decompose into gases such as COx and NOx, while free metals react with oxygen to form porous metal oxides. ZIF-8 is one of the zinc-based MOFs that has been widely used as a self-sacrificial template for porous metal oxides by simple calcination. ZIF-8 calcination is considered an easy route to obtain porous ZnO with high photocatalytic performance.26,27 The porous structure with abundant active sites can not only facilitate the absorption of more organic pollutants, but also solve the problem of volume recombination by increasing photon absorption and charge carrier transfer.9,28 Therefore, porous MOF-derived metal oxide heterojunction have an important role in wastewater treatment.
In this study, a series of mesoporous α-Fe2O3/ZnO heterojunction composites were fabricated using α-Fe2O3/ZIF-8 as sacrificial template by simple calcination in air atmosphere. The effect of pore modification on MB degradation is also discussed. Reusability and trapping experiments of MOF and MOF-derived metal oxide composites were evaluated to compare their activities. Finally, we also investigate in detail the possible mechanism of mesoporous α-Fe2O3/ZnO heterojunction composites.
Experimental
Material
Zinc(II)nitrate tetrahydrate (Zn(NO3)2·4H2O) (Merck, 99%), 2-methylimidazole (Merck, 99%), glacial acetic acid (Merck, 99%), methanol (Merck, 99.9%), iron(III)oxide (α-Fe2O3) (Merck, 99%), triethylamine (TEA, Merck, 99%), isopropyl alcohol (Sigma-Aldrich), dimethyl sulfoxide (Merck), ascorbic acid (Merck), demineralized water, and methylene blue (Merck).Synthesis of ZIF-8 and porous ZnO
The ZIF-8 was synthesized in the media of 2% acetic acid solution.29 The process of synthesis was carried out by dissolving 1.7848 g of Zn(NO3)2·4H2O in 10 mL of 2% acetic acid, and dissolving 4.4916 g of 2-methylimidazole in a solvent mixture of 15 mL of demineralized water and 7.8 mL of TEA. The two solutions were then mixed until a white precipitate formed and allowed to stand at room temperature for 24 hours. Then the precipitate was separated by centrifugation, washed successively with demineralized water and methanol, dried at 60 °C for 12 hours and labelled as ZIF-8. A certain amount of ZIF-8 was placed in the crucible boat and calcined in an air atmosphere at 600 °C for 2 hours. The collected powder was labelled as ZnO.Synthesis of α-Fe2O3/ZIF-8 and porous α-Fe2O3/ZnO
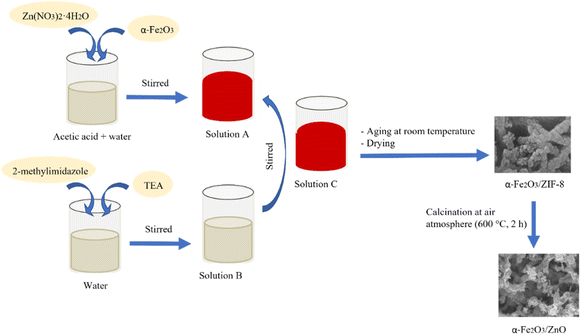
The α-Fe2O3/ZIF-8 composites were synthesized using the same procedure as for ZIF-8 synthesis, with addition of α-Fe2O3 at 10, 25 and 50% to the weight of ZIF-8, to the solution of Zn(NO3)2·4H2O in 2% acetic acid (Fig. 1). The composites were then labelled as Fe(10)ZIF-8, Fe(25)ZIF-8 and Fe(50)ZIF-8, respectively. Further, after calcination, the obtained powders were labelled as Fe(10)ZnO, Fe(25)ZnO and Fe(50)ZnO, respectively.Material characterizations
Powder X-ray diffraction patterns to obtain the crystal phase were obtained using the Xpert MPD diffractometer with Cu Kα irradiation source at a range of 5 to 100° (λ = 1.5406 Å, 40 kV, 30 mA). To know the characteristic functional group of the synthesized materials using the Shimadzu 8400S infrared spectrophotometer at wavenumbers in the range of 400–4000 cm−1. Field emission scanning electron microscopy with energy dispersive X-ray spectroscopy (FESEM-EDX) characterization was performed to observe the micro and mesostructure morphology and distribution of element at the samples. The surface area and features of pore structure were calculated using the Quantachrome NovaWin Gas Sorption Analyzer based on the Barret–Joyner–Halender (BJH) and Brunauer–Emmett–Teller (BET) models, respectively. Thermogravimetric analyses (TGA) of the samples were recorded using the PerkinElmer Pyris 1 Analyzer (approximately ± 10 mg of the samples) to study the thermal stability of ZIF-8 synthesized. The samples were put into a holder before being heating rate of 10 °C min−1 and at temperatures in the range of 30–900 °C. UV-vis diffuse reflectance spectra (DRS) were measured using the Agilent Cary UV-vis spectrophotometer to study the optical absorption properties. Photoluminescence (PL) was acquired using the fluorescence spectrometer Shimadzu RF-5310. The excitation wavelength of 320 nm was used to further obtain the optical properties of the materials. The EIS plots were performed by a CHI660E instrument. Electrochemical station with Ag/AgCl, Pt and 0.5 M Na2SO4 as reference electrode, counter electrode and electrolyte solution with full-spectrum of illumination. In photoelectric experiments, a typical materials were dropped cast on FTO at −0.2 V vs. saturated calomel electrode (SCE) at a frequency of 0.1 to 105 Hz. Mott Schottky plots were measured under the ambient condition at a frequency of 0.5 kHz and an amplitude of 0.01 V. The concentration of MB after each reaction were recorded using the Thermo Scientific GENESIS 10S UV-vis spectrophotometer at a wavelength of 663 nm.Adsorption and photocatalytic performances
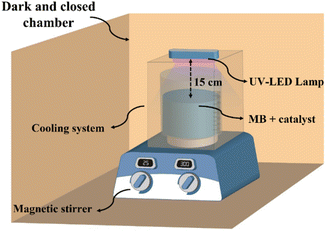
The adsorption experiment of the synthesized material on MB in water was performed in a batch system with an initial concentration of MB 30 mg L−1 and an adsorbent dose of 5–30 mg in 30 mL for 120 minutes. The adsorption process at various contact times was also conducted to obtain the equilibrium adsorption time. The equilibrium adsorption time was used as the duration of the dark condition in the photocatalytic process. The concentration of MB in the remaining solution was measured using the UV-vis spectrophotometer at a wavelength of 663 nm.The photocatalytic process was investigated by MB degradation under UV LED lamp (Fig. 2). A 12 W UV-LED lamp with a 365 nm cut-off was used as the light source. The irradiation distance between the lamp and the sample was 15 cm. Before the photocatalytic tests, all the photocatalysts were activated at 60 °C for 24 hours. In brief, 30 mg of photocatalyst was mixed with 30 mL of 30 mg L−1 MB solution in batch system. The temperature of the photocatalytic process was maintained at 30 °C, and stirred for 60 and 40 min, for α-Fe2O3/ZIF-8 and α-Fe2O3/ZnO composites respectively, in the dark condition to achieve the adsorption–desorption equilibrium. After reach the equilibrium, the sample was irradiated with time intervals of 30, 60, 90, 120 and 150 minutes. The concentration of MB remained after photocatalytic process was analyzed using a UV-vis spectrophotometer. In this experiment, the photocatalyst dose, irradiation time and MB concentration were varied to test the effectiveness of the photocatalyst. Photocatalytic kinetic of the synthesized material was evaluated by zero order (eqn (1)), first order (eqn (2)) and second order (eqn (3)) as follows to study the behavior of decomposed dye solution:
| C0 − Ct = K0t | (1) |
ln![[thin space (1/6-em)]](https://www.rsc.org/images/entities/char_2009.gif) (C0/Ct) = K1t (C0/Ct) = K1t
| (2) |
 | (3) |
Radical trapping experiments
The detection of active species was performed by trapping experiments using different scavengers. The method of trapping experiment is the same as a photocatalytic reaction with the addition of different corresponding scavengers. In these research, we used scavengers IPA (scavenger for ˙OH), DMSO (scavenger for electron), methanol (scavenger for hole), and ascorbic acid (scavenger for ˙O2−). In each experiment, 30 mg of photocatalyst was added to 30 mg L−1 MB solution, and the mixture was stirred in the dark for 60 minutes (for Fe(25)ZIF-8) and 40 minutes (for Fe(25)ZnO) to achieve adsorption–desorption equilibrium before being exposed to a UV-LED lamp for 150 minutes.Results and discussion
Material characterizations
XRD characterization was conducted to determine the crystallinity and phase structures of the synthesized materials. The XRD pattern of ZIF-8 is shown in Fig. 3a in which the characteristic peaks are exhibited at 2θ = 7.29, 10.39, 12.69, 16.38 and 17.96°. These peaks were consistent with previous research,29 which proves that ZIF-8 with high purity was successfully synthesized. A commercial α-Fe2O3 has characteristic peaks in the region of 2θ = 24, 32.97, 35.46, 40.69 and 53.89°, correlating to the planes (0 1 2), (1 0 4), (1 1 0), (1 1 3) and (1 1 6), respectively, according to JCPDS 33-0664. All off the diffraction peaks in Fe(10)ZIF-8, Fe(25)ZIF-8 and Fe(50)ZIF-8 show the same main diffraction peaks of ZIF-8 and α-Fe2O3 with slight reduction in their intensities. Furthermore, other peak impurities were not detected in a series of MOF composites which prove the high purity of the MOF composites (Fig. 3a). Based on Table 1 it is shown that the main peaks of series MOF composites are produced a minor shifting towards the lower diffraction angles compared to the pristine ZIF-8 without any significant shifting and still maintain the crystal lattice structure.30 After calcination at 600 °C, all materials showed to ZnO structure (Fig. 3b). It can be inferred that there is no peak of impurity detected in all MOF-derived metal oxide composites, and a peak have a unique crystal face and accordance with ZnO in the region of 2θ = 31.63, 34.29 and 36.11° correlating to the plane of (1 0 0), (0 0 2), and (1 0 1). It can be observed that the diffractogram of Fe(10)ZnO, Fe(25)ZnO and Fe(50)ZnO have characteristic peaks both ZnO and α-Fe2O3. The characteristic peak of ZnO does changeless, indicating that α-Fe2O3 is only on the surface of ZnO through physical action. These results indicate the successful preparation of MOF-derived metal oxide composites has been confirmed.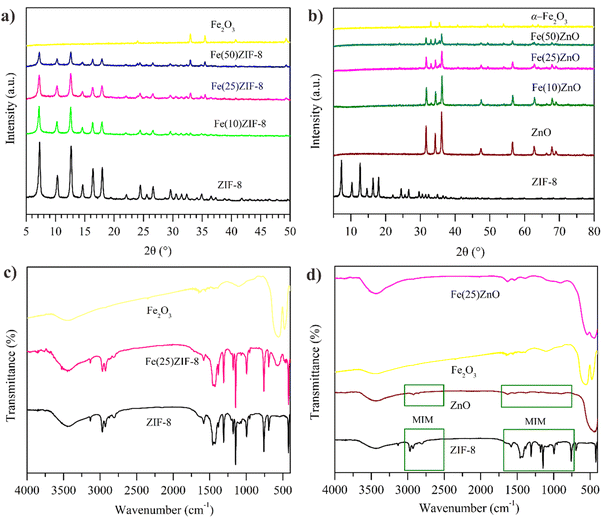 | ||
| Fig. 3 XRD pattern of (a) MOF composites (b) MOF-derived metal oxide and FTIR spectra of (c) MOF composites (d) MOF-derived metal oxide. | ||
| Sample | 2θ (°) | Crystallinity (%) | ||||
|---|---|---|---|---|---|---|
| Peak 1 | Peak 2 | Peak 3 | Peak 4 | Peak 5 | ||
| ZIF-8 | 7.36 (2081.01) | 10.42 (854.42) | 12.69 (2431.88) | 16.40 (1218.81) | 18.07 (1287.07) | 100 |
| Fe(10)ZIF-8 | 7.19 (1376.11) | 10.27 (513.64) | 12.60 (1295.09) | 16.30 (572.71) | 17.95 (600.69) | 55.35 |
| Fe(25)ZIF-8 | 7.27 (1019.58) | 10.28 (532.32) | 12.59 (1180.60) | 16.35 (467.75) | 17.89 (543.19) | 47.54 |
| Fe(50)ZIF-8 | 7.27 (635.80) | 10.27 (280.65) | 12.61 (640.18) | 16.35 (278.12) | 17.90 (315.41) | 27.30 |
Based on Tables 1 and 2, after the addition of α-Fe2O3, the intensity of all composite decreased significantly. Table 1 shows the correlation between intensity and crystallinity values in MOF composites and Table 2 for MOF-derived metal oxide composites.
| Material | 2θ | Crystallinity (%) | ||
|---|---|---|---|---|
| Peak 1 | Peak 2 | Peak 3 | ||
| ZnO | 31.63 (2213.12) | 34.29 (1558.93) | 36.11 (3270.94) | 100 |
| Fe(10)ZnO | 31.73 (1394.12) | 34.35 (988.48) | 36.21 (2279.69) | 59.21 |
| Fe(25)ZnO | 31.68 (851.96) | 34.32 (644.46) | 36.14 (1334.90) | 35.96 |
| Fe(50)ZnO | 31.59 (514.21) | 34.26 (396.10) | 36.16 (742.79) | 20.98 |
Low crystallinity can also be indicated by the presence of broader diffraction peaks.30,31 The broader peaks are due to the presence of α-Fe2O3 which have an amorphous structure that has been successfully loaded on ZIF-8 via in situ method with the assumption that in situ nucleation and growth of ZIF-8 on α-Fe2O3 favor decreasing the scattering of light hitting an aligned surface.32
The FTIR spectra of ZIF-8 shows the stretching vibration of –OH at 3448 cm−1. The adsorption peak located at 3132 cm−1 correspond to C–H stretching vibration from methyl group in imidazole ring. The wavenumbers located at 2970 and 2928 cm−1 were related to the presence of C–CH3 from acetic group and the stretching of aliphatic C–H methyl group from aromatic linker.
At lower wavenumbers at 1178 cm−1 and 995 cm−1 correspond to the in-plane and out-of-plane bending from the ligand imidazole. The lower peak around at 1581 cm−1 attributed to stretch mode of C![[double bond, length as m-dash]](https://www.rsc.org/images/entities/char_e001.gif) N. The absence of peak located at 1849 cm−1 from the bending and stretching vibration of N–H indicates that the 2-methylimidazole has been successfully deprotonated with the presence of TEA. Zn–N stretching mode in the wavenumber 422 cm−1.29 The spectra of α-Fe2O3 as displayed in Fig. 3c the wavenumber at 3435 cm−1 is attributed to asymmetrical stretching vibration and molecular deformation of the water adsorbed. The peak at 559.27 and 476.47 cm−1 is due to the Fe–O stretching vibration.33 The Fe(25)ZIF-8 (Fig. 3c) possess characteristic absorption bands of both ZIF-8 and α-Fe2O3. These result signified that there were no impurities found in Fe(25)ZIF-8.
N. The absence of peak located at 1849 cm−1 from the bending and stretching vibration of N–H indicates that the 2-methylimidazole has been successfully deprotonated with the presence of TEA. Zn–N stretching mode in the wavenumber 422 cm−1.29 The spectra of α-Fe2O3 as displayed in Fig. 3c the wavenumber at 3435 cm−1 is attributed to asymmetrical stretching vibration and molecular deformation of the water adsorbed. The peak at 559.27 and 476.47 cm−1 is due to the Fe–O stretching vibration.33 The Fe(25)ZIF-8 (Fig. 3c) possess characteristic absorption bands of both ZIF-8 and α-Fe2O3. These result signified that there were no impurities found in Fe(25)ZIF-8.
The spectra of ZnO indicated the wavenumber at 426 cm−1 can be attributed of stretching Zn–O band. Same as spectra FTIR of α-Fe2O3, the presence wavenumber at 3446 cm−1 is attributed to asymmetrical stretching vibration and molecular deformation of the water adsorbed.34 The spectra of Fe(25)ZnO (Fig. 3d) showed combination peaks of ZnO and α-Fe2O3 and did not show other peaks. These results indicate that calcination at 600 °C can remove organic components from the ligand and produce ZnO.
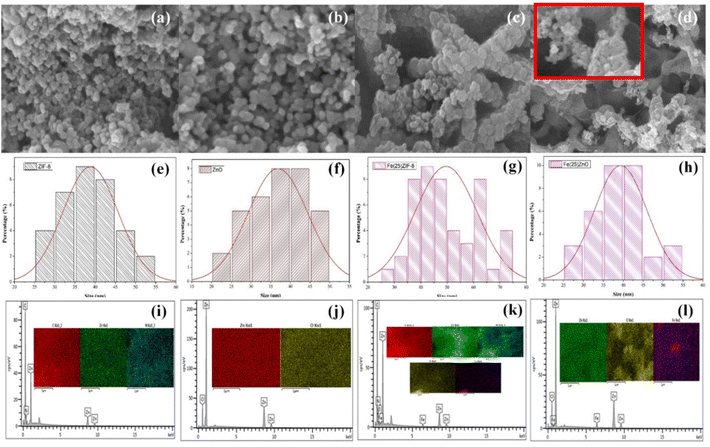
The morphology of ZIF-8 based on Fig. 4a is spherical morphology. Furthermore, the morphology of ZnO (Fig. 4b) retains the morphology of ZIF-8 with the lower agglomeration. FESEM image of Fe(25)ZIF-8 and Fe(25)ZnO are displayed in Fig. 4c and d. Fe(25)ZIF-8 is formed by particles of nearly spherical morphology with agglomeration and resembling a starfish. While Fe(25)ZnO, whether they are nearly spheric or not and the dense network can not be observed. In this case, it is obvious from a closer look at the magnified in Fig. 4d where their morphology was maintained spheric with lower agglomeration than Fe(25)ZIF-8. The resulting agglomeration is a consequence of the high surface energy and van der Waals forces. Greater interactions between nanoparticles and higher tensile forces occur due to the high surface area. These results are linier with the N2 physisorption which ZIF-8 and Fe(25)ZIF-8 have a higher surface area than ZnO and Fe(25)ZnO. Besides, higher attractive force between nanoparticles causes the presence of strong adhesion, resulting in agglomeration.35 The particle size histograms estimated the size distribution (Fig. 4e–h) of ZIF-8, ZnO, Fe(25)ZIF-8 and Fe(25)ZnO at 38.83, 36.84, 45.17 and 39.35 nm, respectively. The EDX mapping of ZIF-8, ZnO, Fe(25)ZIF-8 and Fe(25)ZnO are shown in Fig. 4i–l and Table 3 also reveal elemental composition and distribution in this samples. ZIF-8 consist of a homogeneous elemental distribution of zinc (Zn), nitrogen (N) and carbon (C) elements. The distribution uniform of zinc (Zn), nitrogen (N), carbon (C), iron (Fe) and oxygen (O) in the Fe(25)ZIF-8 reflects the successful synthesis using in situ method. The zinc (Zn) and oxygen (O) elements are uniformly distributed in ZnO. Fe(25)ZnO mapping demonstrated the homogeneous elemental distribution of zinc (Zn), iron (Fe) and oxygen (O) elements. The heat treatment causes a phase transformation which is proven by the loss of carbon and nitrogen elements from their frameworks. EDX mapping in line with diffractogram of XRD that there are no impurity detection and FTIR spectra that imidazolate ligand have been successfully removal after the heat treatment. Furthermore, from elemental mapping of Fe(25)ZIF-8 and Fe(25)ZnO, it can be known that Fe elements are equal distributed in the Fe(25)ZIF-8 and Fe(25)ZnO.
| Material | Element | Content (%) |
|---|---|---|
| ZIF-8 | Zn | 11.8 |
| N | 18.4 | |
| C | 69.8 | |
| Fe(25)ZIF-8 | Zn | 13.5 |
| N | 16.4 | |
| C | 63.1 | |
| O | 6.5 | |
| ZnO | Fe | 0.6 |
| Zn | 77.5 | |
| O | 22.5 | |
| Fe(25)ZnO | Fe | 76.3 |
| Zn | 4.1 | |
| O | 19.6 |
The surface and porous properties of materials have an imperative impact on adsorption-photocatalytic performance. The surface area and feature of pore structure of materials were measured using BET characterization method based on N2 physisorption. According to the IUPAC classification, ZIF-8 showed type I isotherms with micropore structure which is characterized by the amount of adsorbed increases sharply at the low pressure (Fig. 5a). The pristine ZIF-8 shows higher specific surface area and porosity than previous report (Table 4).29 Based on Fig. 5a, Fe(10)ZIF-8 and Fe(25)ZIF-8 also classified as type I isotherms but their specific surface area and porosity are lower than pristine ZIF-8 (Table 3). Decreasing in specific surface area and porosity may be due to the addition of α-Fe2O3.
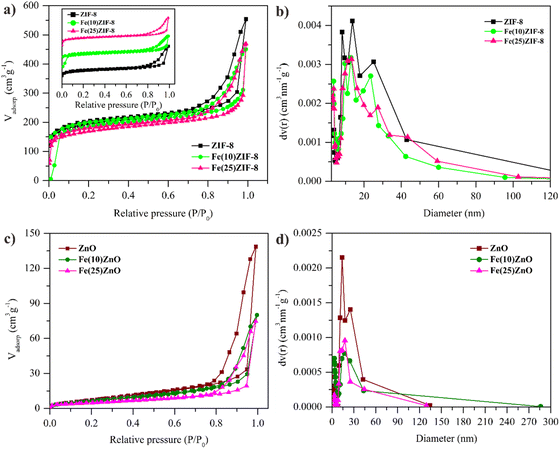 | ||
| Fig. 5 N2 adsorption–desorption isotherm of (a) MOF composites (c) MOF-derived metal oxide and BJH pore distribution of (b) MOF composites (d) MOF-derived metal oxide. | ||
| Material | SBET (m2 g−1) | Vp meso (cm3 g−1) | Vp micro (cm3 g−1) | V average (cm3 g−1) | D meso (nm) | Dp average (nm) |
|---|---|---|---|---|---|---|
| ZIF-8 | 705.3 | 0.58 | 0.29 | 0.856 | 13.742 | 4.858 |
| Fe(10)ZIF-8 | 665.9 | 0.42 | 0.28 | 0.726 | 12.93 | 4.19 |
| Fe(25)ZIF-8 | 608.2 | 0.48 | 0.25 | 0.697 | 13.202 | 4.78 |
| ZnO | 32.63 | 0.22 | 0.01 | 0.214 | 13.814 | 26.28 |
| Fe(10)ZnO | 26.92 | 0.12 | 0.008 | 0.123 | 17.006 | 18.39 |
| Fe(25)ZnO | 17.99 | 0.11 | 0.006 | 0.115 | 17.678 | 25.7 |
| ZIF-829 | 538 | 0.166 | 0.2696 | 0.4356 | — | 3.24 |
| ZnO (ZIF-8)9 | 16.9 | — | — | 0.088 | — | — |
| ZnO (RP)9 | 0.56 | — | — | 0.00096 | — | — |
After calcination, ZnO, Fe(10)ZnO and Fe(25)ZnO showed type-IV isotherms with the obvious hysteresis loop H3 at a relatively high pressure, due to the presence of adjacent small particles to produce a new larger cavity that was detected as slit-like pores (Fig. 5c).36,37 The specific surface area and porosity of the ZnO, Fe(10)ZnO and Fe(25)ZnO can be seen in Table 4. The template method proves for production mesoporous metal oxide (ZnO and α-Fe2O3/ZnO) with high surface area than conventional synthesized ZnO (Table 5).38–43 These results indicate that using ZIF-8 as a template with a high surface area could produce ZnO with a higher surface area than the synthesis of ZnO using a Zn precursor which has a low surface area. The change in isotherm type from type I to type IV indicates collapsing of the micropores in the ZIF-8 framework to mesopores due to the decomposition of organic ligands during the calcination produced heat energy that spreads over the entire surface and lead to the appearance of new lower surface area.44 Although there was a change in the type of isotherm in MOF-derived metal oxide, the mesopore did not change significantly (Table 4) which was confirmed by FESEM of ZnO and Fe(25)ZnO (Fig. 4a and b) which still maintain a spheric morphology from their pristine. This shows that the use of MOF as a metal oxide template through calcination is an effective way to produce mesoporous metal oxide.
| Material | Method | SBET (m2 g−1) | Vpore (cm−3 g−1) | Pollutant | Degradation efficiency (%) | Condition | Ref. |
|---|---|---|---|---|---|---|---|
| ZnO | Refluks | 9.0687 | 0.037 | Methylene blue | 97.16 | 5 mg L−1; 10 mL; 0.04 gram; 6 h | 38 |
| ZnO | Sol–gel | 11.7 | 0.025 | Methylene blue | 74 | 10−5 M; 100 mL; 0.1 gram; 120 min | 39 |
| ZnO | Hydrothermal | 12.07 | 0.027 | Methylene blue | 70 | 20 mg L−1; 0.03 g; 150 mL; 120 min | 40 |
| ZnO | Hydrothermal | — | — | Methylene blue | 60 | 20 mg L−1; 50 mg; 25 mL; 60 min | 41 |
| ZnO | Hydrothermal | 9.65 | 0.016 | Methylene blue | 85 | 5 mg L−1; 30 mg; 100 mL; 210 min | 42 |
| ZnO | Hydrothermal | — | — | Methylene blue | 71.7 | 5 mg L; 30 mg; 150 min | 35 |
| ZnO | Template | 32.63 | 0.214 | Methylene blue | 98.7 | 30 mg L−1; 30 mg; 150 min | This work |
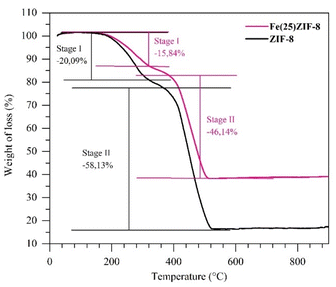
TGA characterization was performed to obtain the thermal stability of the synthesized materials (ZIF-8 and Fe(25)ZIF-8 composite) and to select the calcination temperature to produce metal oxide. According to Fig. 6, the thermogram of ZIF-8 underwent a weight decrease of 20.1% at temperature range of 25–330 °C. The weight loss of 20.1% indicated that evaporation of the adsorbed water molecules, the reactants did not react and were trapped within the framework of ZIF-8. The second weight reduction of 58.1% occurred in the range of 380–560 °C, which signalled that a thermal decomposition occurred on the framework of ZIF-8.45 The ZIF-8 thermogram showed the thermal stability up to 380 °C.
The temperature increase of above 380 °C induced the formation of α-Fe2O3/ZnO. However, at a temperature range of 380–525 °C, organic components were still detected on the framework of Fe(25)ZIF-8. Pure α-Fe2O3/ZnO was formed at temperatures of above 525 °C. The TGA results showed that the loading of α-Fe2O3 can increase the thermal stability of the composite.46 Fe(25)ZIF-8 has about 25% more weight than ZIF-8 which is derived from α-Fe2O3. The calculation to determine the amount of ZnO and Fe(25)ZnO produced using the ZIF-8 and Fe(25)ZIF-8 templates through the weight at 560 °C divided by the weight at around 400 °C.47 Yield of ZnO and Fe(25)ZnO in this study are 21 and 45%, respectively. It can be known that the addition of α-Fe2O3 to obtain Fe(25)ZnO composite has been successfully carried out. Thus, based on the thermogram, the selected calcination temperature to produce ZnO and Fe(25)ZnO from ZIF-8 and Fe(25)ZIF-8 was 600 °C.
Optical properties
UV-Vis DRS were performed to calculate the wavelength of absorption and band gap (Eg) value of photocatalyst. The wavelength of the absorption is determined by extrapolating the part of the spectra on the horizontal side and rising sharply from the spectra defined as the intersection of the wavelengths and help to determine the Eg value. There are two absorption peaks in heterojunction composites around of 370 and 560 nm, which can be known to the attribute of the electronic transition from the VB to the CB due to the absorption of photon, O2− → Zn2+ and O2− → Fe3+ charge transfer processes, respectively.1,3,48 UV-vis wavelength range of α-Fe2O3/ZnO is broader than the pristine semiconductor (ZnO and α-Fe2O3) which is correlated with the fabrication of the n–n heterojunction system by combining two semiconductors (ZnO and α-Fe2O3).49,50 The Eg value of photocatalyst (Fig. 7b) was further calculated using Kubelka–Munk equation. The Eg values of pristine ZIF-8, ZnO and α-Fe2O3 are 3.17, 3.22 and 2.02, respectively. Besides, the Eg values of Fe(10)ZnO, Fe(25)ZnO and Fe(50)ZnO are 1.98, 1.95 and 2.09 eV (Eg1) for the lower energy area and 3.1, 2.98 and 3.15 eV (Eg2) for the higher energy area. Based on the calculation, confirm a decreasing of Eg values in α-Fe2O3/ZnO due to the presence of redshift and extend the optical absorption properties to the visible range. The decreasing of Eg value results a lower energy required for excitation of electron from VB to CB thereby increasing the photocatalytic performance. The Eg value of ZnO generated using template method is not much different from the Eg value of ZnO generated by other methods.8,40,51 Meanwhile, Fe(50)ZnO showed an increasing Eg value when compared to the other photocatalysts. This condition indicates that the optimum addition of α-Fe2O3 is 25%.36 The addition of α-Fe2O3 greater than 25% causes the presence of agglomeration on the surface photocatalyst and covers the active site so the adsorption and photocatalytic processes will be decreased.52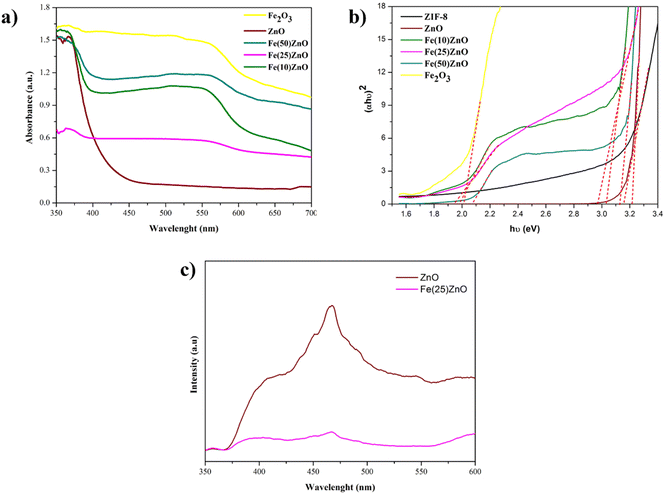 | ||
| Fig. 7 (a) UV-vis DRS spectra (b) plot of (αhν)2 versus energy (hν) (c) PL spectra of ZnO and Fe(25)ZnO. | ||
Photoluminescence (PL) characterization is another important technique to reveal the separation efficiency of charge carriers in semiconductor materials. As presented in Fig. 7c, ZnO and Fe(25)ZnO show a similar feature of PL spectra, with the peak centered at 468 nm. The PL intensity of Fe(25)ZnO is significantly lower compared to the pristine ZnO, which is attributed to the suppression of charge carriers recombination in Fe(25)ZnO. The presence of n–n heterojunction system between ZnO and α-Fe2O3 may be responsible for this suppression of carriers' recombination due to the more improve effectiveness separation of electron–hole pairs as previously reported.53
In addition to PL analysis, we also performed Mott–Schottky measurement over ZnO and Fe(25)ZnO to verify the formation of n–n heterojunction in Fe(25)ZnO. As presented in Fig. 8, both ZnO and Fe(25)ZnO show positive slopes, which indicate the nature of n-type semiconductor with electrons as majority charge carriers.54,55 Note that Fe(25)ZnO consists of α-Fe2O3 and ZnO, in which α-Fe2O3 is an n-type semiconductor.54,55 Moreover, the carrier densities of ZnO and Fe(25)ZnO can be calculated according to eqn (4):
 | (4) |
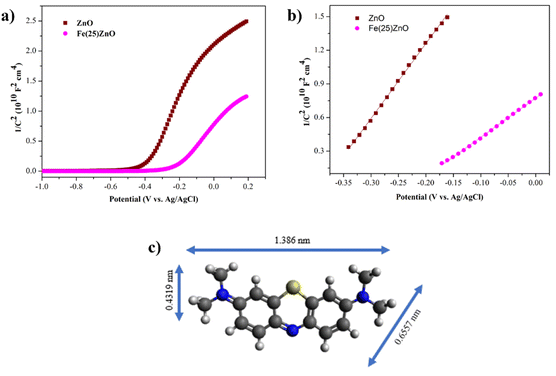 | ||
| Fig. 8 (a) Mott–Schottky plots (b) linear fit plots of Mott-Schottky for ZnO and Fe(25)ZnO (c) structure of methylene blue. | ||
Photocatalytic activity
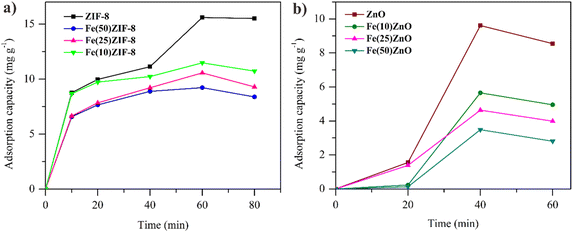 | ||
| Fig. 9 Adsorption capacity in methylene blue solution (W = 30 mg, C0 = 30 mg L−1, V = 30 mL) of (a) MOF composites (b) MOF-derived metal oxide. | ||
However, the difference in adsorption capacity between ZIF-8 and ZnO did not show the significant result due to the ZnO has a nearly same mesopore with ZIF-8. Calzada et al., reported that the adsorption capacity of ZnO in MB removal of 7 mg g−1 was lower than ZnO in this report due to the lower mesopore.60 So that the use of MOF as a metal oxide template can be used as an effective method to improve the adsorption performance of metal oxides.
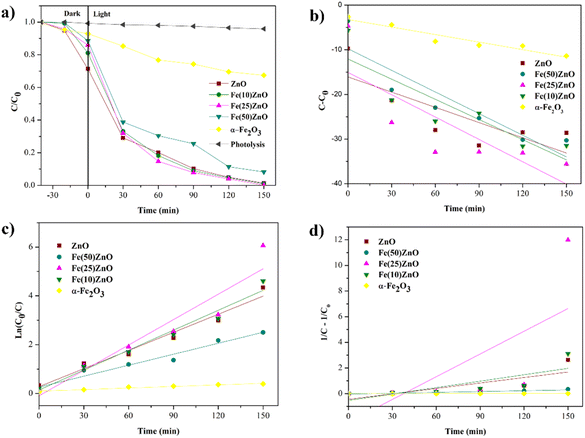
During the 150 min irradiation the degradation of MB was negligible without the presence of photocatalyst indicating the stability of MB in water under UV LED irradiation. At the same time, there was a significant increase in the MOF-derived metal oxide composites with better performance than pristine ZnO and α-Fe2O3 due to presence of n–n heterojunction (Fig. 11a).
The appearance of n–n heterojunction increased the ability of MOF-derived metal oxide composites to degrade MB through broader photon absorption range, lower recombination rate of carriers, higher redox capability and presence of pores avoid the volume recombination.9 These results prove that the combination of two semiconductors can overcome the shortcomings caused by one semiconductor. Photocatalytic performance can be increased with the addition of α-Fe2O3, but the excessive of α-Fe2O3 can decrease the photocatalytic performance. Fig. 10a and 11a show that the effect of adding 10 and 25% α-Fe2O3 in composites Fe(10)ZIF-8, Fe(25)ZIF-8, Fe(10)ZnO and Fe(25)ZnO has better photodegradation than that of ZIF-8 and ZnO. However, the addition of 50% α-Fe2O3 in composites Fe(50)ZIF-8 and Fe(50)ZnO has lower photodegradation than ZIF-8 and ZnO. Excessive of α-Fe2O3 can be closed the surface active sites and increased electron–hole recombination.61,62
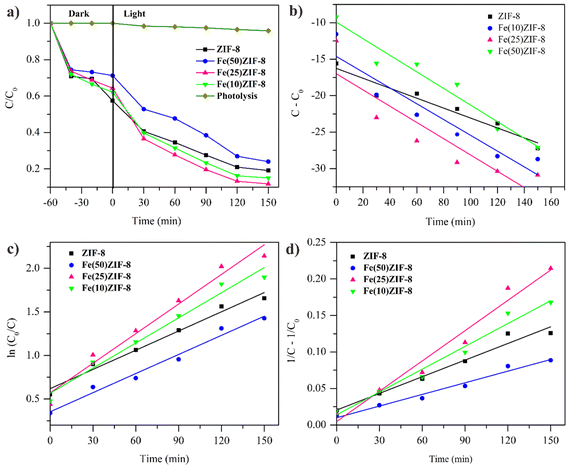 | ||
| Fig. 10 (a) Effect of irradiation light on the degradation of methylene blue of MOF composites (W = 30 mg, C0 = 30 mg L−1, V = 30 mL) and kinetic plot (b) zero order (c) first order (d) second order. | ||
In order to evaluate the kinetic behavior degradation of MB during photocatalytic process, experimental data of all photocatalyst were fitted into zero, first and second order and shown in Fig. 10b–d for MOF composites, Fig. 11b–d for MOF-derived metal oxide and Table 6 show the highest value of R2 correlation coefficient was concluded that the photocatalytic process followed the first order kinetic (ln![[thin space (1/6-em)]](https://www.rsc.org/images/entities/char_2009.gif) C0/Ct = kt). The rate constant of the Fe(25)ZnO was 4.7 times larger than that of the ZIF-8. The higher degradation rate constant could be attributed to lower recombination of volume and charge carriers owing to synergistic effect mesoporous structure with n–n heterojunction.44,63 Compared with other previously reported photocatalysts (Table 7), the Fe(25)ZnO behaved itself as a highly efficiency degradation for MB.
C0/Ct = kt). The rate constant of the Fe(25)ZnO was 4.7 times larger than that of the ZIF-8. The higher degradation rate constant could be attributed to lower recombination of volume and charge carriers owing to synergistic effect mesoporous structure with n–n heterojunction.44,63 Compared with other previously reported photocatalysts (Table 7), the Fe(25)ZnO behaved itself as a highly efficiency degradation for MB.
| Photocatalyst | Order 0 | Order 1 | Order 2 | |||
|---|---|---|---|---|---|---|
| Rate constant (mol−1 Ls−1) | R02 | Rate constant (min−1) | R12 | Rate constant (L mg−1 min−1) | R22 | |
| ZIF-8 | 0.0004 | 0.0003 | 0.0074 | 0.9815 | 0.0008 | 0.9716 |
| Fe(10)ZIF-8 | 0.0204 | 0.0848 | 0.0096 | 0.9762 | 0.001 | 0.976 |
| Fe(25)ZIF-8 | 0.0281 | 0.2639 | 0.0113 | 0.974 | 0.0014 | 0.9706 |
| Fe(50)ZIF-8 | 0.0149 | 0.0182 | 0.0073 | 0.9799 | 0.0005 | 0.9771 |
| ZnO | 0.1137 | 0.6343 | 0.0247 | 0.9686 | 0.0142 | 0.6252 |
| Fe(10)ZnO | 0.1506 | 0.7801 | 0.0272 | 0.9731 | 0.0167 | 0.6111 |
| Fe(25)ZnO | 0.1668 | 0.6458 | 0.6458 | 0.9068 | 0.0591 | 0.4776 |
| Fe(50)ZnO | 0.1615 | 0.8276 | 0.015 | 0.9596 | 0.0021 | 0.8753 |
| α-Fe2O3 | 0.0562 | 0.921 | 0.0021 | 0.9626 | 0.0001 | 0.9371 |
| Photocatalysts | Method | Pollutant | Efficiency degradation (%) | Time (min) | Condition | Ref. |
|---|---|---|---|---|---|---|
| SnO2, α-Fe2O3/SnO2 | Hydrothermal | Methylene blue | 40, 70 | 240 | 8 mL MB, 5 mg L−1, 500 W Hg lamp | 17 |
| ZnO, α-Fe2O3/ZnO | Wet preparation. Chemical deposition | Methylene blue | 59, 94.25 | 60 | 25 mL, 16 mg L−1, 300 W Hg lamp | 3 |
| TiO2, α-Fe2O3/TiO2 | Sol–gel | Methylene blue | 30, 92 | 180 | 100 mL, 10 mg L−1, 1 gram, 500 W Xe lamp | 18 |
| α-Fe2O3, mg/α-Fe2O3 | Wet preparation | Methylene blue | 5, 36 | 80 | 15 mL, 5 mg L−1, 7.5 mg, 500 W Xe lamp | 64 |
| Cu2O, α-Fe2O3/Cu2O | Wet preparation, mechanochemical | Methylene blue | 40.5, 81 | 45 | 10 mL, 2 mg L−1, 0.4 g, 40 W tungsten lamp | 65 |
| Co doped ZnO | Hydrothermal | Methylene blue | 96 | 120 | 10 mL, 10 mg L−1, 40 W incandescent lamp | 66 |
| Co2+-ZnO@SSM | Hydrothermal | Methylene blue | 97.2 | 180 | 100 mL, 10 mg L−1, 40 W incandescent lamp | 67 |
| Fe(25)ZnO | Template | Methylene blue | 99.7 | 150 | 30 mL, 30 mg L−1, 30 mg, LED 12W | This work |
Effect of photocatalyst dose. It is well known that dose of photocatalyst affects the adsorption-photocatalytic performance, which is one of the parameters that must be considered to support the success of the research. Thus, it is importance to determine and analyze its optimal dose of photocatalyst. The photocatalyst is mixed with 30 ppm MB at different doses. The effects of different doses on MB degradation is displayed in Fig. 12a and b. As observed from the diagram, the performance of all photocatalyst (MOF composites and MOF-derived metal oxide composites) increased with the increasing of the doses until the maximum dose was achieved at 30 mg. The highest efficiency degradation of 96.03% was observed at the 30 mg per 30 mL Fe(25)ZnO. When the dose is not optimal, the photocatalyst is not enough to absorb photon so the performance value is low. The use of an optimal dose causes the availability of an optimal surface active site to absorb photons resulting in a large number of charges and radicals to degrade MB.68,69
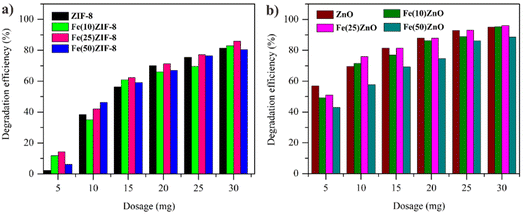 | ||
| Fig. 12 Effect of dosage on degradation of MB (a) MOF composites (b) MOF-derived metal oxide (dosage = 5–35 mg, [MB] = 30 mg L−1, t in dark = 60/40 min, t in uv light = 150 min). | ||
Effect of initial concentration. Based on Fig. 13 photocatalytic performance of ZnO, Fe(10)ZnO and Fe(25)ZnO (three catalyst with higher photocatalytic performance) were decreased due to the increasing of MB concentration. When the MB concentration was 20 mg L−1, all photocatalyst can degrade 100% of MB and Fe(25)ZnO can degrade 100% MB at 120 min. At lower concentration, the frequency of collisions between MB and photocatalyst was optimal due to the abundance of active site on photocatalyst, leading to the higher of the degradation. At higher concentration of MB, all photocatalyst showed decreasing performance, but Fe(25)ZnO still produced higher degradation performance up to 91.4%.
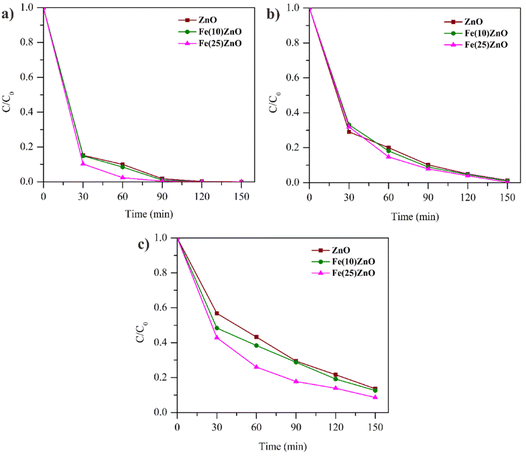 | ||
| Fig. 13 Effect of MB concentration on the degradation efficiency (a) 20 mg L−1 (b) 30 mg L−1 (c) 40 mg L−1. | ||
This is due to the unbalanced interaction between photons and surface of photocatalyst with the MB molecules. The increasing of MB will resist the direct interaction of photons with surface of photocatalyst and cause saturation thereby reducing the photon absorption. This situation causes photo generation to be hampered.70
Trapping experiment
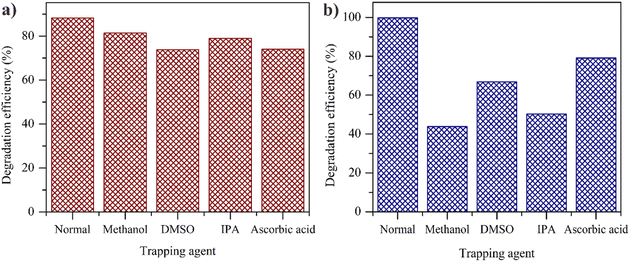
Investigation on the active species that contributes to the MB degradation was carried out by means of a trapping experiment (Fig. 14). To study the role of active species, IPA (scavenger for ˙OH), DMSO (scavenger for electron), methanol (scavenger for hole) and ascorbic acid (scavenger for ˙O2−) were served as scavengers. The addition of trapping agent in Fe(25)ZIF-8 decreased the initial degradation performance of 88.25% to 73.78, 79, 81.4 and 74.10%, respectively (Fig. 14a).The trapping experiment showed that electrons and ˙O2− both had a significant contribution in degrading MB. This was proven with a more negative conduction band edge potential (ECB) ZIF-8 value compared to the O2/˙O2− potential of −0.33 eV, where both values had a difference of −1.2 eV. The low ECB value of ZIF-8 made the reduction of O2 to ˙O2− easier. When DMSO was added with the purpose of capturing electrons, there was a decreasing in the number of electrons that were used to reduce O2 to ˙O2−, thus diminishing the photocatalytic performance.
On the other hand, the addition of ascorbic acid caused the second largest reduction in the amount of electrons after DMSO, in which the number of electrons captures also affected the amount of ˙O2− produced.58,71 The results indicate that electrons and ˙O2− is the leading free radicals species in MB degradation over Fe(25)ZIF-8.
The addition of DMSO, IPA, methanol and ascorbic acid as a trapping agent in Fe(25)ZnO reduced the initial degradation of 99.76% to 66.75, 50.26, 43.82 and 79.07%, respectively (Fig. 14b). The trapping experiment showed that ˙OH and holes both had a significant contribution in degrading MB. This was proven with a more positive the valence band edge potential (EVB) ZnO value compared to the H2O/˙OH potential of 2.34 eV. The low EVB ZnO value made the oxidation of H2O to ˙OH easier. When IPA and methanol were added, the amount of ˙OH and holes to oxidize H2O decreased thereby diminishing the photocatalytic performance.72,73 The results indicate that ˙OH and holes is the leading free radicals species in MB degradation over Fe(25)ZnO.
Based on the radical trapping experiment, it can be seen that there are significant differences regarding the free radicals contained in Fe(25)ZIF-8 and Fe(25)ZnO. It is concluded that the addition of trapping agent in Fe(25)ZIF-8 does not show a significant reduction compared with Fe(25)ZnO. The free radicals contained in Fe(25)ZIF-8 were not optimally able to degrade MB compared with the free radicals contained in Fe(25)ZnO. This result further confirms that the mesoporous structure is important properties to improve the photocatalytic performance which is in line with the FESEM results. The bulk structure of Fe(25)ZIF-8 causes a volume recombination which hinder the production of active species. Besides, the abundant of active species was caused by the lower recombination volume owing to the presence of mesoporous structure in Fe(25)ZnO. Furthermore the presence of n–n heterojunction system between two semiconductors (ZnO and α-Fe2O3) could also improve photocatalytic performance in Fe(25)ZnO.
Photocatalytic mechanism
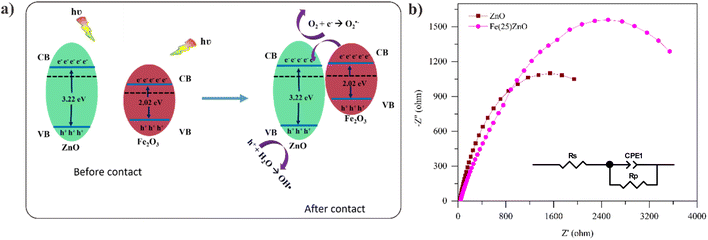
The excellent photocatalytic activity was attributed to the effective charge separation and migration across the interface of Fe(25)ZnO. Thus, the photocatalytic mechanism of Fe(25)ZnO was illustrated in Fig. 15a. By referring to the characterization results of UV-vis DRS, it was found that the Eg values of ZnO and α-Fe2O3 were of 3.22 and 2.02 eV, respectively. Furthermore, the ECB and EVB was calculated based on eqn (5) and (6):4| EVB = X − Ee + 0.5 Eg | (5) |
| ECB = EVB − Eg | (6) |
α-Fe2O3 and ZnO are n-type semiconductor materials, where in n-type semiconductor the impurities are close to the CB. The addition of α-Fe2O3 to ZnO causes beneficial defects. When contact occurs, there will be a transfer of electrons from the Fermi level of ZnO to α-Fe2O3 until the Fermi level is equalized and creates an electric field that is effective for charge separation thus the CB α-Fe2O3 higher than that of CB ZnO.75,76 Therefore, transfer electron was occurred from CB α-Fe2O3 to CB ZnO while the hole was remained in VB α-Fe2O3. The transfer of electron from CB α-Fe2O3 to ZnO was followed by reduced O2 to radical ˙O2−. On the other hand, the holes in the VB ZnO oxidized the H2O into a radical ˙OH, as a result of the EVB value of ZnO (2.86 eV) more positive than the potential value of H2O/˙OH (2.34 eV) based on eqn (5).
The proposed degradation process steps are:
| Fe(25)ZnO + hν → h+ + e− | (7) |
| H2O + h+ → ˙OH + H+ | (8) |
| O2 + e− → ˙O2− | (9) |
| ˙O2− + 2H+ → H2O2 | (10) |
| H2O2 → 2 ˙OH | (11) |
| MB + ˙OH → product of degradation | (12) |
| MB + ˙O2− → product of degradation | (13) |
| MB + h+ → product of degradation | (14) |
| MB + e− → product of degradation | (15) |
EIS analysis was performed to further investigate the charge carriers transfer in ZnO and Fe(25)ZnO.
As presented in Fig. 15b, ZnO shows a smaller arc radius compared to Fe(25)ZnO. A smaller arc radius suggests the more efficient charge transfer capability, which further facilitate the separation of charge carriers.77 Further analysis over the Nyquist plots resulted in the fitted circuit and the corresponding Rs, RCT and CPE values as tabulated in Table 8.
| Material | Rs (ohm) | RCT (ohm) | CPE |
|---|---|---|---|
| ZnO | 31.4 | 3013 | 0.8 |
| Fe(25)ZnO | 38.64 | 5181 | 0.67 |
The CPE values are 0.80 and 0.67 for ZnO and Fe(25)ZnO, respectively, which indicates the nature of pseudocapacitor for both material. Meanwhile, the R represents the resistance, either the resistance from the solution (Rs) or charge transfer resistance (RCT) within materials.3,5 For both Rs and RCT, ZnO shows lower values compared to Fe(25)ZnO, which indicates the lower resistance in ZnO. However, we may note that the discrepancies in RCT values of ZnO and Fe(25)ZnO is much higher than in Rs values, which suggest that the charge transfer resistance play a more significant role at determining the total resistance in ZnO and Fe(25)ZnO. Meanwhile, Based on PL spectra Fe(25)ZnO shows a better suppression of charge carriers' recombination than ZnO. Actually, the Fe(25)ZnO has superior photocatalytic performance than pristine ZnO caused by differences of morphology. As presented in the FESEM results in Fig. 4b and d, Fe(25)ZnO has porous morphology while the pristine ZnO shows more bulky structure. The porous morphology can be beneficial for the charge separation efficiency since the photogenerated electron and holes can easily reach the photocatalyst surface to contact with the reactant molecules. In contrast, in the bulk morphology, as is ZnO, the photogenerated electron and holes need a longer pathway to reach the photocatalyst surface, which increases the occurrence of the volume recombination.78 Therefore, despite the lower charge transfer resistance in ZnO, this material shows an inferior performance compared to Fe(25)ZnO due to the volume recombination.
Reusability and stability
The stability of the photocatalyst is also vital performance variable for practical applications. The recycling test of Fe(25)ZIF-8 and Fe(25)ZnO was investigated to reveal the stability after several degradation in MB solution. Before recycling test, Fe(25)ZIF-8 and Fe(25)ZnO was collected from the MB solution by means of centrifugation then washed with methanol and ethanol several times, dried and applied in the next reactions.79 The reusability of Fe(25)ZnO was better than Fe(25)ZIF-8 after three successive cycles (Fig. 16a). It was exhibited that the degradation efficiency of Fe(25)ZnO remained at higher than 95%, however the degradation efficiency of Fe(25)ZIF-8 was decreased until 70%. After recycling, Fe(25)ZIF-8 and Fe(25)ZnO were characterized by XRD as shown in Fig. 16b and c to determine the structure changes. There were no new diffraction peaks and characteristic peaks of Fe(25)ZnO still maintained after recycling (Fig. 16c), meanwhile the characteristic peak of Fe(25)ZIF-8 was not seen in the diffractogram after treatment (Fig. 16b). Thus, MOF-derived metal oxide composites have better photodegradation activity and stability than MOF composites which correlate with the presence of mesoporous heterojunction.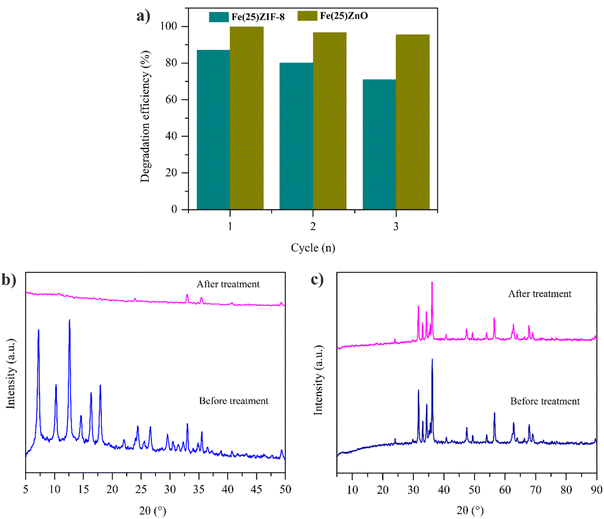 | ||
| Fig. 16 (a) Reusability of Fe(25)ZIF-8 and Fe(25)ZnO for degradation of MB in solution (b) XRD pattern before and after recycle of Fe(25)ZIF-8 (c) XRD pattern before and after recycle of Fe(25)ZnO. | ||
Conclusions
In summary, mesoporous heterojunction α-Fe2O3/ZnO composites were successfully prepared by simply calcination of α-Fe2O3/ZIF-8. The as-prepared Fe(25)ZIF-8 and Fe(25)ZnO exhibit spherical morphology with high and low density, respectively. α-Fe2O3/ZnO composites demonstrate a more effective photocatalytic performance of MB degradation than α-Fe2O3/ZIF-8 composites. The kinetic experiments confirmed that the photocatalytic process followed first order model. The photocatalytic rate of Fe(25)ZnO was 0.0347 min−1, which was about 4.7 fold than pristine ZIF-8. The photocatalytic enhancement of MB over Fe(25)ZnO could be attributed to synergistic effect between mesoporous structure with n–n heterojunction system providing the chance for better MB adsorption and minimize the charge of volume recombination. In addition, the trapping experiment showed that hole and ˙OH are the main active species.Conflicts of interest
There are no conflicts to declare.Acknowledgements
The authors gratefully acknowledge funding from the Ministry of Education, Culture, Research and Technology, Indonesia, through Thesis Magister Research Grant with contract no. 1455/PKS/ITS/2022. The authors also acknowledge the Material Chemistry and Energy Laboratory, Department of Chemistry, Institut Teknologi Sepuluh Nopember (ITS) Surabaya, for facilities supporting this work.Notes and references
- F. Achouri, S. Corbel, A. Aboulaich, L. Balan, A. Ghrabi, M. Ben Said and R. Schneider, J. Phys. Chem. Solids, 2014, 75, 1081–1087 CrossRef CAS.
- P. Dhiman, A. Kumar, M. Shekh, G. Sharma, G. Rana, D. V. N. Vo, N. AlMasoud, M. Naushad and Z. A. ALOthman, Environ. Res., 2021, 197, 111074 CrossRef CAS.
- Y. Liu, L. Sun, J. Wu, T. Fang, R. Cai and A. Wei, Mater. Sci. Eng. B: Solid-State Mater. Adv. Technol., 2015, 194, 9–13 CrossRef CAS.
- R. Subagyo, H. Tehubijuluw, W. Prasetyo Utomo, H. Dwi Rizqi, Y. Kusumawati, H. Bahruji and D. Prasetyoko, Arabian J. Chem., 2022, 15, 103754 CrossRef CAS.
- B. Tatykayev, F. Donat, H. Alem, L. Balan, G. Medjahdi, B. Uralbekov and R. Schneider, ACS Omega, 2017, 2, 4946–4954 CrossRef CAS PubMed.
- S. Huang, J. Zhao, C. Wu, X. Wang, S. Fei, Q. Zhang, Q. Wang, Z. Chen, K. Uvdal and Z. Hu, Chem. Eng. Sci., 2019, 209, 115185 CrossRef CAS.
- T. T. Minh, N. T. T. Tu, T. T. Van Thi, L. T. Hoa, H. T. Long, N. H. Phong, T. L. M. Pham and D. Q. Khieu, J. Nanomater., 2019, 2019, 5198045 Search PubMed.
- S. Bazazi, N. Arsalani, A. Khataee and A. Goljanian, J. Ind. Eng. Chem., 2018, 62, 265–272 CrossRef CAS.
- S. Payra, S. Challagulla, Y. Bobde, C. Chakraborty, B. Ghosh and S. Roy, J. Hazard. Mater., 2019, 373, 377–388 CrossRef CAS PubMed.
- A. Faraji, N. Mehrdadi, N. M. Mahmoodi, M. Baghdadi and A. Pardakhti, J. Mol. Struct., 2020, 1223, 129028 CrossRef.
- T. Luttrell, S. Halpegamage, J. Tao, A. Kramer, E. Sutter and M. Batzill, Sci. Rep., 2015, 4, 1–8 Search PubMed.
- Z. Gu, B. Zhang, Y. Asakura, S. Tsukuda, H. Kato, M. Kakihana and S. Yin, Appl. Surf. Sci., 2020, 521, 146213 CrossRef CAS.
- F. Mu, B. Dai, W. Zhao, L. Zhang, J. Xu and X. Guo, Chin. Chem. Lett., 2020, 31, 1773–1781 CrossRef CAS.
- A. A. Fauzi, A. A. Jalil, N. S. Hassan, F. F. A. Aziz, M. S. Azami, I. Hussain, R. Saravanan and D. N. Vo, Chemosphere, 2021, 286, 131651 CrossRef.
- Q. Wei, J. Sun, P. Song, J. Li, Z. Yang and Q. Wang, Sens. Actuators, B, 2020, 317, 128205 CrossRef CAS.
- R. X. Chen, S. L. Zhu, J. Mao, Z. D. Cui, X. J. Yang, Y. Q. Liang and Z. Y. Li, Int. J. Photoenergy, 2015, 2015, 183468 Search PubMed.
- R. Lei, H. Ni, R. Chen, B. Zhang, W. Zhan and Y. Li, Chem. Phys. Lett., 2017, 673, 1–6 CrossRef CAS.
- A. Bouziani, J. Park and A. Ozturk, J. Photochem. Photobiol., A, 2020, 400, 112718 CrossRef CAS.
- L. Chen, H. F. Wang, C. Li and Q. Xu, Chem. Sci., 2020, 11, 5369–5403 RSC.
- Y. Wang, X. Liu, L. Guo, L. Shang, S. Ge, G. Song, N. Naik, Q. Shao, J. Lin and Z. Guo, J. Colloid Interface Sci., 2021, 599, 566–576 CrossRef CAS.
- G. Peña-Velasco, L. Hinojosa-Reyes, G. A. Morán-Quintanilla, A. Hernández-Ramírez, M. Villanueva-Rodríguez and J. L. Guzmán-Mar, Ceram. Int., 2021, 47, 24632–24640 CrossRef.
- J. Zheng, L. Sun, C. Jiao, Q. Shao, J. Lin, D. Pan, N. Naik and Z. Guo, Colloids Surf., A, 2021, 623, 126629 CrossRef CAS.
- Y. Zhang, J. Zhou, X. Chen, Q. Feng and W. Cai, J. Alloys Compd., 2019, 777, 109–118 CrossRef CAS.
- J. Xu, S. Liu and Y. Liu, RSC Adv., 2016, 6, 52137–52142 RSC.
- J. Xu, J. Gao, Y. Liu, Q. Li and L. Wang, Mater. Res. Bull., 2017, 91, 1–8 CrossRef CAS.
- X. Yang, L. Qiu and X. Luo, RSC Adv., 2018, 8, 4890–4894 RSC.
- P. Zhu, X. Yin, X. Gao, G. Dong, J. Xu and C. Wang, Chin. J. Catal., 2020, 42, 175–183 CrossRef.
- K. C. Devarayapalli, S. V. P. Vattikuti, K. S. Yoo, P. C. Nagajyothi and J. Shim, J. Electroanal. Chem., 2020, 878, 114634 CrossRef CAS.
- E. Santoso, R. Ediati, Z. Istiqomah, D. O. Sulistiono, R. E. Nugraha, Y. Kusumawati, H. Bahruji and D. Prasetyoko, Microporous Mesoporous Mater., 2021, 310, 110620 CrossRef CAS.
- P. Hu, C. Chen, J. Song and Z. Tang, Mater. Sci. Semicond. Process., 2018, 77, 40–49 CrossRef CAS.
- N. Mostafa Marzouk, A. O. Abo El Naga, S. A. Younis, S. A. Shaban, A. M. El Torgoman and F. Y. El Kady, J. Environ. Chem. Eng., 2021, 9, 105035 CrossRef CAS.
- P. Liang, C. Zhang, H. Sun, S. Liu, M. Tadé and S. Wang, RSC Adv., 2016, 6, 95903–95909 RSC.
- N. M. Mahmoodi, S. Keshavarzi, M. Oveisi, S. Rahimi and B. Hayati, J. Mol. Liq., 2019, 291, 111333 CrossRef CAS.
- A. Anžlovar, Z. Crnjak Orel, K. Kogej and M. Žigon, J. Nanomater., 2012, 2012, 760872 Search PubMed.
- M. S. Azmina, R. M. Nor, H. A. Rafaie, N. S. A. Razak, S. F. A. Sani and Z. Osman, Appl. Nanosci., 2017, 7, 885–892 CrossRef CAS.
- R. M. Mohamed and A. Shawky, Opt. Mater., 2022, 124, 112012 CrossRef CAS.
- J. Abdi, N. M. Mahmoodi, M. Vossoughi and I. Alemzadeh, Microporous Mesoporous Mater., 2019, 273, 177–188 CrossRef CAS.
- W. S. Chiu, P. S. Khiew, M. Cloke, D. Isa, T. K. Tan, S. Radiman, R. Abd-Shukor, M. A. A. Hamid, N. M. Huang, H. N. Lim and C. H. Chia, Chem. Eng. J., 2010, 158, 345–352 CrossRef CAS.
- D. A. Ali, E. E. El-Katori and E. A. Kasim, Z. Phys. Chem., 2021, 235, 239–263 CrossRef CAS.
- C. Chen, W. Bi, Z. Xia, W. Yuan and L. Li, ACS Omega, 2020, 5, 13185–13195 CrossRef CAS PubMed.
- P. Nandi and D. Das, Appl. Surf. Sci., 2019, 465, 546–556 CrossRef CAS.
- Y. T. Prabhu, V. Navakoteswara Rao, M. V. Shankar, B. Sreedhar and U. Pal, New J. Chem., 2019, 43, 6794–6805 RSC.
- A. Kubiak, S. Żółtowska, E. Gabała, M. Szybowicz, K. Siwińska-Ciesielczyk and T. Jesionowski, Powder Technol., 2021, 386, 221–235 CrossRef CAS.
- N. Chang, Y. R. Chen, F. Xie, Y. P. Liu and H. T. Wang, Microporous Mesoporous Mater., 2020, 307, 110530 CrossRef CAS.
- H. Kaur, G. C. Mohanta, V. Gupta, D. Kukkar and S. Tyagi, J. Drug Delivery Sci. Technol., 2017, 41, 106–112 CrossRef CAS.
- A. Chakraborty, D. A. Islam and H. Acharya, J. Solid State Chem., 2019, 269, 566–574 CrossRef CAS.
- N. A. Rodríguez, R. Parra and M. A. Grela, SN Appl. Sci., 2020, 2, 1–9 Search PubMed.
- D. K. L. Harijan, S. Gupta, S. K. Ben, A. Srivastava, J. Singh and V. Chandra, Phys. B, 2022, 627, 413567 CrossRef CAS.
- M. Al-Haddad, A. Shawky and I. A. Mkhalid, J. Taiwan Inst. Chem. Eng., 2021, 123, 284–292 CrossRef CAS.
- N. M. Shooshtari and M. M. Ghazi, Chem. Eng. J., 2017, 315, 527–536 CrossRef CAS.
- P. Chamoli, R. K. Shukla, A. N. Bezbaruah, K. K. Kar and K. K. Raina, Appl. Surf. Sci., 2021, 555, 149663 CrossRef CAS.
- X. Zeng, L. Huang, C. Wang, J. Wang, J. Li and X. Luo, ACS Appl. Mater. Interfaces, 2016, 8, 20274–20282 CrossRef CAS.
- Z. Ma, F. Ren, Y. Deng and A. A. Volinsky, Optik, 2020, 219, 165204 CrossRef CAS.
- C. Liu, Y. Qiu, F. Wang, K. Wang, Q. Liang and Z. Chen, Adv. Mater. Interfaces, 2017, 4, 1–11 CrossRef.
- X. Cheng, S. Cao, Y. Huan, Z. Bai, M. Li, H. Wu, R. Zhang, W. Peng, Z. Ji and X. Yan, Energy Technol., 2018, 7, 1800899 CrossRef.
- Y. Dong, T. Hu, M. Pudukudy, H. Su, L. Jiang, S. Shan and Q. Jia, Mater. Chem. Phys., 2020, 251, 123060 CrossRef CAS.
- A. Khandelwal, N. Narayanan, E. Varghese and S. Gupta, Bull. Environ. Contam. Toxicol., 2020, 104, 503–510 CrossRef CAS PubMed.
- H. Dai, X. Yuan, L. Jiang, H. Wang, J. Zhang and J. Zhang, Coord. Chem. Rev., 2021, 441, 213985 CrossRef CAS.
- W. Aulia, A. Ahnaf, M. Y. Irianto, R. Ediati, R. M. Iqbal, R. A. Rachman and U. T. I. Martia, IPTEK J. Technol. Sci., 2020, 31, 18 CrossRef.
- L. A. Calzada, R. Castellanos, L. A. García and T. E. Klimova, Microporous Mesoporous Mater., 2019, 285, 247–258 CrossRef CAS.
- A. Chakraborty, D. A. Islam and H. Acharya, J. Solid State Chem., 2019, 269, 566–574 CrossRef CAS.
- S. S. Cui, X. Liu, Y. B. Shi, M. Y. Ding and X. F. Yang, Rare Met., 2022, 41, 2405–2416 CrossRef CAS.
- P. Y. Kuang, Y. Z. Su, G. F. Chen, Z. Luo, S. Y. Xing, N. Li and Z. Q. Liu, Appl. Surf. Sci., 2015, 358, 296–303 CrossRef CAS.
- S. Sun, M. Sun, Y. Kong, Y. Fang and Y. Yao, J. Sol-Gel Sci. Technol., 2016, 80, 719–727 CrossRef CAS.
- A. Norouzi and A. Nezamzadeh-Ejhieh, Phys. B, 2020, 599, 412422 CrossRef CAS.
- J. Zhang, X. Xu, W. Zhang, Y. Huang and P. Zhang, Spectrochim. Acta, Part A, 2022, 274, 121103 CrossRef CAS PubMed.
- Z. Yang, J. Zhang, W. Zhang, Q. Zhou, J. Shen and Y. Huang, J. Clean. Prod., 2023, 382, 135391 CrossRef CAS.
- G. Fan, J. Luo, L. Guo, R. Lin, X. Zheng and S. A. Snyder, Chemosphere, 2018, 209, 44–52 CrossRef CAS.
- A. Sekar and R. Yadav, Optik, 2021, 242, 167311 CrossRef CAS.
- P. Muhambihai, V. Rama and P. Subramaniam, Environ. Nanotechnol., Monit. Manage., 2020, 14, 100360 Search PubMed.
- X. H. Yi, F. X. Wang, X. D. Du, H. Fu and C. C. Wang, Polyhedron, 2018, 152, 216–224 CrossRef CAS.
- E. Amdeha and R. S. Mohamed, Environ. Technol., 2021, 42, 842–859 CrossRef CAS PubMed.
- D. Tuncel and A. N. Ökte, Catal. Today, 2019, 328, 149–156 CrossRef CAS.
- X. F. Cao, P. Yue, Q. R. Wei, Y. F. Dang, S. Q. Zhang, Z. X. Wei and R. Z. Wang, J. Mater. Sci., 2021, 56, 7862–7878 CrossRef CAS.
- L. G. da Trindade, G. Y. Hata, J. C. Souza, M. R. S. Soares, E. R. Leite, E. C. Pereira, E. Longo and T. M. Mazzo, J. Mater. Sci., 2020, 55, 2923–2936 CrossRef CAS.
- A. M. Tama, S. Das, S. Dutta, M. D. I. Bhuyan, M. N. Islam and M. A. Basith, RSC Adv., 2019, 9, 40357–40367 RSC.
- W. P. Utomo, H. Wu and Y. H. Ng, Small, 2022, 18, 2270131 CrossRef.
- D. Hartanto, G. Yuhaneka, W. P. Utomo, A. I. Rozafia, Y. Kusumawati, W. Dahani and A. Iryani, RSC Adv., 2022, 12, 5665–5676 RSC.
- A. R. P. Hidayat, D. O. Sulistiono, I. K. Murwani, B. F. Endrawati, H. Fansuri, L. L. Zulfa and R. Ediati, J. Environ. Chem. Eng., 2021, 9, 106675 CrossRef CAS.
| This journal is © The Royal Society of Chemistry 2023 |

