 Open Access Article
Gateway toward efficient and miniaturized A2B2O7-type fluorite structure-based energy storage devices
Abdul Quader ab,
Ghulam M. Mustafac,
Shahid M. Ramayd and
Shahid Atiq
 *a
*a
aCentre of Excellence in Solid State Physics, University of the Punjab, Lahore, Pakistan. E-mail: satiq.cssp@pu.edu.pk
bInstitute of Physics, The Islamia University Bahawalpur, Bahawalpur, Pakistan
cDepartment of Physics, Division of Science and Technology, University of Education, Lahore, 54770, Pakistan
dPhysics and Astronomy Department, College of Science, King Saud University, Riyadh, Saudi Arabia
First published on 7th March 2023
Abstract
Defect fluorite structure with A2B2O7 composition exhibits an intense potential for utilization in modern smart electrical devices. Efficient energy storage with low loss factors like leakage current makes them a prominent candidate for energy storage applications. Here we report a series of the form Nd2−2xLa2xCe2O7 with x = 0.0, 0.2, 0.4, 0.6, 0.8, and 1.0, synthesized via a sol–gel auto-combustion route. The fluorite structure of Nd2Ce2O7 is slightly expanded with the incorporation of La without any phase transformation. A gradual replacement of Nd with La causes a decrease in grain size, which increases the surface energy and thus leads to grain agglomeration. The formation of exact composition without any impurity element is confirmed by energy-dispersive X-ray spectra. The polarization versus electric field loops, energy storage efficiency, leakage current, switching charge density, and normalized capacitance, which are considered key features of any ferroelectric material, are comprehensively examined. The highest energy storage efficiency, low leakage current, small switching charge density, and large value of normalized capacitance are observed for pure Nd2Ce2O7. This reveals the enormous potential of the fluorite family for efficient energy storage devices. The temperature-dependent magnetic analysis exhibited very low transition temperatures throughout the series.
1. Introduction
The discovery of ferroelectric phenomena in 1920 by Rochelle Salt brought ferroelectric materials to the verge of technological innovation and opened a new door for their applications in many fields like electromechanical systems, memory devices, and radio frequency devices.1,2 The ferroelectric materials exhibit polarization even in the absence of an applied electric field, known as remanent polarization.3 In memory devices, positive remanent polarization is treated as 1 and negative as 0 state.4 Many ferroelectric devices like ferroelectric random-access memory (FERAM) and energy storage devices are designed using materials belonging to pyrochlore, perovskite, and fluorite structures.5 However, with the discovery of ferroelectricity in fluorite structure in 2011, modern researchers put their attention to using these materials for advanced applications because of their low dielectric constant, simple structure, low leakage current, and small unit cell volume compared to perovskite and pyrochlore materials.6,7 Ongoing development in smart electronic devices makes fluorite structure more imperative than others to be utilized for micromechanical and fast-switching applications.8Generally, materials with fluorite structure are considered binary oxides with the general formula AO2.9 It is also found in the form of A2O4, A4O8, AA′O4, AA′BB′O8,  , A2B2O8, and A2BB′O8. All these families of fluorite structures belong to the Fm3m space group.10 Recently, it has been observed that ternary metal oxides such as A2B2O7 (ABO) also exhibit a defect-fluorite structure with one oxygen vacancy.11 The structure of the ABO-type compounds depends upon the cationic radius ratio of B and A-site cations. If the cationic radius ratio is greater than 1.3, it exhibits a pyrochlore structure, while if it is less than 1.3, then it transforms into a fluorite structure.12 The structure of ABO fluorite compounds looks identical to the pyrochlore structure, with a different number of formula units in a unit cell. In fluorite structure, there are 4 formula units in a unit cell, while in pyrochlore structure, there are 8 formula units in a unit cell. This is the reason the lattice parameters of the ABO fluorite structure are almost half of the lattice parameters of the pyrochlore structure.13 In addition, the crystallographic visualization also helps to distinguish these two structures based on occupancy of Wyckoff positions by cations and anions in three different ways,14 (i) the A and B-site cations in pyrochlore structure occupy 16c and 16d sites, respectively while in the fluorite structure both A and B-site cations occupy a single 4a site, (ii) the oxygen anions in pyrochlore structure lie at 48f site with coordinates (x, 1/8,1/8) while in fluorite structure, it lies at 8c site with coordinates (1/4,1/4,1/4), and (iii) the oxygen anion which lies at 8b site in pyrochlore structure moves to 4a site in fluorite structure.15 Due to these differences, the A and B-site cations are surrounded by 8 and 6 anions, respectively, in pyrochlore structure which transforms to an average of 7 coordinates in fluorite structure. This structural flexibility of ABO-type materials makes them prominent to be utilized in photoluminescence, anti-erosion applications, thermal barrier coating, magnetic devices, nuclear waste management, electrical device, gas sensors, and high-temperature catalysts.16 Besides, the high dielectric constant, less energy loss, high power, and large energy density of ABO-based fluorites inspired us to investigate their new compositions for energy storage devices and fast-switching applications.17
In the recent past, ferroelectric and dielectric properties of ABO materials grabbed vast interest for their possible applications in smart and efficient electronic devices. For instance, the ferroelectric, dielectric, and piezoelectric properties of rare-earth doped fluorite oxides were studied by Zhou et al., and they reported that the main cause of spontaneous polarization in fluorite structure was the rotation of octahedral oxygen and displacement of A-site ions.18 Recently, Lee et al. reviewed the role of domains and domain dynamics on the ferroelectric properties of fluorite structure and proposed its utilization for ferroelectric field effect transistors due to switching of polarization by nucleation process in the fluorite structure.19 As temperature plays a vital role in the ferroelectricity of any material, so, Park et al. investigated the kinetic and thermodynamic origin of ferroelectricity in fluorite structure and proposed a long-term device performance of the fluorite structure.20 Meanwhile, as the size of the fluorite structure is almost half of the pyrochlore structure of ABO, therefore, Ali et al. explored the fluorite structure as a gateway of smart electronic devices due to its ferroelectric and antiferroelectric properties.21 Moreover, antiferroelectric/ferroelectric type electrostatic nanocapacitors bearing fluorite structures have also been investigated by the same research group for energy storage applications.1 The effect of static magnetic field and temperature has also been studied by Quader et al. on the dielectric properties of ABO fluorite structure.22 Hence, a wide range of investigations of fluorite structures, especially in the field of ferroelectric energy storage applications, inspired us to investigate new ABO fluorite structures that can enhance the efficiency of energy storage devices. Therefore, in the present communication, our prime focus is to investigate the effect of La substitution in Nd2Ce2O7 defected fluorite structure on its energy storage capabilities without compromising any phase transformation.
2. Experimental
Fluorite structure can be synthesized using various chemical routes, for instance, the hydrothermal method, solid-state method, and sol–gel auto-combustion method. However, here we used sol–gel auto-combustion approach to synthesize a series of Nd2−2xLa2xCe2O7 with (x = 0.0, 0.2, 0.4, 0.6, 0.8, and 1.0) because it is simple to execute, inexpensive, and ensures crystalline phase in a quick time. To proceed, La(NO3)3·6H2O [purity > 99%], Nd(NO3)3·6H2O [purity > 99%], and Ce(NO3)3·6H2O [purity > 99%] were utilized as precursors along with fuel agents such as urea (CH4N2O) and glycine (C2H5NO2). All the chemicals were purchased from Sigma Aldrich. The metal nitrates to fuel agent's ratio was maintained as 1![[thin space (1/6-em)]](https://www.rsc.org/images/entities/char_2009.gif) :
:![[thin space (1/6-em)]](https://www.rsc.org/images/entities/char_2009.gif) 2. The stoichiometric amounts of all the precursors were weighed using a precise digital balance and dissolved separately into deionized water. The individual transparent solutions were combined into a beaker. The beaker was then placed on the hot plate with a magnetic stirrer inside it. The hotplate temperature was set at 95 °C, and stirred magnetically at 320 rpm. The solution thickened over time as a result of the continuous elimination of fumes. The solution was kept on the hot plate till stirring became difficult. Then, the stirring was stopped, magnetic stirrer was taken out, and in a few moments, frothing started that converted viscous liquid into gel. To eliminate the nitrogenous gases from the gel and to trigger the auto-combustion process, the hot plate's temperature was gradually increased up to 310 °C.23 At this temperature urea and glycine catch fire and causes auto-combustion. This combustion yields the CO2, NO2, and water vapors according to the following balanced chemical equations:
2. The stoichiometric amounts of all the precursors were weighed using a precise digital balance and dissolved separately into deionized water. The individual transparent solutions were combined into a beaker. The beaker was then placed on the hot plate with a magnetic stirrer inside it. The hotplate temperature was set at 95 °C, and stirred magnetically at 320 rpm. The solution thickened over time as a result of the continuous elimination of fumes. The solution was kept on the hot plate till stirring became difficult. Then, the stirring was stopped, magnetic stirrer was taken out, and in a few moments, frothing started that converted viscous liquid into gel. To eliminate the nitrogenous gases from the gel and to trigger the auto-combustion process, the hot plate's temperature was gradually increased up to 310 °C.23 At this temperature urea and glycine catch fire and causes auto-combustion. This combustion yields the CO2, NO2, and water vapors according to the following balanced chemical equations:| 2CH4N2O + 7O2 = 2CO2 + 4H2O + 4NO2 | (1) |
| 4C2H5NO2 + 13O2 = 8CO2 + 10H2O + 4NO2 | (2) |
The hitting of this temperature gave birth to the flame inside the beaker, which instantly burnt all the gel and converted it into ash. As a result of this combustion, the temperature inside the beaker promptly increased which lead to the following reaction for parent composition to occur:
| 4Ce(NO3)3 + 4Nd(NO3)3 = 2Nd2Ce2O7 + 24NO2 + 5O2 | (3) |
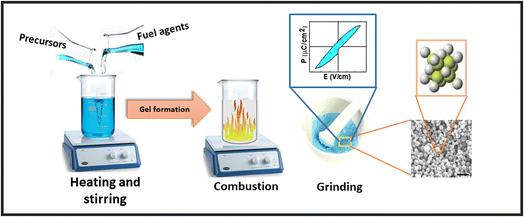
The molecular oxygen (O2) and nitrogen dioxide (NO2) were evolved as a byproduct in this reaction. For subsequent samples, the stoichiometric amount of La(NO3)3·6H2O was substituted at Nd(NO3)3·6H2O site. After that, the ash was put into an Agate mortar and pestle for grinding and converted into fine powder. The synthesized powder was then placed into ceramic cups and calcined at 800 °C for 3 h in a Nabertherm furnace to develop a pure phase.24 This calcined powder was pressed using an Apex hydraulic press to make cylindrical pellets of 7 mm diameter and ∼1 mm thickness by applying a force of 30 kN. All the pellets were then sintered at 350 °C for 1 h to make them hard.25 The pictorial representation of this whole synthesis process is shown in Fig. 1.
An advanced Bruker D8 X-ray diffractometer (XRD) was used to analyze the crystalline phase of the synthesized series. A Nova NanoSEM-450 field emission scanning electron microscope (FESEM) was utilized to investigate the morphology and elemental composition. A Radiant's Technologies Inc., USA precision multiferroic tester was used to probe ferroelectric properties. Magnetic properties of synthesized series have been carried out by Cryogenic vibrating samples magnetometer (VSM).
3. Results and discussion
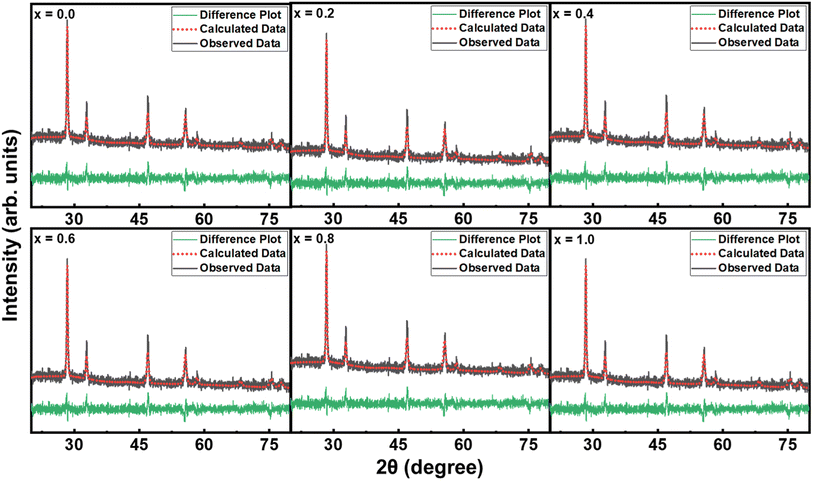
The crystal structure is one of the key parameters which helps to control a material's characteristics. In the present communication, the crystal structure was analyzed using Cu Kα radiations with wavelength 1.54 Å obtained at 40 kV. The indexed XRD patterns of Nd2−2xLa2xCe2O7 (x = 0.0, 0.2, 0.4, 0.6, 0.8, and 1.0) in the 2θ range of 20–80° are shown in Fig. 2. The patterns were indexed using the analytical approach as described by B. D. Cullity.26 In the XRD pattern of pure Nd2Ce2O7 (NCO), the diffracted intensity peaks were observed at 2θ values of 28.3°, 32.6°, 46.6°, 55.1°, 57.7°, 67.6° and 74.7° which were identified as emerging from (111), (002), (022), (113), (222), (400), and (133) planes, respectively and were well matched with inorganic crystal structure database (ICSD) reference card #01-075-0156 exhibiting a fluorite structure.27 No impurity peaks were seen that confirmed the formation of a pure fluorite phase of parent NCO.28,29 When La was introduced at Nd-site, it did not give birth to any new peak; however, the peaks already present in the diffraction patterns slightly moved toward lower 2θ values, which predicted the stability and expansion of the fluorite unit cell with the substitution of La. This unit cell expansion continued as we proceeded further in the series. This shifting of peaks is quite significant when we look at the diffracted pattern in the narrow 2θ range, as presented in Fig. 2(b).30 The lattice constants calculated for all the samples are plotted in Fig. 3(a), which reveal that lattice parameter (a) is slightly increased up to 5.56 Å from 5.54 Å by substituting La at the Nd-site. This increase in lattice parameter is attributed to the minutely larger ionic radius of La3+ (1.160 Å) as compared to Nd3+ (1.109 Å).31 The calculation of lattice parameters leads to calculating the unit cell volume, X-ray density, and porosity of the samples. However, the calculation of porosity requires pre-calculation of bulk density which was determined by measuring the mass and volume of samples in the pellet form. In addition to all these parameters, the extent of crystallization is mapped by calculating the crystallite size using Scherrer's formula. The computed values of all these parameters are presented in Table 1, where the variation in various physical parameters like bulk and X-ray densities, crystallite size, and porosity with substitution contents of La is presented in Fig. 3.
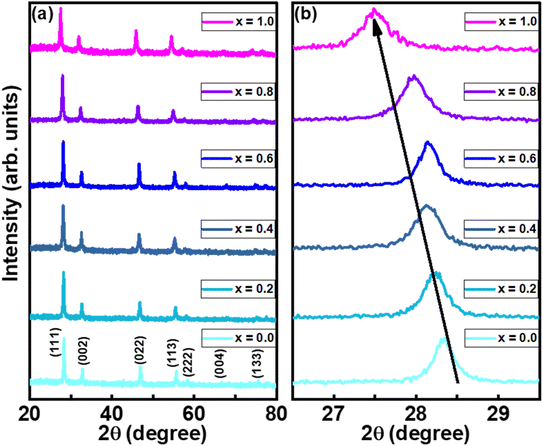 | ||
| Fig. 2 (a) XRD patterns of Nd2−2xLa2xCe2O7 (x = 0, 0.2, 0.4, 0.6, 0.8, and 1.0), and (b) shifting of (111) peak towards smaller 2θ values with substitution contents. | ||
 | ||
| Fig. 3 (a) Variation in lattice constant, (b) bulk and X-rays densities and, (c) porosity and crystallite size as a function of substitution contents. | ||
| Nd2−2xLa2xCe2O7, x= | Lattice constant (Å) | Crystallite size (nm) | Bulk density (g cm−3) | X-rays density (g cm−3) | Porosity (%) |
|---|---|---|---|---|---|
| 0.0 | 5.524 | 46 | 3.39 | 5.36 | 26.18 |
| 0.2 | 5.531 | 38 | 3.41 | 5.32 | 35.89 |
| 0.4 | 5.537 | 34 | 3.41 | 5.29 | 35.58 |
| 0.6 | 5.542 | 42 | 3.60 | 5.26 | 31.52 |
| 0.8 | 5.556 | 37 | 3.41 | 5.21 | 34.40 |
| 1.0 | 5.562 | 34 | 3.51 | 5.17 | 32.20 |
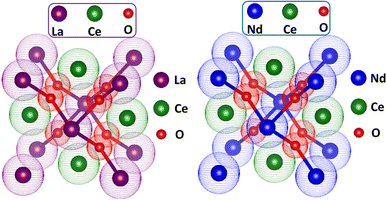
To evaluate the reliability of structural data, the Rietveld refinement of all XRD patterns was carried out using Profex software. The working of this software involves the matching of diffracted data of the sample with the standard data in terms of peak intensity, peak position, full width at half maxima, and generating the difference plot. In addition, it generates the value of lattice parameters, unit cell volume, atomic positions, Wyckoff positions, different profile factors, and goodness of fit.32 The Rietveld refinement patterns are presented in Fig. 4, where it has been observed that all peaks were well matched with the reference pattern. The formation of the pure phase for all the compositions was confirmed because no considerable distortion appeared in any sample. The green line in the figure depicts the difference plot between the calculated and observed data where a minute change in intensity of peaks appeared, which may be due to some sort of defective state or vacancies in samples. This refinement was quantified in terms of profile factors like R-profile, R-expected, R-Bragg, weighted R-profile, and goodness of fit (χ), as shown in Table 2. The numerical value of χ is an ultimate parameter that determines the reliability of Rietveld refinement. The value of χ for all samples was less than 2. In the present communication, the smaller value of χ confirmed the formation of the pure desired crystalline phase for all the samples. The unit cell of pure LCO and NCO are presented in Fig. 5.
| Sample Nd2−xLa2−2xCe2O7 | x = 0.0 | x = 0.2 | x = 0.4 | x = 0.6 | x = 0.8 | x = 1.0 |
|---|---|---|---|---|---|---|
| Cell parameters | ||||||
| a = b = c (Å) | 5.524 | 5.531 | 5.537 | 5.542 | 5.556 | 5.562 |
| Volume (Å)3 | 168.56 | 169.20 | 169.75 | 170.21 | 171.51 | 172.06 |
| α = β = γ | 90 | 90 | 90 | 90 | 90 | 90 |
![[thin space (1/6-em)]](https://www.rsc.org/images/entities/char_2009.gif) |
||||||
| R-Factors (%) | ||||||
| Rexp | 13.63 | 13.04 | 12.14 | 13.21 | 12.55 | 12.68 |
| Rwp | 15.06 | 16.68 | 15.85 | 15.65 | 19.30 | 16.41 |
| χ2 | 1.22 | 1.6362 | 1.705 | 1.403 | 2.365 | 1.674 |
| GoF (χ) | 1.105 | 1.279 | 1.306 | 1.185 | 1.537 | 1.294 |
FESEM images of all the samples were taken at 200![[thin space (1/6-em)]](https://www.rsc.org/images/entities/char_2009.gif) 000× magnification which helped to determine the shape and size of particles, distribution of particles, surface texture, and voids present on the surface of samples. The homogenously distributed round-shaped grains with relatively small porosity can be observed for the pure NCO sample. The grain size of samples was estimated using a Java-based ImageJ software, and the average grain size for pure NCO was recorded as approximately 27 nm. This grain size was increased when 20% of La was substituted at the Nd-site, and a further increase in the concentration of La caused a decrease in the grain size. This reduction of grain size increases the surface energy of the particles, which enhances their binding and thus leads to the agglomeration of particles; this is why we observe agglomeration in the form of clusters containing smaller grains as compared with the parent composition.33 In Fig. 6, FESEM images of all the samples with histograph of particle size distribution as inset, are presented.
000× magnification which helped to determine the shape and size of particles, distribution of particles, surface texture, and voids present on the surface of samples. The homogenously distributed round-shaped grains with relatively small porosity can be observed for the pure NCO sample. The grain size of samples was estimated using a Java-based ImageJ software, and the average grain size for pure NCO was recorded as approximately 27 nm. This grain size was increased when 20% of La was substituted at the Nd-site, and a further increase in the concentration of La caused a decrease in the grain size. This reduction of grain size increases the surface energy of the particles, which enhances their binding and thus leads to the agglomeration of particles; this is why we observe agglomeration in the form of clusters containing smaller grains as compared with the parent composition.33 In Fig. 6, FESEM images of all the samples with histograph of particle size distribution as inset, are presented.
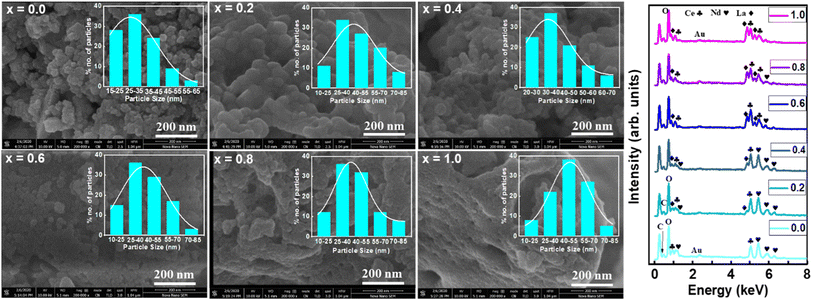 | ||
| Fig. 6 FESEM images and EDX spectra of Nd2−2xLa2xCe2O7 (x = 0, 0.2, 0.4, 0.6, 0.8, and 1.0) samples. | ||
EDX spectra of all the samples are also presented in Fig. 6, where it can be noted that the EDX spectrum of pure NCO contains peaks related to Nd, O, Ce, Au, and C, which confirms that there is no impurity element present in the sample. The presence of peaks belonging to C and Au did not wonder because the C peak came from the sticking tape used to hold the sample with a stub, whereas the Au peak is because of the coating of samples with a thin gold film to get better contrast.34 The peaks belonging to La emerged when La was substituted at the Nd site, and the intensity of these peaks increased gradually, corresponding to the concentration of La. For pure LCO, when the whole Nd has been replaced with La, no peak corresponding to La appeared, which assured the complete replacement of Nd with La.
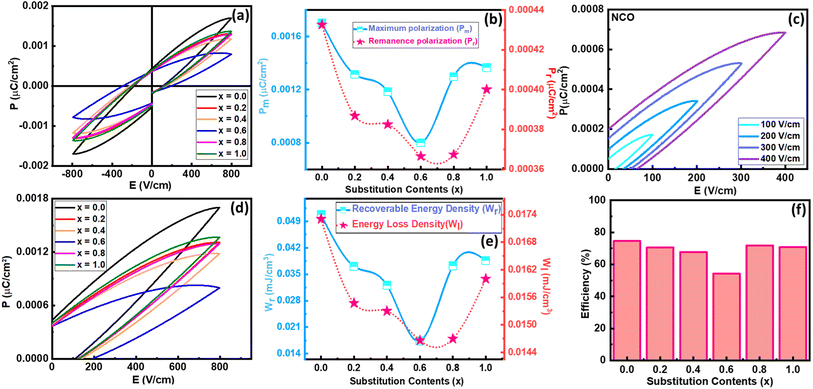
In the modern era, ferroelectric materials are considered as most promising materials which can bring a revolution in the energy storage world.35 The intrinsic property of ferroelectricity of any material can be realized from its polarization versus electric field (PE) plots. For that purpose, PE loops of all the samples were taken up to 800 V cm−1 electric field strength. The unsaturated PE loops for all the samples are presented in Fig. 7(a). It has been observed that polarization increased by increasing the applied electric field and reached 0.0017 μC cm−2 for pure NCO. When the strength of the applied electric field is reduced, then polarization also decreases, but some extent of polarization remains within the material even after the complete removal of the external electric field; that polarization is known as remanence polarization (Pr).36 For pure NCO, the value of Pr was 0.00043 μC cm−2. The value of maximum polarization (Pm) and Pr decreased gradually by increasing the substitution of La up to 60% and then started increasing. Among all these compositions, the pure NCO exhibited the highest value of Pm. The variation of Pm and Pr as a function of substitution contents can be seen in Fig. 7(b). The decrease in Pm with increasing substitution may be due to the smaller atomic polarization of La than Nd.37 Similar decreasing behavior with increasing substitution is also witnessed in Pr and Hc up to 60%; after that, it increased with the increase of substitution. The decrease in polarization in intermediate compositions may be due to the presence of both La and Nd atoms at the A-site in the sample. The presence of a single element at A-site ensures the better coupling among the electric dipole moments, due to which pure LCO and NCO exhibit better ferroelectric properties. Since pure NCO revealed the maximum polarization in the given field strength, therefore, its polarization response was also recorded at different voltages to analyze the effect of voltage on electric polarization. The unipolar loops of NCO at different field strengths and loops of all compositions are presented in Fig. 7(c) and (d). The PE loops also give information about energy densities like total energy density (WT), energy loss density (WL), and recoverable energy density (WR) which can be calculated using the following equations:
 | (4) |
 | (5) |
| WL = WT − WR | (6) |
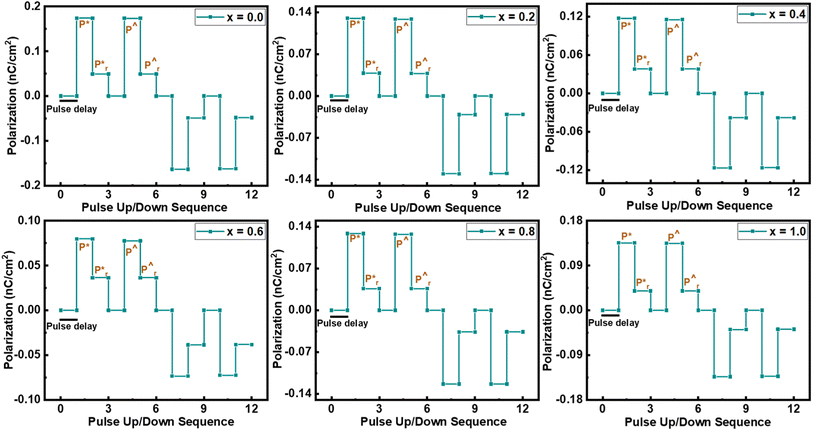
To sense the exact value of Pm and Pr, the up and down pulses are applied to the material. For the first time, Scott reported this method and this measurement is known as the positive up and negative down (PUND) measurement.39 In the present communication, all the samples are examined at 100 V cm−1 electric field strength along 1 ms pulse width, keeping 1 s pulse delay, and pictorial representation is provided in Fig. 8. Here, total polarization is the combination of leakage polarization as well as switching polarization. In the first pulse, both Pm and Pr are recorded, including switching charge density (Qsw).40 When a second pulse is applied, then both polarizations are recorded, excluding switching charge density.41 The same behavior of polarization was also recorded by applying a reverse electric field. From this measurement, the value of switching charge density is calculated by taking the difference in maximum polarization of the second pulse from the first pulse.42 The variation in the value of Qsw concerning substitution contents can be seen in Fig. 9(a), which revealed that pure NCO exhibited a minimum value of Qsw.
 | ||
| Fig. 9 (a) Switching charge density as a function of substitution contents, (b) I–V curves of all the samples at 1 V, and (c) conductivity of all the samples as a function of substitution contents. | ||
The PE loops of all samples are not completely closed; there is some sort of breakage that occurred at zero external applied electric field along the negative polarization axis. This gap in PE loops occurs due to the leakage current.43 To examine the role of leakage current, a graph between current and voltage was recorded using a precision multiferroic tester. Fig. 9(b) shows the trend of leakage current for all the compositions with both positive and negative applied fields. However, the trend in leakage current seems similar but not perfectly identical. An increase in leakage current was noted by increasing the substitution contents of La, and the maximum value of leakage current was recorded for composition with 60% La substitution. After that, it decreased gradually with further increasing substitution of La. From these IV graphs, the value of conductivity (σ) was also calculated44 and presented as a function of substitution contents in Fig. 9(c), and its maximum value was reported for 60% La substitution.
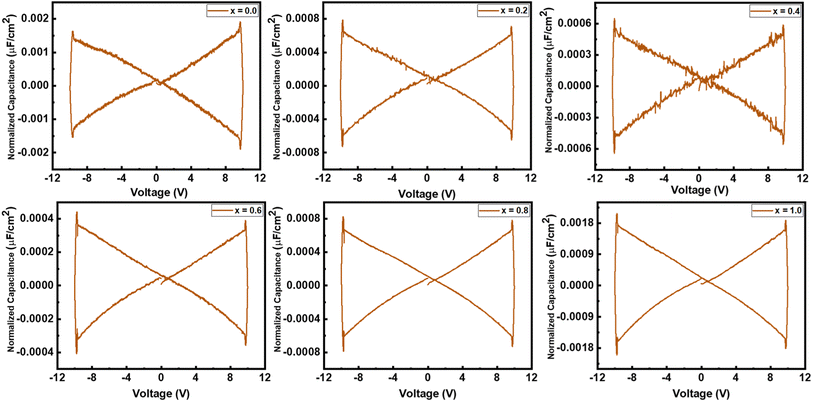
A multiferroic tester was used to find the normalized capacitance against applied voltage for all the samples. The normalized capacitance is the linear function of measured capacitance. The polarization of the samples was recorded at 10 V in the presence of the magnetic field. The value of normalized capacitance was calculated by taking the derivate of polarization with voltage. Fig. 10 shows the plot of normalized capacitance against the voltage for all the samples. A decreasing trend in normalized capacitance can be noted by increasing substitution contents up to 60%. As pure NCO showed the highest efficiency, in a similar way, it also showed the largest value of normalized capacitance among others.
To study the temperature-dependent magnetic properties of these materials, we selected three compositions, i.e., pure NCO, 60% La substituted NCO, and pure LCO, and Cryogenic VSM was used to record the magnetic hysteresis loops, which were presented in Fig. 11. The MH loops at various cryogenic temperatures, i.e., 5, 25, 75, 125, 175, 225, 275, and 325 K, were recorded by applying a magnetic field of strength 1 T. For pure NCO, it can be noted that at room temperature, it exhibits weak ferrimagnetic behavior that is due to the weak magnetic response of the fluorite structure.45 When the temperature is reduced, the saturated weak ferrimagnetic properties of pure NCO are improved and converted into unsaturated MH loops. The maximum magnetization increased gradually by reducing the temperature. Maximum magnetization of 0.017 emu g−1 recorded at 5 K temperature for pure NCO. An abrupt shift of the saturated MH loop to the unsaturated MH loop can be seen after reducing the temperature from 25 K. By substituting La at Nd site, it can be noted that the behavior of temperature on magnetization almost remains the same. 60% La substituted NCO sample exhibited ferrimagnetic nature for all the applied temperatures, but net magnetization reduced as compared to pure NCO. At 5 K temperature, La substituted sample exhibits a maximum magnetization of 0.0054 emu g−1. When complete La was replaced at Nd site, and an interesting magnetic response was recorded. It can be noted that for pure LCO sample, at room temperature it exhibits paramagnetic behavior with very less magnetization. However, when the temperature reduces gradually, its magnetic response starts improving, and maximum magnetization increased by keeping samples in less temperature. A gradual improvement in magnetization was recorded up to 25 K temperature. However, by further reducing the temperature, an unsaturated ferrimagnetic response was recorded with a very small remanence magnetization and coercive field. The maximum value of magnetization of pure LCO was recorded as 4.17 emu g−1 at 10 kOe.
4. Conclusion
To analyze the structural, morphological, electrical, and magnetic response of ABO-defected fluorite structure, a series of Nd2−2xLa2xCe2O7 along x = 0.0, 0.2, 0.4, 0.6, 0.8, and 1.0 was synthesized via cost effective sol–gel auto-combustion process. The face-centered cubic crystal structure with slight variation in lattice parameter from 5.54–5.56 Å was noted due to the substitution of La with a larger ionic radius at the Nd site in the parent composition. The crystallite size of the samples varied in the range of 34–46 nm, while X-ray density and bulk density varied in the range of 5.15–5.41 g cm−3 and 3.4–3.6 g cm−3, respectively. The Rietveld refinement process further validated the structural reliability in terms of various profile factors and goodness of fit. The average grain size of the parent composition was recorded as 26 nm, and after the substitution, the agglomeration started due to a decrease in grain size. The PE loops revealed that polarization increased by increasing the applied electric field, and pure samples like pure NCO and LCO exhibited good ferroelectric response. The substituted samples in which both La and Nd atoms are present at the A-site exhibited a small decrease in ferroelectric behavior. The maximum value of recoverable density was noted for pure NCO and LCO. Among all these compositions, pure NCO exhibited the best energy storage efficiency of 74%. In PUND measurement, NCO exhibited the lowest value of switching charge density. The leakage current versus voltage graphs uncovered the increase in leakage current with an increase in substitution up to 60%, which then decreased by further increasing substitution. The conductivity was also calculated from I–V characteristics that showed an increase in conductivity by increasing substitution. Normalized capacitance showed maximum value for pure NCO. The temperature depended on the magnetic properties of pure NCO, and 60% La substituted NCO revealed that all the samples showed an improved magnetic response by decreasing the temperature. At room temperature pure NCO and 60% La substituted NCO exhibited ferrimagnetic nature while pure LCO showed paramagnetic nature. However, all the samples show good unsaturated ferrimagnetic nature at 5 K temperature. The maximum magnetization of 4.17 emu g−1 was recorded for pure LCO samples at 10 kOe keeping sample at 5 K temperature. Less leakage current, efficient energy storage capabilities, and high normalized capacitance with a lower switching charge density of pure NCO make it a potential candidate for energy storage and fast switching devices.Conflicts of interest
There are no conflicts of interest to declare for this submission.Acknowledgements
The authors would like to acknowledge the Researchers Supporting Project number (RSP2023R71), King Saud University, Riyadh, Saudi Arabia.References
- F. Ali, T. Ali, D. Lehninger, A. Sünbül, A. Viegas, R. Sachdeva and K. Seidel, et al., Fluorite-Structured Ferroelectric and Antiferroelectric Materials: A Gateway of Miniaturized Electronic Devices, Adv. Funct. Mater., 2022, 2201737, DOI:10.1002/adfm.202201737.
- M. Mehak, M. A. Khan, U. Ali, A. Quader, M. Saleem, G. M. Mustafa and S. Atiq, et al., Multiferroic triphase BFO-PZT-PVDF composite with significant magnetoelectric response for multistate device applications, Ceram. Int., 2021, 47(15), 21688–21697, DOI:10.1016/j.ceramint.2021.04.182.
- P. Nukala, M. Ahmadi, Y. Wei, S. De Graaf, E. Stylianidis, T. Chakrabortty and B. Noheda, et al., Reversible oxygen migration and phase transitions in hafnia-based ferroelectric devices, Science, 2021, 372(6542), 630–635, DOI:10.1126/science.abf3789.
- U. Schroeder, M. H. Park, T. Mikolajick and C. S. Hwang, The fundamentals and applications of ferroelectric HfO2, Nat. Rev. Mater., 2022, 1–17, DOI:10.1038/s41578-022-00443-y.
- T. Szyjka, L. Baumgarten, O. Rehm, C. Richter, Y. Matveyev, C. Schlueter and M. Müller, et al., From Doping to Dilution: Local Chemistry and Collective Interactions of La in HfO2, Phys. Status Solidi RRL, 2022, 2100582, DOI:10.1002/pssr.202100582.
- B. Y. Kim, H. W. Park, S. D. Hyun, Y. B. Lee, S. H. Lee, M. Oh and C. S. Hwang, et al., Enhanced ferroelectric properties in Hf0.5Zr0.5O2 films using a HfO0.61N0.72 interfacial layer, Adv. Electron. Mater., 2022, 8(6), 2100042, DOI:10.1002/aelm.202100042.
- S. Nundy, D. Tatar, J. Kojčinović, H. Ullah, A. Ghosh, T. K. Mallick and I. Djerdj, et al., Bandgap Engineering in Novel Fluorite-Type Rare Earth High-Entropy Oxides (RE-HEOs) with Computational and Experimental Validation for Photocatalytic Water Splitting Applications, Adv. Sustainable Syst., 2022, 2200067, DOI:10.1002/adsu.202200067.
- M. H. Park and C. S. Hwang, Fluorite-structure antiferroelectrics, Rep. Prog. Phys., 2019, 82(12), 124502, DOI:10.1088/1361-6633/ab49d6.
- M. H. Park, D. H. Lee, K. Yang, J. Y. Park, G. T. Yu, H. W. Park and C. S. Hwang, et al., Review of defect chemistry in fluorite-structure ferroelectrics for future electronic devices, J. Mater. Chem. C, 2020, 8(31), 10526–10550, 10.1039/D0TC01695K.
- H. J. Kim, Y. An, Y. C. Jung, J. Mohan, J. G. Yoo, Y. I. Kim and S. J. Kim, et al., Low-Thermal-Budget Fluorite-Structure Ferroelectrics for Future Electronic Device Applications, Phys. Status Solidi RRL, 2021, 15(5), 2100028, DOI:10.1002/pssr.202100028.
- D. Song, M. Ryu, J. Kwon, G. Lyu, J. Kim, H. B. Jeon and Y. S. Oh, et al., Blocking of radiative thermal conduction in Zn2+-incorporated high-entropy A2B2O7 fluorite oxides, Ceram. Int., 2021, 47(23), 33544–33553, DOI:10.1016/j.ceramint.2021.08.263.
- J. Che, X. Wang, X. Liu, G. Liang and S. Zhang, Thermal transport property in pyrochlore-type and fluorite-type A2B2O7 oxides by molecular dynamics simulation, Int. J. Heat Mass Transfer, 2022, 182, 122038, DOI:10.1016/j.ijheatmasstransfer.2021.122038.
- A. J. Wright, Q. Wang, C. Hu, Y. T. Yeh, R. Chen and J. Luo, Single-phase duodenary high-entropy fluorite/pyrochlore oxides with an order-disorder transition, Acta Mater., 2021, 211, 116858, DOI:10.1016/j.actamat.2021.116858.
- F. P. Marlton, Z. Zhang, Y. Zhang, T. E. Proffen, C. D. Ling and B. J. Kennedy, Lattice disorder and oxygen migration pathways in pyrochlore and defect-fluorite oxides, Chem. Mater., 2021, 33(4), 1407–1415 CrossRef CAS . https://scripts.iucr.org/cgi-bin/paper?S0108767321086190.
- J. Zhu, M. Wei, J. Xu, R. Yang, X. Meng, P. Zhang and F. Gao, et al., Influence of order-disorder transition on the mechanical and thermophysical properties of A2B2O7 high-entropy ceramics, J. Adv. Ceram., 2022, 11(8), 1222–1234, DOI:10.1007/s40145-022-0605-3.
- Z. Teng, Y. Tan and H. Zhang, High-Entropy Pyrochlore A2B2O7 with Both Heavy and Light Rare-Earth Elements at the A Site, Materials, 2021, 15(1), 129, DOI:10.3390/ma15010129.
- M. Jung, V. Gaddam and S. Jeon, A review on morphotropic phase boundary in fluorite-structure hafnia towards DRAM technology, Nano Convergence, 2022, 9(1), 1–18, DOI:10.1186/s40580-022-00333-7.
- Z. Zhou, T. Chen, X. Liu and R. Liang, Phase transitions and ferroelectricity of perovskite layered Sr2Nb2O7 ceramics, J. Phys. Chem. Solids, 2022, 169, 110888, DOI:10.1016/j.jpcs.2022.110888.
- D. H. Lee, Y. Lee, K. Yang, J. Y. Park, S. H. Kim, P. R. S. Reddy and M. H. Park, et al., Domains and domain dynamics in fluorite-structured ferroelectrics, Appl. Phys. Rev., 2021, 8(2), 021312, DOI:10.1063/5.0047977.
- M. H. Park, Y. H. Lee, T. Mikolajick, U. Schroeder and C. S. Hwang, Thermodynamic and kinetic origins of ferroelectricity in fluorite structure oxides, Adv. Electron. Mater., 2019, 5(3), 1800522, DOI:10.1002/aelm.201800522.
- F. Ali, D. Zhou, N. Sun, H. W. Ali, A. Abbas, F. Iqbal and K. H. Kim, et al., Fluorite-structured ferroelectric-/antiferroelectric-based electrostatic nanocapacitors for energy storage applications, ACS Appl. Energy Mater., 2020, 3(7), 6036–6055, DOI:10.1021/acsaem.0c00987.
- A. Quader, G. M. Mustafa, S. Riaz, S. M. Ramay and S. Atiq, Optimization of dielectric and magnetoresistive response in Nd2-xLaxCe2O7 (0 ≤ x ≤ 2.0) for efficient energy storage applications, Mater. Sci. Semicond. Process., 2022, 150, 106916, DOI:10.1016/j.mssp.2022.106916.
- A. Hassan, G. M. Mustafa, S. K. Abbas, S. Atiq, M. Saleem, S. Riaz and S. Naseem, Correlation of La-mediated structural transition and dielectric relaxation in Bi2Mg2/3Nb4/3O7 pyrochlores, Ceram. Int., 2019, 45(12), 14576–14585, DOI:10.1016/j.ceramint.2019.04.175.
- S. Aslam, H. M. Rafique, S. M. Ramay, N. Akhtar, G. M. Mustafa, A. A. Siddig and A. A. Aziz, Tuning the dielectric properties of PbNb2O6 perovskite through calcium substitution, Phys. B, 2022, 635, 413840, DOI:10.1016/j.physb.2022.413840.
- Z. Shen, G. Liu, R. Mu, L. He, Z. Xu and J. Dai, Effects of Er stabilization on thermal property and failure behavior of Gd2Zr2O7 thermal barrier coatings, Corros. Sci., 2021, 185, 109418, DOI:10.1016/j.corsci.2021.109418.
- B. D. Cullity, Elements of X-ray Diffraction, Addison-Wesley Publishing, 1956 Search PubMed.
- M. H. Park, D. H. Lee, K. Yang, J. Y. Park, G. T. Yu, H. W. Park and C. S. Hwang, et al., Review of defect chemistry in fluorite-structure ferroelectrics for future electronic devices, J. Mater. Chem. C, 2020, 8(31), 10526–10550, 10.1039/D0TC01695K.
- H. Ahmad, A. Quader, G. Ali, G. M. Mustafa, S. Naseem and S. Atiq, Evaluation of mobility range of charge carriers in Nd-substituted, Ceram. Int., 2021, 47(24), 34314–34322, DOI:10.1016/j.ceramint.2021.08.343.
- L. E. Kalland, A. Løken, T. S. Bjørheim, R. Haugsrud and T. Norby, Structure, hydration, and proton conductivity in 50% La and Nd doped CeO2–La2Ce2O7 and Nd2Ce2O7–and their solid solutions, Solid State Ionics, 2020, 354, 115401, DOI:10.1016/j.ssi.2020.115401.
- R. Kumar and M. Kar, Correlation between lattice strain and magnetic behavior in non-magnetic Ca substituted nano-crystalline cobalt ferrite, Ceram. Int., 2016, 42(6), 6640–6647, DOI:10.1016/j.ceramint.2016.01.007.
- J. A. Peters, K. Djanashvili, C. F. Geraldes and C. Platas-Iglesias, The chemical consequences of the gradual decrease of the ionic radius along the Ln-series, Coord. Chem. Rev., 2020, 406, 213146, DOI:10.1016/j.ccr.2019.213146.
- A. N. Syahida, H. Sutanto, I. Alkian, F. D. D. Irianti, A. A. Wibowo and P. Priyono, Synthesized and characterization nanosized synthesis Fe3O4 powder from natural iron sand, J. Phys.: Conf. Ser., 2021, 1943(1), 012013, DOI:10.1088/1742-6596/1943/1/012013.
- S. Atiq, M. Majeed, A. Ahmad, S. K. Abbas, M. Saleem, S. Riaz and S. Naseem, Synthesis and investigation of structural, morphological, magnetic, dielectric and impedance spectroscopic characteristics of Ni-Zn ferrite nanoparticles, Ceram. Int., 2017, 43(2), 2486–2494, DOI:10.1016/j.ceramint.2016.11.046.
- M. Umair, A. Quader, M. Imran, M. A. Yaqub, S. M. Ramay and S. Atiq, Significant impact of spinel ferrites in evolution of magneto-electric coupling in novel tri-phase composites, Ceram. Int., 2022, 48(10), 14473–14480, DOI:10.1016/j.ceramint.2022.01.340.
- Z. D. Luo, M. M. Yang, Y. Liu and M. Alexe, Emerging Opportunities for 2D Semiconductor/Ferroelectric Transistor-Structure Devices, Adv. Mater., 2021, 33(12), 2005620, DOI:10.1002/adma.202005620.
- E. Sanders, Y. Soffer, T. Salzillo, M. Rosenberg, O. Bar-Elli, O. Yaffe and D. Oron, et al., Remanent Polarization and Strong Photoluminescence Modulation by an External Electric Field in Epitaxial CsPbBr3 Nanowires, ACS Nano, 2021, 15(10), 16130–16138, DOI:10.1021/acsnano.1c04905.
- CRC handbook of chemistry and physics, ed. D. R. Lide, CRC Press, 2004, vol. 85 Search PubMed.
- M. A. Yaqub, S. Niaz, S. Khan, A. Quader, S. M. Ramay, S. K. Abbas and S. Atiq, Ternary composites: a suitable platform for simultaneous improvement of multiferroic characteristics, Mater. Sci. Semicond. Process., 2022, 147, 106728, DOI:10.1016/j.mssp.2022.106728.
- S. K. Abbas, G. M. Mustafa, M. Saleem, M. Sufyan, S. Riaz, S. Naseem and S. Atiq, Ethylene glycol assisted three-dimensional floral evolution of BiFeO3-based nanostructures with effective magneto-electric response, R. Soc. Open Sci., 2020, 7(8), 200642, DOI:10.1098/rsos.200642.
- M. Zahid, M. Younis, T. A. Khan, M. Ahmad, A. Quader, G. M. Mustafa, E. A. Alghamdi, S. M. Ramay, H. Chang and S. Atiq, Strain induced electromagnetic coupling in tri-phase multiferroic composites 0.8[(1-x)Fe2O3–xPbZrO3] + 0.2Cr2O3 for multistate devices, Ceram. Int., 2022, 48(19, Part A), 27560–27567, DOI:10.1016/j.ceramint.2022.06.049.
- J. F. Scott and C. A. Paz de Araujo, Ferroelectric memories, Science, 1989, 246(4936), 1400–1405, DOI:10.1126/science.246.4936.1400.
- J. H. Lee, Y. K. Jeong, J. H. Park, M. A. Oak, H. M. Jang, J. Y. Son and J. F. Scott, Spin-canting-induced improper ferroelectricity and spontaneous magnetization reversal in SmFeO3, Phys. Rev. Lett., 2011, 107(11), 117201, DOI:10.1103/PhysRevLett.107.117201.
- P. R. Evans, X. Zhu, P. Baxter, M. McMillen, J. McPhillips, F. D. Morrison and J. Gregg, et al., Toward self-assembled ferroelectric random access memories: hard-wired switching capacitor arrays with almost Tb/in. 2 densities, Nano Lett., 2007, 7(5), 1134–1137, DOI:10.1021/nl0626028.
- A. E. R. Mahmoud and S. K. S. Parashar, Effect of domain switching contribution on polarization current, leakage current and switching charge density studied by PUND method in (Ba1−xCax)TiO3 ceramics, Mater. Sci. Eng., B, 2019, 246, 13–20, DOI:10.1016/j.mseb.2019.05.022.
- J. Wang, P. Zu, S. Yi and Z. Cao, Preconcentration of iron, rare earth, and fluorite from Bayan Obo ore using superconducting magnetic separation, Min., Metall., Explor., 2021, 38(2), 701–712, DOI:10.1007/s42461-020-00305-7.
| This journal is © The Royal Society of Chemistry 2023 |

