 Open Access Article
Preparation and corrosion resistance of superhydrophobic Ni–Co–Al2O3 coating on X100 steel†
Qiuli Zhang *a,
Yi Fenga,
Wenzhi Liaoa,
Jingjing Lia,
Chengxian Yinbc,
Jun Zhoua,
Zhaoyang Chena,
Pei Zhanga and
Zhongyi Ninga
aSchool of Chemistry and Chemical Engineering, Xi'an University of Architecture and Technology, Xi'an, 710000, China. E-mail: qiulizhang@126.com
bCNPC Tubular Goods Research Institute, Xi'an, 710000, China
cState Key Laboratory for Performance and Structure Safety of Petroleum Tubular Goods and Equipment Materials, Xi'an, 710000, China
First published on 28th February 2023
Abstract
X100 steel is easy to be corroded because of the high salt content in alkaline soils. The Ni–Co coating can slow down the corrosion but still cannot meet the requirements of modern demands. Based on this, in this study, on the basis of adding Al2O3 particles to the Ni–Co coating to strengthen its corrosion resistance, combined with superhydrophobic technology to inhibit corrosion, a micro/nano layered Ni–Co–Al2O3 coating with a new combination of cells and papillae was electrodeposited on X100 pipeline steel, and superhydrophobicity was integrated into it using a low surface energy modification method to improve wettability and corrosion resistance. SEM, XRD, XPS, FTIR spectroscopy, contact angle, and an electrochemical workstation were used to investigate the superhydrophobic materials' microscopic morphology, structure, chemical composition, wettability, and corrosion resistance. The co-deposition behavior of nano Al2O3 particles can be described by two adsorption steps. When 15 g L−1 nano Al2O3 particles were added, the coating surface became homogeneous, with an increase in papilla-like protrusions and obvious grain refinement. It had a surface roughness of 114 nm, a CA of 157.9° ± 0.6°, and –CH2 and –COOH on its surface. The corrosion inhibition efficiency of the Ni–Co–Al2O3 coating reached 98.57% in a simulated alkaline soil solution, and the corrosion resistance was significantly improved. Furthermore, the coating had extremely low surface adhesion, great self-cleaning ability, and outstanding wear resistance, which was expected to expand its application in the field of metal anticorrosion.
Introduction
The oil and gas industry has played an increasingly important role in China's energy strategy in recent years, which is closely related to national security and environmental protection.1 In the oil and gas industry, pipeline transportation is currently the primary means of transport. Pipeline steel has long been used in various soil media such as acidic soil in the southeast and saline soil in the northwest in the process of oil and gas production and transportation. Soil corrosion has become the largest cause of pipeline corrosion and perforation, endangering the safe operation of oil and gas pipelines.2 The salt level of the saline-alkali soil in the northwest of the country, which is more than four times that of saltwater, is exceptionally high and extremely corrosive. The majority of coating corrosion research is done in a 3.5% NaCl solution system; however, the corrosion of saline-alkali soil in the northwest cannot be overlooked. Scholars have long sought to understand how to drastically reduce the harm caused by metal corrosion. Adding corrosion inhibitors,3 electrochemical protection,4 coating techniques,5 and others are the most often utilized protection methods nowadays. However, coating protection is the most cost-effective, common, and practical technique.6–8Ni–Co coating has the characteristics of good mechanical properties, wear resistance, and corrosion resistance, and is a good alternative to the hard chromium coating because of its mechanical properties. It has become an important engineering material,9,10 but it still cannot meet the existing harsh requirements for a soil corrosive environment. To strengthen the corrosion resistance of the Ni–Co coating, second-phase nanoparticles are added. Studies have reported the preparation of metal matrix composite coatings using SiC,11–13 TiO2,14 ZrO2,15 Al2O3 (ref. 16 and 17) and other particles as reinforcing phases. Among them, Al2O3 particles are excellent candidates for coating reinforcement due to their low cost, chemical stability and practicality.17,18 There are currently few studies on Ni–Co–Al2O3 composite coatings, with most focusing on the preparation process,19,20 which improves the substrate's corrosion resistance to a degree, but because the soil environment contains a large amount of water-based mixtures, the large surface energy of pipeline steel makes it easy for water droplets to spread on its surface, increasing the contact area of corrosive substances with its surface and thereby increasing the risk of corrosion. In soil corrosion, the superhydrophobic surface can effectively reduce the contact area and improves the corrosion resistance of pipeline steel.
Superhydrophobic surface technology has attracted widespread attention in the field of metal corrosion prevention due to its unique wetting properties.21–23 The water contact angle of superhydrophobic surfaces is greater than 150° and the sliding angle is less than 10°. Superhydrophobic surface droplets slide off easily, seemingly without any resistance, and have important applications in the fields of anti-corrosion, oil–water separation and self-cleaning.24–27 Superhydrophobic surfaces can be created by combining micro-nano structures with the modification of low-surface energy materials in general.28,29 On the basis of adding second-phase nanoparticles of Al2O3 to the Ni–Co coating to enhance its corrosion resistance, the low surface energy modification technology is used to endow the coating with superhydrophobicity in order to expect a superhydrophobic composite coating with good hydrophobicity and excellent corrosion resistance, which can be widely used in soil corrosive environments. When the simulated soil solution is in contact with the substrate, the corrosive ions such as Cl− and SO42− in the solution will move to the surface of the substrate. A substantial amount of air can reside in the micro-nano structure on the surface of the superhydrophobic coating, forming a solid–liquid–gas composite contact interface. The presence of air reduces the contact area between the solid and the liquid, and the resulting self-cleaning effect makes it difficult for water droplets to stay on the surface, shortening the contact time between the surface and the water, improving the charge transfer resistance of corrosive ions and preventing the corrosive medium from infiltrating the matrix.30 Endowing the Ni–Co–Al2O3 coating with superhydrophobicity can protect the substrate multiple times, thereby enhancing the corrosion resistance of the substrate.
Therefore, in this study, Ni–Co–Al2O3 coatings were prepared using a composite electrodeposition technique, followed by the low surface energy modification method to impart superhydrophobicity. The effects of nanoparticle concentration on the coating's microscopic shape, chemical composition, contact angle, and corrosion resistance, as well as the corrosion mechanism, were investigated in order to provide data and theoretical guidelines for its application in pipeline steel. Adding Al2O3 as the reinforcing phase of the composite coating with a superhydrophobic treatment has some research significance to study its corrosion resistance in the simulated alkaline soil environment.
Experimental
Materials and reagents
The anode material used in the experiment was a nickel plate with a purity of 99.99% produced by a metal material company in Hebei Province, and its size was 15 mm × 45 mm × 3 mm. The cathode material was X100 pipeline steel (C 0.06–0.10 wt%, Si 0.2–0.5 wt%, Mn 1.0–3.0 wt%, Ni 0.3–0.4 wt%, Cr 0.03–0.05 wt%, Mo 0.2–0.4 wt%, Fe bal) from China National Petroleum Corporation Engineering Materials Research Institute Co., LTD. Nano Al2O3 particles (nano-Al2O3) (99.9%) with an average particle size of 30 nm were used. Fig. S1† shows the microscopic morphology of nano-Al2O3. All additional reagents such as sodium hydroxide, sodium phosphate, sodium carbonate, hydrochloric acid, nickel sulphate, cobalt sulphate, boric acid, nickel chloride, citric acid, sodium saccharin, SDBS, 1,4-butynediol, stearic acid and anhydrous ethanol were of analytical grade. All chemicals were used directly without further purification.Substrate pre-treatment
The X100 steel was cut into 10 mm × 10 mm × 3 mm specimens, one end of which was soldered to a copper wire and then encapsulated with epoxy resin to make a working electrode with a working area of 100 mm2. Finally, the electrode was wiped with absolute ethanol, dried and placed in a drying oven for later use.Before electrodeposition, 180–1500# sandpaper was used to polish the working area of the sample step by step, followed by washing with acetone and deionized water. Then, the cleaned substrate was soaked in an alkaline solution containing 50 g L−1 NaOH, 20 g L−1 Na2CO3 and 30 g L−1 Na3PO4 for ultrasonic degreasing for 30 min. Subsequently, the samples were activated in 10 wt% HCl for 1 min, rinsed with distilled water, and then immediately placed in an electroplating bath. The samples were rinsed with deionized water after degreasing and activation.
Preparation of superhydrophobic coatings
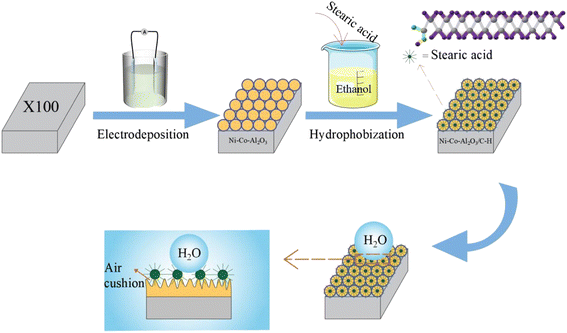
Fig. 1 shows the schematic diagram of the preparation of a superhydrophobic composite coating. During electrodeposition, the cathode was X100 pipeline steel, the anode was a pure nickel plate, and the electrolyte composition was 200 g L−1 NiSO4·6H2O, 15 g L−1 CoSO4·7H2O, 30 g L−1 H3BO3, 70 g L−1 C6H8O7, 15 g L−1 NiCl2·6H2O, 0.1 g L−1 sodium dodecyl benzene sulfonate (SDBS), 0.4 g L−1 2-butyne-1,4-diol, 0.6 g L−1 sodium saccharin and nano-Al2O3. The electrodeposition temperature was 60 °C for 2 h and the current density was 0.05 A cm−2. The electrolyte was continuously stirred at 400 rpm under the action of a magnetic stirrer to disperse the Al2O3 nanoparticles uniformly in the solution. After deposition, the prepared samples were washed several times with deionized water and absolute ethanol to remove excess stains. Then, the sample was immersed in 1% stearic acid-ethanol solution of low surface energy modification solution for 1 h. After finishing the modification, it was dried in an oven for 2 h for subsequent performance tests.Characterization and testing
The surface morphology of the coatings was observed using a field emission scanning electron microscope (FESEM, Hitachi SU8010, Japan) at 10–15 kV, and the composition and elemental mapping were determined by energy-dispersive X-ray spectroscopy (EDS) in the scanning electron microscopy (SEM) mode. The crystalline phases of the obtained coating were characterized using an X-ray diffractometer (XRD, Empyrean S3, PANalytical, The Netherlands) at a scanning speed of 2θ = 2° min−1 and a scanning range of 20°–80°. A Fourier transform infrared (FT-IR) spectrometer (Nicolet iS50, Thermo Scientific, USA) was used to determine the chemical bonds formed in the coatings, and the wavenumber range was set in the range of 3500–800 cm−1. The chemical state of the elements in the coating was determined by X-ray photoelectron spectroscopy (XPS, K-Alpha, Thermo Scientific, USA). The static water contact angle (CA) of a 5 μL water droplet on the surface of the coating was measured at room temperature using an optical contact angle measurement system (Kruss DSA100, Germany) to determine the superhydrophobicity of the coating, and the CAs were measured at five different points for each sample and averaged.The electrochemical corrosion behaviors of the X100 pipeline steel substrate and its coating were studied using a traditional three-electrode system.31 Electrochemical experiments were carried out using a Correst CS2350 electrochemical workstation. The working electrode was the prepared X100 steel sample, the working electrode area was 100 mm2, the counter electrode was a high-purity graphite electrode, the reference electrode was a saturated calomel electrode, and the solution medium was a simulated alkaline soil solution with a composition of 0.0883 g L−1 Na2CO3, 0.280 g L−1 NaHCO3, 0.0813 g L−1 CaCl2, 0.4315 g L−1 MgSO4·7H2O, and 5.6676 g L−1 Na2SO4 and its pH = 9.0 ± 0.1 adjusted with a 10% NaOH solution. During the experiments, the working electrode was placed in the test solution for 30 min to make the fluctuation of the open circuit potential to be within 10 mV/5 min. When measuring the potentiodynamic polarization curve, the potential range was −0.2 V to +1.0 V (relative to the open circuit potential), and the scan rate was 0.30 mV s−1. When testing the AC impedance spectrum, the measurement frequency was 106 Hz–10−2 Hz, the disturbance AC amplitude was 5 mV, the logarithmic scan was 10 times, and the frequency was 10. The potentiodynamic polarization curves were fitted and analyzed using the Cview analysis software, and the electrochemical impedance spectroscopy test data were fitted using the ZsimpWin software.
Results and discussion
Surface micromorphology
As shown in Fig. 2(a), the surface of X100 steel is basically smooth and flat, and there are only the lines produced by grinding; when the content of nano-Al2O3 is 0, that is, the Ni–Co coating, the surface is composed of cauliflower-like structures formed by cells of different sizes, but with microporous defects, as shown in Fig. 2(b). When the nano-Al2O3 content is increased to 5 g L−1, as shown in Fig. 2(c), there are no pinholes on the surface of the coating, which may be because part of Al2O3 is embedded in the defects inside the Ni–Co coating, filling the micropores. The surface of the coating is composed of the cellular structure of the Ni–Co coating at the bottom and the nano-scale Al2O3 papillary protrusions mostly covering the upper layer, forming a micro-nano-level hierarchical structure. The crystal edge is obvious, the size of the cellular structure is different, and the growth of nano-Al2O3 is uneven and the content is less, which may be due to the fact that there are fewer new nucleation sites generated by Al2O3, the growth rate is fast in the nucleated cluster, and the deposition rate is slow in the lack of nuclei. The Al2O3 coating formed on the surface is not uniform. As shown in Fig. 2(d), when the content of nano-Al2O3 is 10 g L−1, more nano-Al2O3 protrusions appear on the surface, which are more uniformly distributed, but the protrusions have larger grain size and the presence of agglomeration is due to tip effects. When the amount of nano-Al2O3 added is 15 g L−1, as shown in Fig. 2(e), the surface of the coating is uniform, with more papillae protrusions, which uniformly cover the dense cell-like structure of the Ni–Co plated layer. The size is uniform, and the grains of the coating are obviously refined. As can be seen from Fig. 2(f), the coating is dense and no cracks or pinholes are visible. The cell-like structure with nanoscale papillae forming a micro-nano layered structure allows air to be trapped in the cavities formed by the nanoparticles on the surface of the coating, resulting in a larger contact angle, thus showing that the addition of nano-Al2O3 has a significant effect on the construction of the micro-nano rough structure on the surface of the Ni–Co–Al2O3 composite coating.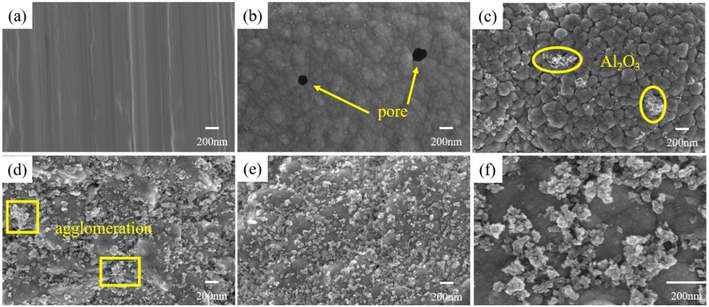 | ||
| Fig. 2 Surface morphologies of different samples (a) X100; (b)–(e) coatings prepared by adding 0, 5, 10 and 15 g L−1 Al2O3; and (f) enlarged view of (e). | ||
Fig. S2(a)† shows the elemental distribution of the composite coating when 15 g L−1 nano-Al2O3 particles are added. As can be seen, elements such as Ni, Co, O and Al are evenly distributed without obvious agglomeration. The results indicate that the Al2O3 particles are uniformly embedded in the Ni–Co metal matrix. The presence of element C in the figure may be due to the successful grafting of stearic acid on the coating, which provides the possibility for the realization of superhydrophobicity.
Fig. S2(b) and (c)† are the EDS spectra of the Ni–Co coating and Ni–Co-15 g L−1 Al2O3, respectively. It can be seen from Table 1 that when the Al2O3 concentration increases from 0 to 15 g L−1, the Ni content decreases from 72.27 wt% to 56.21 wt%; the Co content increases from 10.45 wt% to 11.19 wt%. This suggests that the addition of nano-Al2O3 can slightly promote anomalous Ni–Co co-deposition, possibly due to the better wettability of Co than Ni, resulting in easier adsorption of Co2+ on the nano-Al2O3, thus promoting preferential Co deposition.32 When 15 g L−1 Al2O3 is added, the Al content in the coating is 6.28 wt%. C appears in the spectrum, probably because stearic acid is adsorbed onto the surface of the coating, which is consistent with the result of elemental mapping. Ni, Co, Al, and O appear on the EDS spectrum, indicating that Al2O3 is co-deposited in the Ni–Co matrix.
| Ni–Co coating | Ni–Co-15 g L−1 Al2O3 coating | |||
|---|---|---|---|---|
| Weight% | Atomic% | Weight% | Atomic% | |
| C K | 3.82 | 16.28 | 3.89 | 14.54 |
| Ni L | 84.13 | 73.27 | 73.46 | 56.21 |
| Co L | 12.05 | 10.45 | 14.68 | 11.19 |
| Al K | 3.77 | 6.28 | ||
| O K | 4.19 | 11.78 | ||
| Total | 100.00 | 100.00 | ||
The co-deposition behavior of nano-Al2O3 can be explained by the Guglielmi model.33 The model is based on two sequential adsorption steps. Fig. 3 shows the diagram of the electrodeposition mechanism of the Ni–Co–Al2O3 composite coating. Before deposition, various particles in the bath are uniformly dispersed due to the stirring effect. (1) Ion migration: Ni2+ and Co2+ are adsorbed onto nano-Al2O3 and have a positive charge; Ni2+, Co2+ and charged nano-Al2O3 migrate to the cathode surface under the action of an electric field. (2) Weak adsorption: charged nano-Al2O3 is loosely adsorbed onto the surface of the cathode via the diffusion of the electric double layer. The adsorption is physical adsorption and is reversible. (3) Reduction of Ni and Co: Ni2+ and Co2+ adsorbed on the cathode surface and metal ions wrapped on the surface of nano-Al2O3 get electrons and are reduced to Ni and Co metal atoms. Due to the increasing electrostatic attraction, the substrate or coating will form a strong adsorption force on nano-Al2O3, and the adsorption is strong and irreversible. (4) Co-deposition: as the deposition process progresses, some nano-Al2O3 are partially or completely encapsulated by reduced Ni and Co, and many particles are not encapsulated, thereby realizing co-deposition. With the prolongation of deposition time, the coating gradually becomes thicker, forming a Ni–Co–Al2O3 composite coating with a certain thickness.
Surface chemical composition
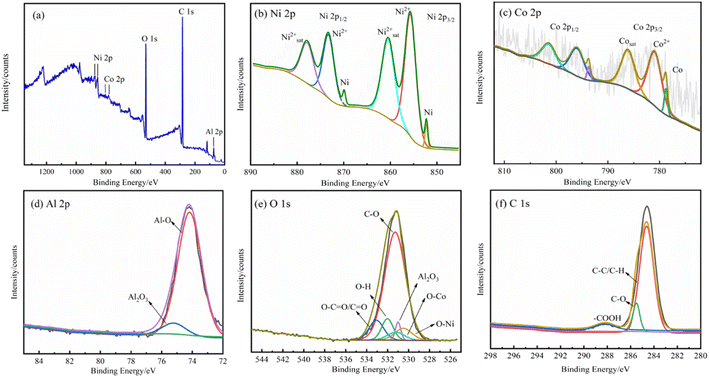 | ||
| Fig. 5 XPS spectra of the Ni–Co-15 g L−1 Al2O3 superhydrophobic surface: (a) survey spectrum, (b) Ni 2p region, (c) Co 2p region, (d) Al 2p region, (e) O 1s region, and (f) C 1s region. | ||
Fig. 5(c) depicts the fit of Co 2p XPS, with Co 2p3/2 split into three peaks. The shape of Co 2p XPS is similar to that of the Ni 2p XPS spectrum. The peaks at 778.77 eV and 780.94 eV are assigned to metallic cobalt (Co0) and cobalt oxide and hydroxide (Co2+), respectively; this is in good agreement with the EDS results. The peak at 786.09 eV is assigned to satellite cobalt, and the peaks at 793.69 eV, 795.96 eV and 801.42 eV are ascribed to the Co 2p1/2 spectrum. Co originates from the reduction of CoSO4 in the electroplating solution.
The sample Al 2p high-resolution spectrum is shown in Fig. 5(d). There were two strong Al 2p peaks on the surface of coating associated with Al2O3 (75.21 eV) and Al–O (74.15 eV) respectively, indicating that Al2O3 was successfully deposited on the composite coating, and there is no doubt that the Al2O3 micro-nano structure is clear evidence of its high contact angle. Fig. 5(e) shows the spectrum of O 1s. C–O, O–C![[double bond, length as m-dash]](https://www.rsc.org/images/entities/char_e001.gif) O/C
O/C![[double bond, length as m-dash]](https://www.rsc.org/images/entities/char_e001.gif) O and O–H bonds are located at 531.28 eV, 533.07 eV and 532.01 eV, and these results indicate that stearic acid successfully modified the plating; Al2O3 is located at 531.00 eV. The O–Ni spectrum appears at 530.50 eV and the O–Co spectrum at 531.20 eV. Fig. 5(f) shows the XPS high-resolution map of C 1s. The C 1s spectrum can be decomposed into three peaks at 284.63 eV, 285.51 eV and 288.20 eV, corresponding to C–C/C–H, C–O/C–O–C and –COOH, respectively, with C–C/C–H being the dominant substance. The above-mentioned results further confirm that stearic acid was successfully adsorbed onto the Ni–Co–Al2O3 coating surface. C–C is a non-polar bond, which plays a hydrophobic role on the surface of the composite coating.36 XPS analysis results indicate that the surface of the Ni–Co–Al2O3 coating with micro-nano rough structure contains not only nickel and cobalt, but also organic hydrocarbons. The adsorption of organic hydrocarbons on the micro-nanostructured surface reduces the surface energy, making it hydrophobic.
O and O–H bonds are located at 531.28 eV, 533.07 eV and 532.01 eV, and these results indicate that stearic acid successfully modified the plating; Al2O3 is located at 531.00 eV. The O–Ni spectrum appears at 530.50 eV and the O–Co spectrum at 531.20 eV. Fig. 5(f) shows the XPS high-resolution map of C 1s. The C 1s spectrum can be decomposed into three peaks at 284.63 eV, 285.51 eV and 288.20 eV, corresponding to C–C/C–H, C–O/C–O–C and –COOH, respectively, with C–C/C–H being the dominant substance. The above-mentioned results further confirm that stearic acid was successfully adsorbed onto the Ni–Co–Al2O3 coating surface. C–C is a non-polar bond, which plays a hydrophobic role on the surface of the composite coating.36 XPS analysis results indicate that the surface of the Ni–Co–Al2O3 coating with micro-nano rough structure contains not only nickel and cobalt, but also organic hydrocarbons. The adsorption of organic hydrocarbons on the micro-nanostructured surface reduces the surface energy, making it hydrophobic.
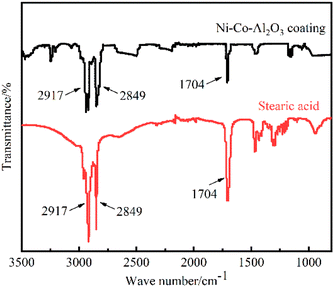
The infrared spectra of stearic acid and Ni–Co–Al2O3 superhydrophobic coatings were recorded by FT-IR spectroscopy, as shown in Fig. 6. It can be seen that for stearic acid, the absorption peaks at 2849.58 cm−1 and 2917.93 cm−1 are assigned to the asymmetric and symmetrical stretching vibrations of C–H in –CH2. The superhydrophobic coating also shows two peaks at 2849.58 cm−1 and 2917.93 cm−1 for –CH2, indicating the presence of hydrocarbon long chains in the coating, that is, stearic acid was successfully modified on the coating. The absorption peak (–COOH) can determine the form of stearic acid present on the coating. The absorption peak at 1704.34 cm−1 is attributed to the vibration of the carboxyl group (–COOH) in stearic acid, which is still present in the superhydrophobic surface. It shows that stearic acid has no chemical reaction in the coating, but is physically adsorbed onto the coating. The experimental results indicate that stearic acid successfully modified the nanostructure of the Ni–Co–Al2O3 coating, which verifies the XPS results.
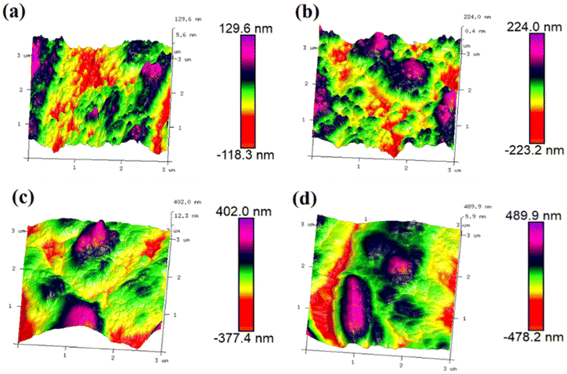 | ||
| Fig. 7 3D profile of Ni–Co–Al2O3 composite coatings prepared by adding (a) 0, (b) 5 g L−1, (c) 10 g L−1 and (d) 15 g L−1 nano-Al2O3. | ||
| Sample | Rq (nm) | Ra (nm) | Rmax (nm) |
|---|---|---|---|
| Ni–Co | 37.5 | 30.6 | 274 |
| Ni–Co–Al2O3 (5 g L−1) | 67.4 | 55.1 | 426 |
| Ni–Co–Al2O3 (10 g L−1) | 110 | 84.5 | 667 |
| Ni–Co–Al2O3 (15 g L−1) | 141 | 114 | 795 |
Superhydrophobicity mechanism
The micro-nano rough structure and surface composition are the two main parameters affecting the wettability of the coating surface.39 From the above-mentioned analysis of microscopic morphology and surface composition, it can be seen that the incorporation of nano-Al2O3 particles into the coating can form a micro-nano rough structure and increase the roughness of the coating. The low surface energy functional groups in stearic acid were successfully grafted to the surface of the coating, which reduced the surface energy of the coating, thus achieving two conditions for the preparation of superhydrophobic materials and obtaining excellent superhydrophobicity. To analyze the wettability of the coatings, the contact angles of water droplets on X100 steel and superhydrophobic surfaces were measured, and the results are shown in Fig. 8. | ||
| Fig. 8 Water contact angles of different samples: (a) X100; and (b)–(e) coatings prepared by adding 0, 5, 10 and 15 g L−1 nano-Al2O3. | ||
The water contact angle of X100 steel is 90.8° ± 1.3° (Fig. 8(a)), and the surface is almost neither hydrophobic nor hydrophilic; when the Ni–Co coating is deposited onto its surface, the CA increases to 143.1° ± 0.9° (Fig. 8(b)), and the surface becomes hydrophobic. According to Wenzel's theory, increasing the roughness of the surface of a hydrophobic material makes the surface more hydrophobic.40 When 5 g L−1, 10 g L−1, and 15 g L−1 Al2O3 were added, the surface of the obtained coating all reached a superhydrophobic state, with CA of 151.8° ± 0.4°, 154.5° ± 0.5°, and 157.9° ± 0.6°, respectively. Wenzel40 and Cassie–Baxter41 are the two theoretical models found to be most effective for explaining the effects of surface roughness and chemical inhomogeneity on contact angle measurements based on the contact area of the liquid–solid interface.42 The Wenzel model corresponds to the wetting state and the Cassie–Baxter model corresponds to the non-wetting state, while the droplets on superhydrophobic surfaces are usually in the Cassie–Baxter state.43 Therefore, according to the Cassie–Baxter equation:
cos![[thin space (1/6-em)]](https://www.rsc.org/images/entities/char_2009.gif) θ = f + f θ = f + f![[thin space (1/6-em)]](https://www.rsc.org/images/entities/char_2009.gif) cos cos![[thin space (1/6-em)]](https://www.rsc.org/images/entities/char_2009.gif) θ0 − 1 θ0 − 1
| (1) |
It has been reported in the literature that air trapped in nanostructures on the surface of superhydrophobic coatings can be clearly represented.44 As shown in Fig. S3(a),† when the X100 steel is immersed in deionized water, a bright water layer similar to a silver mirror appeared on the surface, and the bare steel surface is wetted by water. When the prepared superhydrophobic coating is immersed in deionized water, as shown in Fig. S3(b),† there is no water residue on the surface of the sample, and the surface has no obvious change and is not wetted. This phenomenon indicates that when the Ni–Co–Al2O3 superhydrophobic composite coating is in contact with water, the air cushion formed in the micro-nano layered structure combining cellular and papillary shapes prevents the sample from being wetted.
Low adhesion and high adhesion are two important properties of superhydrophobic materials.45 The adhesion of the superhydrophobic coatings was tested using a contact angle meter. Fig. S3(c–g)† depicts the process of water droplets approaching and leaving the superhydrophobic coating surface. First, deionized water is suspended on the top of the dripper and moves down to make it close to the superhydrophobic surface. As can be seen from Fig. S3(d),† due to the small wettability of the superhydrophobic surface, the contact area with the water droplet is relatively small, and the water droplets touch across the surface. As shown in Fig. S3(e),† the suspended water droplets are squeezed and deformed after contacting the superhydrophobic surface, and they roll to one side, but the contact area with the sample does not increase. When the dripper slowly moves upwards, the water droplets are deformed, and elongate without breaking, as shown in Fig. S3(f),† which proves that there is adhesion between the water droplets and the surface. When the dripper continued to move upward, the water droplets leave the coating freely without leaving any traces, and the water droplets keep their original shape. The experimental results indicate that the Ni–Co–Al2O3 superhydrophobic composite coating has very low adhesion, which is consistent with the Cassie–Baxter model, and further indicates that the electrodeposited synthetic coating has excellent superhydrophobic properties.
Electrochemical testing
| Sample | βa (mV dec−1) | βc (cm V dec−1) | Icorr (μA cm−2) | Ecorr (V/SCE) | CR (mm per a) | η/% |
|---|---|---|---|---|---|---|
| X100 | 215.57 | 421.42 | 21.711 | −0.43838 | 0.254690 | — |
| Ni–Co | 219.14 | 399.67 | 7.0014 | −0.30333 | 0.082135 | 67.75 |
| Ni–Co–Al2O3 (5 g L−1) | 247.72 | 576.82 | 5.8163 | −0.26567 | 0.068232 | 73.21 |
| Ni–Co–Al2O3 (10 g L−1) | 344.84 | 532.37 | 4.3709 | −0.17118 | 0.051275 | 79.87 |
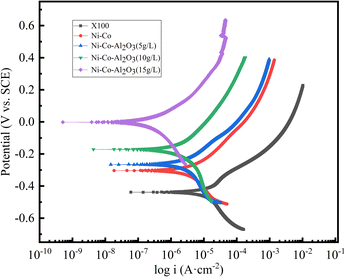
| Ni–Co–Al2O3 (15 g L−1) | 146.35 | 265.70 | 0.31073 | −0.00167 | 0.003645 | 98.57 |
It can be seen from Fig. 9 that the anodes of all samples have typical active dissolution, indicating that there is no activation-passivation process. At the same time, when the Al2O3 concentration changes, the shape of the cathodic and anodic polarization curves are similar, indicating that it does not affect the cathodic and anodic reaction mechanism. According to the fitting results provided in Table 3, compared with Icorr of the X100 pipeline steel matrix (21.711 μA cm−2), Icorr of the Ni–Co coating and Ni–Co–Al2O3 composite coating is significantly reduced to 7.0014 μA cm−2 and 0.31073 μA cm−2 respectively. It shows that the Ni–Co coating and Ni–Co–Al2O3 composite coating have a lower corrosion rate. Icorr of the Ni–Co coating is about 23 times larger than that of the Ni–Co-15 g L−1 Al2O3 composite coating, indicating that the Ni–Co-15 g L−1 Al2O3 composite coating has better corrosion resistance and can effectively protect the X100 substrate. With the increase in Al2O3 addition, Ecorr of the prepared Ni–Co–Al2O3 composite coating gradually shifts positively and Icorr gradually decreases. When 15 g L−1 nano-Al2O3 is added, the corrosion rate reaches a minimum of 0.003645 mm per a, and the corrosion resistance of the coating is significantly improved.
The protective efficiency η of Ni–Co and Ni–Co–Al2O3 coatings was calculated from the fitting parameters given in Table 3:47
| η = 1 − jc/jbare | (2) |
AC impedance spectrum
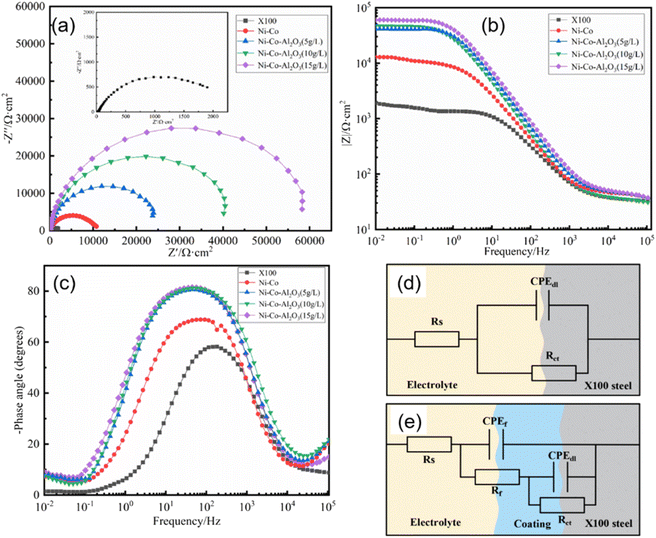
Fig. 10(a) shows the Nyquist plot of the X100 pipeline steel and the prepared coating soaked in the simulated alkaline soil solution for 24 h.In addition, the EIS results of bare steel X100 and hydrophobic coatings were fitted by two equivalent circuits (EEC). The equivalent circuit models of R (CR) and R (C (R (CR))) were selected for bare steel and hydrophobic coatings respectively (Fig. 10(d) and (e)) to calculate the corrosion parameters, where Rs is the resistance of the electrolyte solution, Rct is the charge transfer resistance, which is inversely proportional to the corrosion rate, Rf is the resistance of the hydrophobic coating, CPEf is the constant phase element of the hydrophobic coating, and CPEdl is the constant phase element of the electric double layer. The CPE is affected by the surface state (roughness, coating uniformity, and uneven surface current distribution).
The impedance calculation of CPE value is shown in eqn (3):
 | (3) |
 , and Y0 is the numerical value of admittance expressed in S sn cm−2, and n is the dimensionless exponent of CPE, which lies between 0 and 1. When n = 0, CPE is reduced to R, and when n = 1, CPE becomes an ideal pure capacitor.
The actual capacitance (C) value can be calculated using eqn (4):
 | (4) |
It can be seen from Fig. 10(a) that all impedance spectrum shapes are semicircular capacitive arcs. Generally speaking, when other conditions are the same, the size of the impedance spectrum radius can directly reflect the corrosion resistance of the coating, and the larger the radius, the better the corrosion resistance.49 High-frequency capacitive arcing is due to charge transfer resistance. It can be clearly found that the capacitance arc radius of the coatings is larger than that of X100 steel, and the impedance arc radius of the coatings increases with the increase in nano-Al2O3 particle content. Normally, the lowest frequency impedance modulus |Z| can be used to evaluate the corrosion resistance of coatings in corrosion systems. Fig. 10(b) shows the X100 pipeline steel and coating Bode diagram of the log|Z| vs. log![[thin space (1/6-em)]](https://www.rsc.org/images/entities/char_2009.gif) f figure, the preparation of the coating at the lowest frequency impedance modulus |Z| 1 order of magnitude higher than the X100 steel substrate; among them, the Ni–Co–Al2O3 (15 g L−1) impedance modulus maximum, the greatest capacitance arc radius and the greatest |Z|f=0.01Hz values show that the protection performance of the Ni–Co–Al2O3 coating is greatly improved. In a wide frequency range, the maximum value of phase angle is another manifestation of high protection efficiency. It can be seen from Fig. 10(c) that the peak value of phase angle of the prepared coating is wider. In addition, the phase diagram explains the breakpoint frequency (fb), that is, the frequency value when the phase angle is −45°. It is also proved that the Ni–Co–Al2O3 (15 g L−1) coating has the best protective ability.
f figure, the preparation of the coating at the lowest frequency impedance modulus |Z| 1 order of magnitude higher than the X100 steel substrate; among them, the Ni–Co–Al2O3 (15 g L−1) impedance modulus maximum, the greatest capacitance arc radius and the greatest |Z|f=0.01Hz values show that the protection performance of the Ni–Co–Al2O3 coating is greatly improved. In a wide frequency range, the maximum value of phase angle is another manifestation of high protection efficiency. It can be seen from Fig. 10(c) that the peak value of phase angle of the prepared coating is wider. In addition, the phase diagram explains the breakpoint frequency (fb), that is, the frequency value when the phase angle is −45°. It is also proved that the Ni–Co–Al2O3 (15 g L−1) coating has the best protective ability.
As can be seen from Table 4, as Al2O3 increases from 0 to 15 g L−1, the Rct value gradually increases, and when the concentration increases to 15 g L−1, the maximum Rct value is 61![[thin space (1/6-em)]](https://www.rsc.org/images/entities/char_2009.gif) 867 Ω cm2, which is about 29 times the Rct value of X100 steel (2154.9 Ω cm2) and 5 times the Rct value of the Ni–Co coating (11
867 Ω cm2, which is about 29 times the Rct value of X100 steel (2154.9 Ω cm2) and 5 times the Rct value of the Ni–Co coating (11![[thin space (1/6-em)]](https://www.rsc.org/images/entities/char_2009.gif) 081 Ω cm2). In general, the larger the CPEdl value, the larger the corrosion area. The results indicate that both Ni–Co and Ni–Co–Al2O3 coatings can effectively inhibit the corrosion of the substrate in alkaline soil solutions, and the Ni–Co–Al2O3 coating has the best corrosion resistance. At the same time, the X100 steel matrix has the smallest n-value compared to the Ni–Co and Ni–Co–Al2O3 coatings, indicating that the bare steel corrodes most severely at the interface.
081 Ω cm2). In general, the larger the CPEdl value, the larger the corrosion area. The results indicate that both Ni–Co and Ni–Co–Al2O3 coatings can effectively inhibit the corrosion of the substrate in alkaline soil solutions, and the Ni–Co–Al2O3 coating has the best corrosion resistance. At the same time, the X100 steel matrix has the smallest n-value compared to the Ni–Co and Ni–Co–Al2O3 coatings, indicating that the bare steel corrodes most severely at the interface.
| Sample | Rs (Ω cm2) | CPEf (μS sn cm−2) | Rf (Ω cm2) | CPEdl (μS sn cm−2) | Rct (Ω cm2) | ||
|---|---|---|---|---|---|---|---|
| Y1 | n1 | Y2 | n2 | ||||
| X100 | 30.780 | — | — | — | 544.64 | 0.7451 | 2154.9 |
| Ni–Co | 41.729 | 4472.1 | 0.5914 | 10![[thin space (1/6-em)]](https://www.rsc.org/images/entities/char_2009.gif) 562 562 |
10.846 | 0.8375 | 11![[thin space (1/6-em)]](https://www.rsc.org/images/entities/char_2009.gif) 081 081 |
| Ni–Co–Al2O3 (5 g L−1) | 43.977 | 1538.7 | 0.7217 | 25![[thin space (1/6-em)]](https://www.rsc.org/images/entities/char_2009.gif) 022 022 |
4.8485 | 0.9184 | 26![[thin space (1/6-em)]](https://www.rsc.org/images/entities/char_2009.gif) 151 151 |
| Ni–Co–Al2O3 (10 g L−1) | 44.351 | 720.64 | 0.7662 | 40![[thin space (1/6-em)]](https://www.rsc.org/images/entities/char_2009.gif) 016 016 |
3.8320 | 0.9119 | 40![[thin space (1/6-em)]](https://www.rsc.org/images/entities/char_2009.gif) 302 302 |
| Ni–Co–Al2O3 (15 g L−1) | 44.228 | 221.98 | 0.7966 | 52![[thin space (1/6-em)]](https://www.rsc.org/images/entities/char_2009.gif) 062 062 |
3.1715 | 0.9221 | 61![[thin space (1/6-em)]](https://www.rsc.org/images/entities/char_2009.gif) 867 867 |
The improved corrosion resistance of the Ni–Co–Al2O3 coating can be explained by the fact that the papillary protrusions on the surface of the coating construct a stable Cassie state, ensuring that air is trapped within the papillary protrusions. The trapped air has a buffering effect and prevents the adsorption of water on the surface of the coating. In addition, Al2O3 has good chemical stability, exists as a reinforcing phase in the coating, and is uniformly distributed over the entire surface (Fig. 2), reducing the effective metal area of the coating and impeding the corrosion process.
The anticorrosion mechanism of X100 steel and Ni–Co–Al2O3 superhydrophobic composite coatings is shown in Fig. 11. When X100 steel is immersed in a simulated alkaline soil solution, oxygen absorption reaction occurred at the cathode and OH− ions are formed. Its cathode reaction formula is as follows:
| O2 + 4e− + 2H2O → 4OH− | (5) |
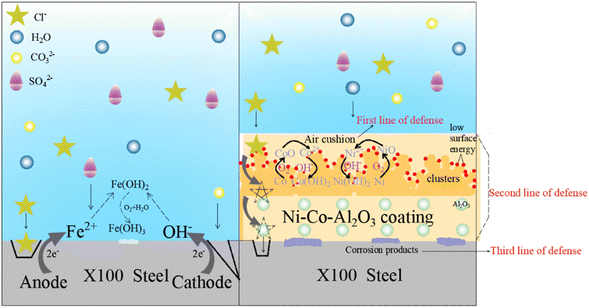 | ||
| Fig. 11 Corrosion mechanism of X100 steel and Ni–Co–Al2O3 superhydrophobic composite coatings in the simulated alkaline soil solution. | ||
As there is no coating protection on the surface, corrosive ions (such as Cl− and CO32−) will directly attack the surface of X100 steel under the action of osmotic pressure, resulting in the dissolution of Fe. The dissolved Fe2+ will undergo hydration. In alkaline soils, Fe2+ reacts with OH− to form Fe(OH)2, which can form Fe(OH)3 in the presence of oxygen. The relevant reactions are as follows:
| Fe−2e− → Fe2+ | (6) |
| Fe + 2OH− → Fe(OH)2 | (7) |
| 4Fe(OH)2 + 2H2O + O2 → 4Fe(OH)3 | (8) |
However, the autocatalysis of Cl− promotes the dissolution of anode Fe and aggravates the corrosion of its surface.
| Fe + Cl− + H2O → [FeCl(OH)]ad− + H+ + e− | (9) |
| [FeCl(OH)]ad− → FeClOH + e− | (10) |
| FeClOH + H+ → Fe2+ + Cl− + H2O | (11) |
When the Ni–Co–Al2O3 superhydrophobic composite coating is immersed in an alkaline simulated soil solution, the cellular structure of the Ni–Co coating cooperated with the nano-scale Al2O3 papillary protrusions on the upper layer to form a micro-nano-scale hierarchical structure, and modified by stearic acid to obtain low-surface energy Ni–Co–Al2O3 coating, which make the coating surface capture many air pockets, form an air cushion with the corrosive medium, reduce the contact area between the corrosive medium and the coating surface, and become the first line of defense for the Ni–Co–Al2O3 coating.
When the corrosive medium breaks through the air barrier and enters the coating, the low-surface energy functional groups (–CH2 and –COOH) adsorbed on the surface of the coating can act as physical barriers. The rough structure of the surface and the Al2O3 particles in the coating can significantly prolong the diffusion of corrosive ions into the X100 surface. At the same time, from the XPS results, it is known that the Ni–Co–Al2O3 coating has a high degree of oxidation on the surface, and the existing oxide film can also slow down the corrosion process. However, the rough structure of the Ni–Co–Al2O3 superhydrophobic surface resembles a capillary structure, and therefore, creates a “capillary effect”. When the medium touches the surface, the depth of the liquid into the capillary can be calculated using the following formula:
h = (2γ![[thin space (1/6-em)]](https://www.rsc.org/images/entities/char_2009.gif) cos cos![[thin space (1/6-em)]](https://www.rsc.org/images/entities/char_2009.gif) θ)/rρg θ)/rρg
| (12) |
With the increase in soaking time and the continuous diffusion of corrosive ions, the corrosive medium reaches the surface of X100 steel through the coating, Ni preferentially dissolves, releases Ni2+ and Co2+, diffuses to the surface of the substrate, and finally forms protective NiO/Ni(OH)2 and CoO/Co(OH)2 corrosion products on the surface of the substrate, and the formation of these substances can fill the gaps in the coating, prevent the substrate surface from being further exposed to corrosive solutions, play a physical shielding role, and become the third line of defense. The relevant equation is as follows:
| 2Ni + O2 → 2NiO | (13) |
| 2Co + O2 → 2CoO | (14) |
| NiO + H2O → Ni2+ + 2OH− | (15) |
| CoO + H2O → Co2+ + 2OH− | (16) |
| Ni2+ + 2H2O → Ni(OH)2 + 2H+ | (17) |
| Co2+ + 2H2O → Co(OH)2 + 2H+ | (18) |
Self-cleaning
In practical applications, the coating surface is susceptible to the surface protection performance that is affected by the accumulation of air contaminants on its surface. Superhydrophobic surfaces provide effective self-cleaning properties for surface contamination. To evaluate the self-cleaning ability of the as-prepared Ni–Co–Al2O3 coatings, carbon powder is used as a contaminant to study its self-cleaning performance.Fig. S4† shows the pictures of different sample tests for self-cleaning performance. First, fix the sample so that it forms a certain angle with the horizontal plane, drop deionized water on the sample covered with carbon powder, and observe the rolling of powder and droplets. It can be seen from Fig. S4(a–c)† that the carbon powder on the surface of X100 steel cannot be taken away by water droplets, and the water droplets adhere to its surface to form a mixture. From Fig. S4(d–f),† it can be seen that when the water droplets come into contact with the superhydrophobic surface, the droplets quickly roll off and carry away carbon powder on the surface, and finally, no contaminants remain on the surface of the superhydrophobic coating, indicating that the superhydrophobic coating has good self-cleaning properties and can protect the exposed coating from contamination.
Chemical and mechanical stability
Due to the complex service environment of pipeline steel, there are many soil solution systems such as acidic soil in the southeast, saline soil in the northwest and saline soil in the coast. In order to study the chemical stability of the superhydrophobic coating, it is immersed in a solution with a pH of 1–14 to study the change in contact angle. As can be clearly seen in Fig. 12, the contact angles are all greater than 150°, indicating that the change in pH has little effect on the wetting ability of the Ni–Co–Al2O3 superhydrophobic coating, that is, the coating has a wide application range.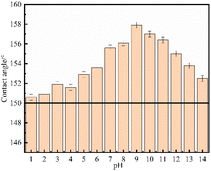 | ||
| Fig. 12 Water contact angle of Ni–Co–Al2O3 superhydrophobic composite coatings at different pH values. | ||
Since pipeline steel is subject to different degrees of friction during construction, embedding and use, in order to study the mechanical durability of the superhydrophobic coating, a sandpaper abrasion test was carried out to study the change in the contact angle of the superhydrophobic surface. When the wear load is 200 g, the superhydrophobic surface is worn on 1000-grit sandpaper at a constant speed for 15 cm, rotated 90°, and then moved by 15 cm, as shown in Fig. 13(a), which ensures that the surface is laterally and longitudinally treated in each cycle. This process is defined as a wear cycle. It is found from Fig. 13(b) that even after 15 continuous cycles the superhydrophobic coating still maintains its superior hydrophobicity, indicating that the coating has good mechanical stability.
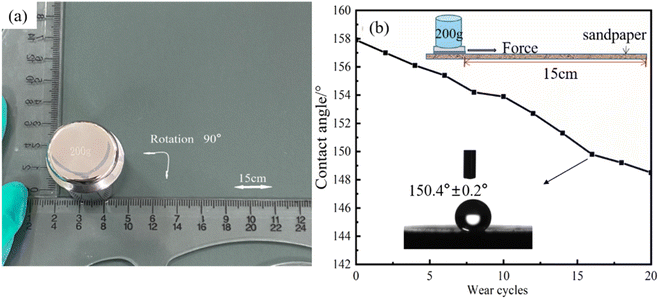 | ||
| Fig. 13 (a) Process of the sandpaper abrasion test of the Ni–Co–Al2O3 coating and (b) diagram of CA changing with the wear cycle number. | ||
Conclusions
In this study, superhydrophobic nanocomposite Ni–Co–Al2O3 coatings have been prepared on the surface of X100 pipeline steel by a combination of composite electrodeposition and low surface energy modification. The microscopic morphology of the coating can be controlled by varying the doping amount of nano-Al2O3 particles, and the nano-Al2O3 co-deposition behavior can be described in two adsorption steps. The surface of the coating with 15 g L−1 nano-Al2O3 added has no defects such as voids and microcracks, and the particle size is uniform; its surface roughness is 114 nm; it exhibits high superhydrophobicity, CA is 157.9° ± 0.6°, and the contact area fraction between water droplets and air is 92.6%. Diffraction peaks of the Ni(111), (200) and (220) crystal planes appeared in the superhydrophobic composite coating at 2θ of 44°, 52° and 76°, respectively, and a small diffraction peak of Al2O3 appeared at 2θ of about 42°; the coating surface contains –CH2 and –COOH groups. There are five peak signals of C 1s, O 1s, Ni 2p, Co 2p and Al 2p in the XPS measurement spectrum; the surface of the Ni–Co–Al2O3 coating with the micro-nano rough structure not only contains nickel and cobalt, but also contains organic hydrocarbons. The minimum Icorr value is 0.31073 μA cm−2 and the maximum Rct value is 61![[thin space (1/6-em)]](https://www.rsc.org/images/entities/char_2009.gif) 867 Ω cm2 in the simulated alkaline soil solution, with a corrosion inhibition efficiency of 98.57%, which significantly improves corrosion resistance. In a solution of pH 1–14, the CA is greater than 150°, and the chemical stability is good. Even after 15 consecutive wear cycles, the CA can still reach over 150°. In addition, the coating has extremely low surface adhesion and excellent self-cleaning properties. Therefore, the Ni–Co–Al2O3 superhydrophobic composite coating has good properties and can effectively protect the matrix, which provides a certain theoretical guidance for its application in buried pipeline steel.
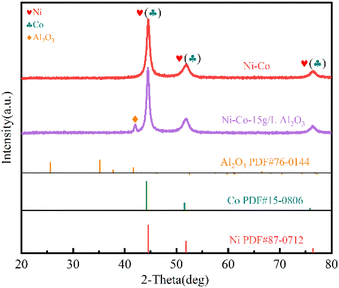
867 Ω cm2 in the simulated alkaline soil solution, with a corrosion inhibition efficiency of 98.57%, which significantly improves corrosion resistance. In a solution of pH 1–14, the CA is greater than 150°, and the chemical stability is good. Even after 15 consecutive wear cycles, the CA can still reach over 150°. In addition, the coating has extremely low surface adhesion and excellent self-cleaning properties. Therefore, the Ni–Co–Al2O3 superhydrophobic composite coating has good properties and can effectively protect the matrix, which provides a certain theoretical guidance for its application in buried pipeline steel.
Author contributions
Qiuli Zhang: conceptualization, resources, writing—review and editing, funding acquisition; Yi Feng: methodology, software, investigation, data curation, writing—original draft preparation, writing—review and editing; Wenzhi Liao: data curation, writing—original draft preparation; Jingjing Li: methodology, writing—review and editing; Chengxian Yin: investigation, funding acquisition; Jun Zhou: supervision, funding acquisition; Zhaoyang Chen: software, investigation; Pei Zhang: resources, software; Zhongyi Ning: software; investigation; All authors have read and agreed to the published version of the manuscript.Conflicts of interest
There are no conflicts to declare.Acknowledgements
The authors would like to thank the project funded by National Natural Science Foundation of China (no. 21663034), the Innovation Capability Support Program of Shaanxi (Program No. 2020TD-028) and Innovation Capability Support Program of Shaanxi (Program NO.2019TD-038).References
- Q. Liu, H. Yu, G.-C. Zhu, P.-B. Wang and S.-Y. Song, Eng. Failure Anal., 2020, 113, 104552–104561 CrossRef CAS.
- S. Tesfamariam, H. Woldesellasse, M. Xu and E. Asselin, J. Pipeline Sci. Eng., 2021, 1, 329–338 CrossRef.
- O. D. Ofuyekpone, O. G. Utu, B. O. Onyekpe, A. A. Adediran and M. Oki, Case Stud. Chem. Environ. Eng., 2020, 2, 100058–100065 CrossRef.
- L. Wu, D. Yang, G. Zhang, Z. Zhang, S. Zhang, A. Tang and F. Pan, Appl. Surf. Sci., 2018, 431, 177–186 CrossRef CAS.
- J. Wu, J. Deng, R. Wang, Y. Meng, Z. Zhang and Y. Lu, Surf. Coat. Technol., 2022, 436, 128322–128336 CrossRef CAS.
- W. Yao, W. Liang, G. Huang, B. Jiang, A. Atrens and F. Pan, J. Mater. Sci. Technol., 2020, 52, 100–118 CrossRef CAS.
- G. Zhang, A. Tang, L. Wu, Z. Zhang, H. Liao, Y. Long, L. Li, A. Atrens and F. Pan, Surf. Coat. Technol., 2019, 366, 238–247 CrossRef CAS.
- X. Guo, R. Guo, M. Fang, N. Wang, W. Liu, H. Pei, N. Liu and Z. Mo, Ceram. Int., 2022, 48, 17308–17318 CrossRef CAS.
- Z. She, Q. Li, Z. Wang, C. Tan, J. Zhou and L. Li, Surf. Coat. Technol., 2014, 251, 7–14 CrossRef CAS.
- A. Karimzadeh, M. Aliofkhazraei and F. C. Walsh, Surf. Coat. Technol., 2019, 372, 463–498 CrossRef CAS.
- N. P. Wasekar, L. Bathini, L. Ramakrishna, D. S. Rao and G. Padmanabham, Appl. Surf. Sci., 2020, 527, 146896–146909 CrossRef CAS.
- W. Jiang, L. Shen, M. Xu, Z. Wang and Z. Tian, J. Alloys Compd., 2019, 791, 847–855 CrossRef CAS.
- P. Jenczyk, M. Gawrońska, W. Dera, J. Chrzanowska-Giżyńska, P. Denis and D. M. Jarząbek, Ceram. Int., 2019, 45, 23540–23547 CrossRef.
- Z. He, Y. Zhou, Y. Wang, P. Guo, W. Jiang, C. Yao and X. Shu, Chin. J. Chem. Eng., 2021, 44, 369–376 CrossRef.
- G. Cui, Z. Bi, J. Liu, S. Wang and Z. Li, Ceram. Int., 2019, 45, 6163–6174 CrossRef CAS.
- J. Azizi-Nour and F. Nasirpouri, J. Electroanal. Chem., 2022, 907, 116052–116064 CrossRef CAS.
- M. H. Allahyarzadeh, M. Aliofkhazraei, A. R. S. Rouhaghdam and V. Torabinejad, J. Alloys Compd., 2016, 666, 217–226 CrossRef CAS.
- Q. Zhou, W. E. I. Xie, Y. Zhang, M. Sheng, A. Hu, X. Cheng and L. U. Zhang, Surf. Rev. Lett., 2017, 25, 1850015–1850023 CrossRef.
- A. Karimzadeh, M. Aliofkhazraei and A. S. Rouhaghdam, Bull. Mater. Sci., 2019, 42, 42–53 CrossRef.
- H. Jin, L. Chen, Y. Wang and X. Zhou, Electroplat. Met. Finish., 2018, 37, 865–869 Search PubMed.
- Y. Nie, S. Ma, M. Tian, Q. Zhang, J. Huang, M. Cao, Y. Li, L. Sun, J. Pan, Y. Wang, P. Bi, H. Xu, J. Zeng, S. Wang and Y. Xia, Surf. Coat. Technol., 2021, 410, 126966–126976 CrossRef CAS.
- Y. Zhao, T. Xu, J.-H. Zhou and J.-M. Hu, Chem. Eng. J., 2022, 433, 134039–134050 CrossRef CAS.
- N. A. Polyakov, I. G. Botryakova, V. G. Glukhov, G. V. Red’kina and Y. I. Kuznetsov, Chem. Eng. J., 2021, 421, 127775–127785 CrossRef CAS.
- X. Zhang, R. Wang, F. Long, X. Li, T. Zhou, W. Hu and L. Liu, Surf. Coat. Technol., 2022, 434, 128203–128216 CrossRef CAS.
- X. Li, J. Yan, T. Yu and B. Zhang, Colloids Surf., A, 2022, 642, 128701–128709 CrossRef CAS.
- Y. Liu, X. Cao, J. Shi, B. Shen, J. Huang, J. Hu, Z. Chen and Y. Lai, Chem. Eng. J., 2022, 434, 134605–134612 CrossRef CAS.
- L. Wang, X. Xiao, X. Yin, J. Wang, G. Zhu, S. Yu, E. Liu, B. Wang and X. Yang, Surf. Coat. Technol., 2022, 432, 128074–128086 CrossRef CAS.
- H. Fu, Z. Li, Y. Zhang, H. Zhang and H. Chen, Ceram. Int., 2022, 48, 11573–11587 CrossRef CAS.
- X. Li, Y. Jiang, X. Tan, Z. Zhang, Z. Jiang, J. Lian, C. Wen and L. Ren, Appl. Surf. Sci., 2022, 575, 151596–151610 CrossRef CAS.
- Y. Xiang, Y. He, W. Tang, H. Li, Y. Zhang, R. Song, B. Liu, Y. He, X. Guo and Z. He, Colloids Surf., A, 2021, 629, 127394–127403 CrossRef CAS.
- Q. Zhang, Y. Feng, Z. Chen, W. Liao, S. Zhang, J. Zhou and L. Wu, Coatings, 2022, 12, 231–245 CrossRef CAS.
- F. Cai, C. Jiang, P. Fu and V. Ji, Appl. Surf. Sci., 2015, 324, 482–489 CrossRef CAS.
- N. Guglielmi, J. Electrochem. Soc., 1972, 119, 1009 CrossRef CAS.
- H. Okamoto and T. Massalski, Binary alloy phase diagrams, ASM International, Materials Park, OH, USA, 1990, p. 12 Search PubMed.
- J. Winiarski, B. Cieślikowska, W. Tylus, P. Kunicki and B. Szczygieł, Appl. Surf. Sci., 2019, 470, 331–339 CrossRef CAS.
- J. Long, M. Zhong, H. Zhang and P. Fan, J. Colloid Interface Sci., 2015, 441, 1–9 CrossRef CAS PubMed.
- S. Yuan, X. Zhao, Z. Jin, N. Liu, B. Zhang, L. Wang, J. Duan and B. Hou, Colloids Surf., A, 2022, 633, 127545–127556 CrossRef CAS.
- J. Kratochvíl, A. Kuzminova, P. Solař, J. Hanuš, O. Kylián and H. Biederman, Vacuum, 2019, 166, 50–56 CrossRef.
- Z. Yang, Y. L. Tian, C. J. Yang, F. J. Wang and X. P. Liu, Appl. Surf. Sci., 2017, 414, 313–324 CrossRef CAS.
- R. N. Wenzel, Ind. Eng. Chem., 1936, 28, 988–994 CrossRef CAS.
- A. Cassie and S. Baxter, Trans. Faraday Soc., 1944, 40, 546–551 RSC.
- L. Oberli, D. Caruso, C. Hall, M. Fabretto, P. J. Murphy and D. Evans, Adv. Colloid Interface Sci., 2014, 210, 47–57 CrossRef CAS PubMed.
- U. Cengiz and C. E. Cansoy, Appl. Surf. Sci., 2015, 335, 99–106 CrossRef CAS.
- R. Mardosaitė, A. Jurkevičiūtė and S. Račkauskas, Cryst. Growth Des., 2021, 21, 4765–4779 CrossRef.
- K. Wang, S. Yu, X. Yin, L. Liu, L. Wang, G. Zhu, J. Wang, Q. Li and X. Yang, Colloids Surf., A, 2022, 633, 127871–127881 CrossRef CAS.
- Y. Zhu, F. Sun, H. Qian, H. Wang, L. Mu and J. Zhu, Chem. Eng. J., 2018, 338, 670–679 CrossRef CAS.
- Y. Wan, M. Chen, W. Liu, X. Shen, Y. Min and Q. Xu, Electrochim. Acta, 2018, 270, 310–318 CrossRef CAS.
- A. M. A. Mohamed, A. M. Abdullah and N. A. Younan, Arabian J. Chem., 2015, 8, 749–765 CrossRef CAS.
- T. He, Y. He, H. Li, Z. Su, Y. Fan and Z. He, Ceram. Int., 2018, 44, 9188–9193 CrossRef CAS.
Footnote |
| † Electronic supplementary information (ESI) available. See DOI: https://doi.org/10.1039/d3ra00213f |
| This journal is © The Royal Society of Chemistry 2023 |

