 Open Access Article
Photonic crystal nanostructure as a photodetector for NaCl solution monitoring: theoretical approach†
Abdulkarem H. M. Almawgania,
Hussein A. Elsayedb,
Ahmed Mehaney *b,
T. A. Tahacd,
Ziyad Awadh Alrowailic,
Ghassan Ahmed Alie,
Walied Sabrab,
Sayed Asaduzzamanfg and
Ashour M. Ahmed
 bh
bh
aElectrical Engineering Department, College of Engineering, Najran University, Najran, Kingdom of Saudi Arabia
bPhysics Department, Faculty of Science, Beni-Suef University, Beni-Suef, 62512, Egypt. E-mail: ahmed011236@science.bsu.edu.eg; ahalmawgani@nu.edu.sa
cPhysics Department, College of Science, Jouf University, P.O. Box 2014, Sakaka, Saudi Arabia
dPhysics and Engineering Mathematics Department, Faculty of Electronic Engineering, Menoufia University, Menouf 32952, Egypt
eInformation Systems Department, College of Computer Sciences and Information Systems, Najran University, Najran, Saudi Arabia
fDepartment of CSE, Rangamati Science and Technology University, Rangamati, Bangladesh
gDepartment of Computer Science and Engineering, Daffodil International University, Dhaka, Bangladesh
hPhysics Department, College of Science, Imam Mohammad Ibn Saud Islamic University (IMSIU), Riyadh 11623, Saudi Arabia
First published on 27th February 2023
Abstract
In this research, we have a theoretical simple and highly sensitive sodium chloride (NaCl) sensor based on the excitation of Tamm plasmon resonance through a one-dimensional photonic crystal structure. The configuration of the proposed design was, [prism/gold (Au)/water cavity/silicon (Si)/calcium fluoride (CaF2)10/glass substrate]. The estimations are mainly investigated based on both the optical properties of the constituent materials and the transfer matrix method as well. The suggested sensor is designed for monitoring the salinity of water by detecting the concentration of NaCl solution through near-infrared (IR) wavelengths. The reflectance numerical analysis showed the Tamm plasmon resonance. As the water cavity is filled with NaCl of concentrations ranging from 0 g l−1 to 60 g l−1, Tamm resonance is shifted towards longer wavelengths. Furthermore, the suggested sensor provides a relatively high performance compared to its photonic crystal counterparts and photonic crystal fiber designs. Meanwhile, the sensitivity and detection limit of the suggested sensor could reach the values of 24![[thin space (1/6-em)]](https://www.rsc.org/images/entities/char_2009.gif) 700 nm per RIU (0.576 nm (g l)−1) and 0.217 g l−1, respectively. Therefore, the suggested design could be of interest as a promising platform for sensing and monitoring NaCl concentrations and water salinity as well.
700 nm per RIU (0.576 nm (g l)−1) and 0.217 g l−1, respectively. Therefore, the suggested design could be of interest as a promising platform for sensing and monitoring NaCl concentrations and water salinity as well.
1 Introduction
Nowadays, the research of detecting and sensing water salinity is attracting much attention from researchers due to its importance for many potential areas such as offshore oil exploration, seasonal climate prediction, solar engineering, military engineering, fishing, and marine environment monitoring.1–4 In addition, the quality of pure water determines human health and that of other living organisms that is monitored in industrial and agricultural applications.Various techniques are used to determine the salinity of the water where it can be measured by some methods such as physical and chemical methods.5 Researchers used refractivity phenomena, density, and conductivity for salinity measurements in the case of using physical methods. While in chemical methods, directly determine the concentration of both NaCl and magnesium (Mg) dissolved in seawater.5 It is worth mentioning that the physical methods are more convenient and faster, but they are affected by electrical interference due to their association with electrical measurements.5,6 From this point, the optical techniques are used instead to determine and monitor the water salinity.
From the optical techniques, the most popular one is the photonic crystal periodic structure.7–12 Photonic crystals (PCs) have the possibility to control the electromagnetic waves propagation with different frequencies. One of the most important features which exhibited by the PC designs is the photonic band gap (PBG). Within this feature, specific frequencies of the electromagnetic waves cannot propagate through the PC design. By breaking the periodicity of PC designs, the confinement of light can be achieved where some resonant modes have appeared in the resulted optical spectra.
In the literature, the salinity level in salt solutions are determined using the photonic crystal optical fiber.13–17 Besides, many reports devoted attention towards the usage of the defective PC designs for detecting the salinity of seawater. For instance, in ref. 18, the authors reported about the salinity sensing based on a defective PC design. In their work, the transmittance spectrum is presented based on using a one dimensional (1D)-PC composed of fused silica and seawater. Also, the authors in ref. 19 have reported 1D-defective PC design for simultaneous detection of both seawater salinity and temperature in the vicinity of the 2 × 2 transfer matrix method (TMM).
Furthermore, the physical Tamm plasmon (TP) resonance phenomena was demonstrated in PC designs for many sensing purposes. Basically, Tamm resonance results from the interaction of the incident electromagnetic waves at the interface between a metal and Bragg mirror.20,21 There have been many previous reports about the demonstration of the TP resonance feature in PC designs such as in ref. 20–23. TP resonance showed high sensitivity and quality factor in the optical sensing techniques of PC structures.24–28 For the above-mentioned reasons, we try in this research to make a TP resonance/1D PC sensor to detect the concentrations of salt solutions in water. It is known that the salt level in the saltwater can be specified and indicated by the level of NaCl which, in turn, indicates the most predominant substance in salt water. Accordingly, in our study, we theoretically present the principle of the salinity sensing of NaCl solution based on the TP resonance feature. The current optical salinity sensor is constructed on a defective PC design. Various concentrations of NaCl samples will be injected into the respective cavity in the proposed PC design. Through simulation, we can obtain a resonance (Tamm resonance) peak, which has the tunability feature by adjusting the concentration of the NaCl samples. Finally, the performance of current salinity sensor is presented by investigating some important factors such as the sensitivity and the quality factor.
2 Theoretical methodology of the considered sensor
2.1 Model design and TMM formulization
Here, we analyze the theoretical modeling of the proposed salinity sensor. Fig. 1 shows multilayers from silicon (Si)/calcium fluoride (CaF2) configuration of the 1D-PC scheme.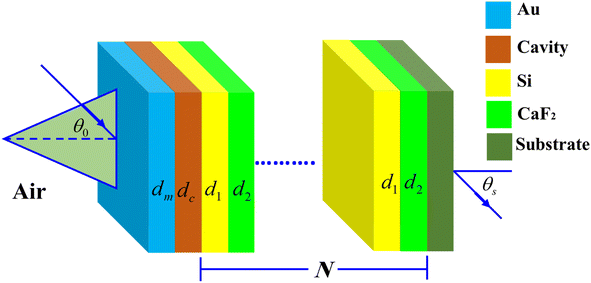 | ||
| Fig. 1 Three dimensions representation of the suggested NaCl sensor that configured as, [prism/Au/water cavity/(Si/CaF2)N/glass substrate]. | ||
The NaCl solution samples will be injected into a cavity inside the proposed PC design where it is set between a metallic layer of gold (Au) and Si/CaF2 multilayers. The metallic layer located on the design top surface is necessary for appearing the Tamm resonance in the resulted PBG as we mentioned previously in the introduction. In the front, a prism receives the incident electromagnetic waves. Now, the whole proposed salinity sensor will have a configuration, [prism/Au/water cavity/(Si/CaF2)N/glass substrate], where N describes the structure's periodicity.
By using the well-known TMM, the optical parameters of the current salinity sensor are estimated as follows.29–31 According to this method, the electric and magnetic components in the Z-direction for the TE mode take the following form:
Ej(z) = Gj![[thin space (1/6-em)]](https://www.rsc.org/images/entities/char_2009.gif) exp(−ikjz) + Hj exp(−ikjz) + Hj![[thin space (1/6-em)]](https://www.rsc.org/images/entities/char_2009.gif) exp(ikjz) = Ey+ + Ey− exp(ikjz) = Ey+ + Ey−
| (1) |
 | (2) |
Then, the electric and magnetic components can be described by the matrix formalization as follows.
 | (3) |
 | (4) |
This can be done when the incident waves interact with a distinct layer having a thickness of dj = Z2 − Z1. According to eqn (3) and (4) we find that,
 | (5) |
In these equations, fj gives the relation between the electric and magnetic fields components along the two sides of the layer j, θj describes the incident angle, and Kj represents the wave vector. Then, the total characteristic matrix for all the structure layers that interact with the incident waves can be described as follows.
 | (6) |
After that, the estimated reflectance of the incident electromagnetic waves is given as follows,
 | (7) |
![[thin space (1/6-em)]](https://www.rsc.org/images/entities/char_2009.gif) cos
cos![[thin space (1/6-em)]](https://www.rsc.org/images/entities/char_2009.gif) θP and ρs = ns
θP and ρs = ns![[thin space (1/6-em)]](https://www.rsc.org/images/entities/char_2009.gif) cos
cos![[thin space (1/6-em)]](https://www.rsc.org/images/entities/char_2009.gif) θs.
θs.
In our calculations, the Drude model formulates the permittivity of Au layer as follows.32,33
 | (8) |
 | (9) |
2.2 Materials and fabrication considerations
The CaF2, Si, and Au materials were used to design the proposed sensor, mainly because of the physical and chemical properties of these materials. Calcium fluoride (CaF2) is a good insulator with an ultra-wide bandgap, a relatively high dielectric constant, a low absorption coefficient, and a wide range of transmission wavelengths (130 nm to 10 μm).35,36 Moreover, it has good stability, a high melting point, insoluble material, exceptional hardness, and inertness. CaF2 is a raw material used in the production of optical glasses, anti-reflection coatings, excimer lasers, beam splitters, agriculture fertilizers, and dental preparations. Silicon (Si) is known to be an indirect semiconductor material. It has a high refractive index, a high band gap, good mechanical stability, a high visible absorption coefficient, very low emission efficiencies, and a low thermo-optic coefficient. It is widely used in a lot of important, modern optical and electronic devices, such as solar cells, transistors, optical fibers, photodiodes, photosensors, microprocessors, memory circuits, and integrated chips. Gold (Au) is a noble transition metal, which has the highest electrical conductivity and thermal conductivity, and it has strong chemical stability compared with silver due to its noble metal. Au has unique surface plasmon resonance (SPR) properties. Due to its promising qualities, it is widely used in electro-optical applications, such as photocatalysis, nanoelectronics, biomedicine, medical imaging, nonlinear optics, and solar cells.For the fabrication of the proposed sensor, an Au layer was deposited on the prism by using the RF sputtering method.37 Next, a polyimide (PI) polymer layer was prepared by using the chemical vapor deposition (CVD) technique on the prism/Au.38 Then, Si/CaF2 multilayer films were grown on prism/Au/PI. The periodic Si/CaF2 multilayer structures can be deposited at room temperature by using the molecular beam epitaxy (MBE).39,40 The Si/CaF2 multilayer structures were studied in many previous experimental works.41,42 The whole multilayer structure is now configured as prism/Au/PI/(Si/CaF2)10/air. The cavity in a stack of multilayers structure can be formed by using chemical etching for the PI polymer layer. The final structure is prism/Au/cavity/(Si/CaF2)10/air.
3 Numerical verifications and discussions
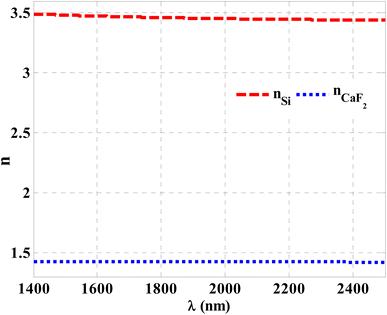
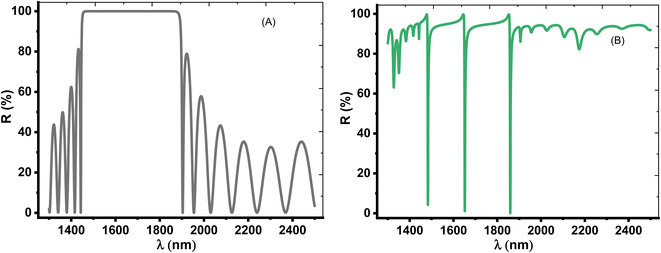
Herein, we have demonstrated numerical validations of the current design through the above theoretical analysis. The investigated results describe the reflectivity of the designed structure through near IR wavelengths. The choice of such wavelengths is due to the presence of TP resonance through this wavelength region. Here, the design has the configuration, [prism/Au/cavity layer/(Si/CaF2)10/air]. First, we designed a multilayer structure or PC of 10-unit cells to investigate the PBG through the wavelengths of interest. In this regard, the usage of Si and CaF2 in the design of this structure is logical choice to obtain the PBG easily. In particular, these materials have a high contrast in their refractive indices. Such contrast could lead to a wide PBG at the proposed wavelengths. Fig. 2 supports this strategy. The figure describes the response of the indices of refraction of these materials through the incident radiation. Here, the refractive index of Si is almost constant whatever the increase of wavelengths of the incident radiation. Specifically, its value received its maximum (3.49) at 1400 nm and then decreases slightly till gets 3.44 at 2500 nm.43 In contrast, CaF2 has a refractive index of 1.42.44 Therefore, the presence of a wide PBG could be investigated. In particular, the presence of a wide PBG could be helpful during the observation of the position of TP resonance and its shifts as well.Then, Fig. 3 displays the reflectance spectrum of the PC that configured as, [prism/(Si/CaF2)10/substrate] at normal incidence. Here, the thickness of Si and CaF2 layers are proposed as 100 nm and 900 nm. Furthermore, the substrate is designed from glass having a refractive index of 1.52. Fig. 3 demonstrates the formation of the PBG with a width of 425 nm where their edges from the left side to the right one are located at 1456 nm and 1881 nm, respectively. However, a PBG with this width has a little interest specifically TP resonance modes are highly sensitive to variation of refractive indices due to NaCl concentration variations.
To simulate the detection of NaCl, we have introduced a 20 nm thin metallic layer and a cavity layer of water with a thickness of 5 μm on the PC top surface (see Fig. 1). Hence, the last visualization of our design was, [prism/Au/water cavity/(Si/CaF2)10/substrate]. In this regard, the Au layer refractive index could be investigated from eqn (8) in which ωP = 1.323 × 10¹⁶ and γ = 1.26 × 1014.45 Fig. 3B shows the appearance of three sharp dips with intensities 4.3%, 1.07%, and 0.04% in the reflectance spectrum at wavelength positions of 1483.33 nm, 1651.77 nm, and 1859.34 nm, respectively. These sharp reflectance dips could be due to TP resonance. Such resonance is introduced through the reflectance spectrum of multilayer structures or PCs because the free electrons' oscillations are quantized at the interface between the thin metallic layer and cavity.46 Physically, the sharp TP resonant modes (the three sharp dips) with a high resonance in the water cavity is due to the coupling between two fields. One field is a narrow mode and this is due to the plasmon resonance in the metallic layer and the other one through the evanescent fields present in the Bragg mirror.47 To sum up, it means that the narrow TP modes that appear in the liquid cavity come from the hybridization between the narrow plasmon mode of the metal layer and evanescent modes of the dielectric layers, producing slow-guided modes (three narrow dips) of low group velocity.48,49 Therefore, these resonance modes could be sensitive against the refractive index variations with concentration. Therefore, the detection of NaCl solution is correlated with the shift of these dips with the variations in the concentration of the used analyte. However, the presence of only one resonance dip through the reflectance spectrum could offer more simplicity besides overcoming any conflict during the detection procedure unlike the case of two or three dips.
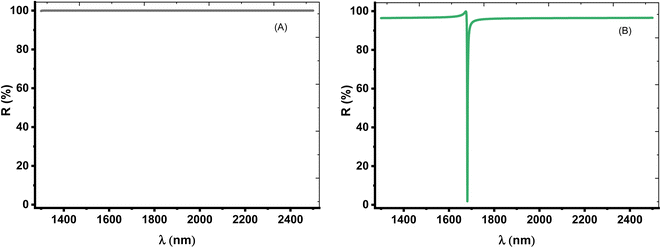
Thus, we aimed to investigate only one TP resonance through the reflectance spectrum. In this context, the role of the angle of incidence could be crucial. Thus, we consider TE mode of polarization at the oblique incidence in which the incidence angle is equivalent to 50°. Fig. 4A shows the intensity of the reflection for prism/(Si/CaF2)10/substrate structure, which is about 100% within the spectrum range at an angle of 50°. This is because the angle is now close to the critical angle and a total internal reflection (TIR) occurred. Physically, the optical path length (OPL) of a light ray moving through a medium is given by the product of the refractive index of the medium and the geometric length of the ray. The OPL is a very important in determining the phase shift of the light and governs diffraction and interference of light as it propagates. Based on Bragg's law, the bandgap of the PC structure could be due to the destructive interference of multiple reflections of light at each interface between the layers of the crystal. As the angle incident angle increase from 0 to 50°, the OPL changes, and hence the number of constructive interference increase and the number of peaks that can be localized in the cavity layer increases as well. This means that the number of localized resonance states increases. At an angle of 50°, only one dip starts to appear in the spectrum, and this is logic because the angle now is close to the critical angle. Then, all dips disappeared, and the intensity of the reflection is about 100% due to the total reflection.
On the other hand, for [prism/Au/water cavity/(Si/CaF2)10/substrate] designed structure, only one dip started to appear in the spectrum, as shown in Fig. 4B. When there is a light beam incident on the prism with an incident angle greater than the critical angle, a very small portion of light can penetrate the Au-prism interface and generate an evanescent wave [https://scitation.aip.org/content/contributor/AU0025156].50 This evanescent wave energized the surface plasmon wave (SPW). Therefore, the reflectivity of the incident beam will drop to zero, thereby leading to a single TP resonance.
The choice of such condition is coming after the optimization of the angle of incidence. Therefore, at 50°, a single TP resonance appears through the wavelengths of interest as shown in Fig. 4. From this figure, the dip showed a reflectivity of 1.82% where it is located at λTP = 1681.55 nm. Moreover, the change in optical path length produces a change in both the number and position of the reflectance dips with the increase of incidence angle. As a result, this dip will be the key axis during the detection procedure of our study.
The thickness of the Au layer has a strong effect on the TP resonance mode and sensor performance. The optimum value of the Au layer is shown in Fig. 5. Fig. 5A displays that the resonant TP dip is shifted downwards the lower wavelengths with increasing the Au layer's thickness from 5 nm to 40 nm. The intensity of dip reflectivity of the TP mode has a low value at the Au layer with a thickness of 20 nm, as shown in Fig. 5B. This condition corresponds to an excellent coupling of the TP resonance by reducing the electron energy loss and the narrow width of the dip. Therefore, the optimum value of the Au layer's thickness is 20 nm, which provides a relatively high sensor performance.
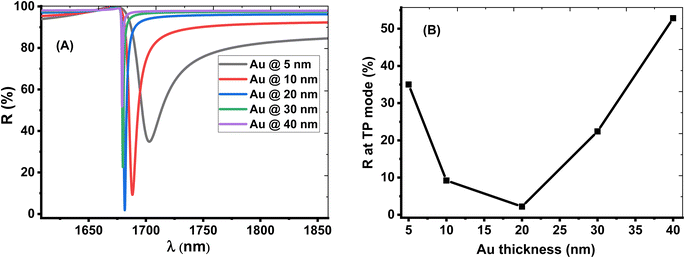 | ||
| Fig. 5 The effect of change the thickness of the Au layer on the(A) reflection spectrum (B) intensity of reflection at of TP resonance. | ||
Meanwhile, there a large difference between the defective PC designs such as the results presented in ref. 18 and our PC design. Notably, Chaves et al. discuss the role of 1D PCs in the detection and monitoring of water salinity based on the inclusion of a defect layer in the middle of the designed PCs.18 By introducing the defect layer, a resonant mode is introduced through the PBG due to the broken periodicity of the designed PC structure. Then, its position can be shifted with the variation of the saline solution concentration as a result of the changes in the OPL of the incident radiation with the refractive index of the defect layer. In contrast, our study is essentially based on the localization of TP resonance due to the deposition of a thin metallic layer on the top surface of a 1D PCs. In fact, we believe that the suggested design could be of a potential interest compared to the conventional 1D defective PCs due to its relatively high performance. Then, the inclusion of a cavity layer between the thin metallic layer and the 1D PCs does not provide any chance for introducing a resonant and its role is limited for the inclusion of the analyte. In particular, this layer is classified as a cap layer that could provide some effects on the path length of incident radiation.
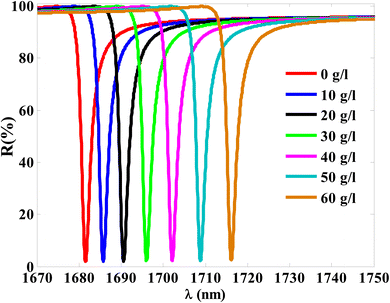
Thus, the position of TP resonance is expected to change significantly by immersing different concentrations of the NaCl through the cavity as shown in Fig. 6. In this regard, the proposed structure has been designed for detecting the NaCl concentration in water at room temperature (25 °C). Notably, within a small range of temperatures from 20 to 60 °C, the thermo-optic (TO) coefficients for Si, CaF2, and Au are very small. Moreover, some of the experimental verifications of PC structures on Si are insensitive to the little temperature changes especially that is close to room temperature.51 This means that the thermal effect on the sensor's behavior can be negligible in the temperature regime of interest for the working device.
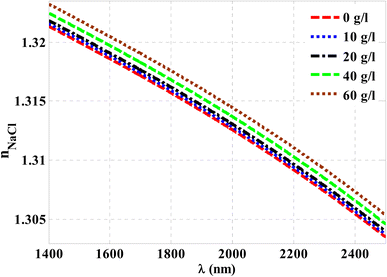
Thus, at 10 g l−1 of NaCl, the resonance dip (TP resonance) changed from 1681.55 to 1685.75 nm. A small increase in the refractive index of the cavity with increasing the NaCl concentration produces the shift in the wavelength position of TP resonance. Such an effect could lead to the change in the optical path length of the incident radiation. For more increase in the concentration of NaCl to 20 g l−1, 30 g l−1, 40 g l−1, 50 g l−1 and 60 g l−1, the resonance dip is shifted upwards to wavelength positions of 1690.55 nm, 1696.05 nm, 1702.1 nm, 1708.84 nm, and 1716.13 nm, respectively, as shown in Fig. 6 and the color map in Fig. 7. Moreover, the reflectance values of these dips is slightly increasing with the increase of NaCl concentration. Meanwhile, the reflectivity increases from 1.82% to 2.42% as the concentration increases from 0 g l−1 to 60 g l−1, respectively. Here, our design is characterized by a relative high sensitivity to the concentration variations despite the very little increase in the refractive index of the cavity with the increments of NaCl concentrations as shown in Fig. 8. Such a result could make our design very promising in the detection and sensing of NaCl concentration and salinity as well compared to other physical methods and techniques.
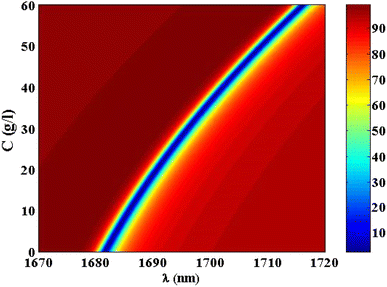 | ||
| Fig. 7 A color map for the reflectivity of TP resonance at different concentrations of NaCl solution. | ||
After that, the TP resonance position regarding NaCl concentration was plotted in Fig. 9. The figure indicates that the increase in the NaCl concentration leads to a significant shift in the position of TP resonance towards the higher wavelengths. Accordingly, the TP resonance position increases at increasing the NaCl concentration. This response can be described by fitting the numerical results as depicted in Fig. 9. The quadratic fitting leads to a relatively high coincidence with the investigated numerical results in Fig. 9. Such fitting could be mathematically described according to the following equation:
| TP position (nm) = 0.003125C2 + 0.38918C + 1681.55 | (10) |
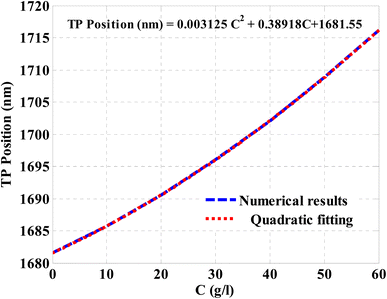 | ||
| Fig. 9 The resulted relation between the spectral position of TP resonance and the NaCl concentration according to a quadratic fitting. | ||
This equation reveals that the concentration of NaCl solution can be simply obtained based on the TP resonance position. In other words, at a distinct wavelength of TP resonance, eqn (10) can be solved to obtain the exact value of NaCl concentration.
Then, the performance of the designed structure is mandatory to determine the validity of such structure as an effective sensor for the monitoring and detecting of NaCl concentration and salinity as well. Thus, there are many different parameters that can highlight the sensor performance such as sensitivity (S), figure of merit (FM), detection limit (DL), signal to noise ratio (SNR) and quality factor (QF). These parameters are widely described and analyzed analytically in many literatures.42–46 The mathematical formulas of these parameters can be calculated from the following relations:52–56
 | (11) |
 | (12) |
 | (13) |
 | (14) |
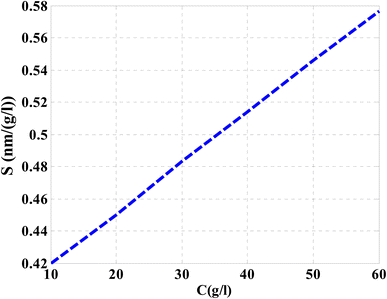
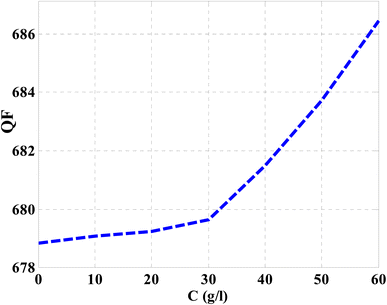
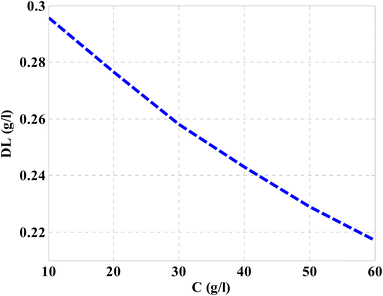
Then, the performance of the designed structure is mandatory to determine the validity of such structure as an effective sensor for the monitoring and detecting of NaCl concentration and salinity as well. In this regard, Fig. 10 describes the sensitivity of our design against the concentration of NaCl solution. The value of sensitivity is equivalent to the TP resonance shift due to the change in NaCl concentration. Fig. 10 shows a linear increase of sensitivity with the NaCl concentration. Here, the value of S can reach 0.576 nm (g l−1) as the concentration of the NaCl solution is equivalent to 60 g l−1. Such value is seemed to be very promising through the detection procedure especially in the monitoring of low concentrations. In addition to that, it could give a positive indication towards other parameters like the detection limit and quality factor as well. Therefore, we have plotted in Fig. 11 the change in the quality factor against the concentration variations. As you see from eqn (11)–(14), the values of sensitivity and QF in Fig. 10 and 11, respectively, increases due to the changes in the spectral position of TP resonance. Therefore, the displacement of the TP mode (ΔλTP) increases with NaCl concentration, which, in turn, makes the sensitivity and QF values increase with NaCl concentration as well. Here, QF describes the ratio between the wavelength of TP resonance relative to the full width at half maximum (FWHM). In this context, the presence of sharp dips with small values of FWHM leads to high values of QF. Fig. 11 indicates that the values of QF have a nonlinear increase with the increments of NaCl concentration. Such response is mainly connected with the values of the spectral position of the TP resonance and FWHM as well at a specified concentration of the NaCl solution. In particular, the changes in the concentration values leads to a significant effect on the refractive index of the cavity layer. Meanwhile, a different response of the OPL of the incident waves in the vicinity of the FWHM and TP spectral position is expected. In this regard, the QF has the value of 686.452 at NaCl concentration of 60 g l−1. Then, Fig. 12 shows the detection limit of the proposed sensor versus the variations of NaCl concentration. Such parameter has an important role on the sensors' performance. DL is strongly depending on the position of TP resonance, S, and QF. The Fig. 12 clarifies that the values of DL are approximately decreasing linearly with the concentration. DL provides a minimum value of 0.217 g l−1 at concentration = 60 g l−1. In addition, DL records relatively low values as a result of the high values of S and QF as well. In particular, low values of DL support the high performance of sensors.
Finally, to the best of our knowledge, the proposed design could be of significant interest as a promising platform for the detection and monitoring of NaCl concentration and salinity as well. Specifically, our designed sensor provides a relatively high performance compared to its counterparts in photonic and optical techniques as listed in Table 1. As illustrated in Table 1, the proposed sensor in this study has achieved a good reasonable performance compared to other designs in the literature according to the obtained performance parameter values. Based on Table 1, the introduced design has a high sensitivity value of 24![[thin space (1/6-em)]](https://www.rsc.org/images/entities/char_2009.gif) 700 (nm/RIU), which is considered higher than the values of previous designs. Also, the proposed sensor demonstrated a DL value of 5.91 × 10⁻⁶, which is better than that of previous designs. In addition, the proposed sensor showed a QF value of 686.5, which is an acceptable value compared to other designs.
700 (nm/RIU), which is considered higher than the values of previous designs. Also, the proposed sensor demonstrated a DL value of 5.91 × 10⁻⁶, which is better than that of previous designs. In addition, the proposed sensor showed a QF value of 686.5, which is an acceptable value compared to other designs.
| The designed structure | Sensitivity (nm/RIU) | QF | DL (RIU) | Reference |
|---|---|---|---|---|
| Photonic crystal biosensor | 1118 | Not mentioned | 10−3 | 57 |
| Photonic crystal cavity | 3300 | 103 | 10−5 | 58 |
| 1D-porous silicon photonic crystals | 6770 | 662 | Not mentioned | 59 |
| Photonic crystal cavity and fiber loop ring-down technique | 450 | Not mentioned | ∼1.6 × 10⁻⁴ | 60 |
| Photonic crystal containing graphene | 1179 | Not mentioned | ∼2.2 × 10⁻⁵ | 61 |
| Photonic crystal covered with a perforated gold film | 17 | 3 × 10⁴ | Not mentioned | 62 |
| Cavity photonic crystal | 777 | 2576 | Not mentioned | 63 |
| Photonic crystal cavities | 656 | 2719 | Not mentioned | 64 |
| [Prism/Au/water cavity/(Si/CaF2)10/substrate] | 24![[thin space (1/6-em)]](https://www.rsc.org/images/entities/char_2009.gif) 700 700 |
686.5 | 5.91 × 10⁻⁶ | Our design |
4 Conclusions
To sum up, we have demonstrated a theoretical excitation of TP resonance in the interface between Au layer and cavity layer for sensing and detection of NaCl concentrations in water. In this regard, the structure of the design, [prism/Au/water cavity/(Si/CaF2)10/substrate]. Moreover, the TMM and the optical characteristics of the constituent materials represent the main elements in obtaining the numerical investigations. Accordingly, at normal incidence, the numerical results demonstrated three TP dips at three different wavelengths. However, the increase in angle of incidence = 50° is crucial in reducing the number of dips to one. Such a strategy could be simpler for the detection of NaCl concentrations. As the water cavity is filled with NaCl of different concentrations ranging from 0 g l−1 to 60 g l−1, TP resonance is shifted towards the longer wavelengths. Accordingly, the suggested design provides a high performance compared to some previous PC and PC fiber designs. The sensitivity and detection limit of the suggested sensor could receive the values of 24![[thin space (1/6-em)]](https://www.rsc.org/images/entities/char_2009.gif) 700 nm per RIU (0.576 nm (g l−1)) and 0.217 g l−1, respectively. These obtained values could make our sensing tool a promising platform for the sensing and monitoring of NaCl concentration and salinity as well.
700 nm per RIU (0.576 nm (g l−1)) and 0.217 g l−1, respectively. These obtained values could make our sensing tool a promising platform for the sensing and monitoring of NaCl concentration and salinity as well.
Ethics approval
I, hereby, the corresponding author declare that the authors have thoroughly read the Journal Policy and admitted all its requirements. Specifically, I declare here that this contribution is original and has not been published anywhere. I also declare that this article doesn't contain any plagiarized materials. No part of this manuscript has been introduced in any conference or published in any journal.Data availability
The data that support the findings of this study will be made available from the corresponding author upon reasonable request.Author contributions
A. M. Ahmed and H. A. Elsayed conceived of the presented idea and developed the theory. A. M. Ahmed, A. H. M. Almawgani, G. A. Ali and H. A. Elsayed A. Mehaney performed the computations. W. Sabra wrote the manuscript with support from H. A. Elsayed, T. A. Taha and Z. A. Alrowaili, A. H. M. Almawgani, S. Asaduzzaman and G. A. Ali A. H. M. Almawgani and G. A. Ali visualization, administration and funding. All authors discussed the results and contributed to the final manuscript.Conflicts of interest
The authors declare they have no conflicts of interests.Acknowledgements
The authors are thankful to the Deanship of Scientific Research at Najran University for funding this work under the Research Priorities and Najran Research funding program grant code (NU/NRP/SERC/12/5).References
- Y. Zhao, Y. Liao, B. Zhang and S. Lai, J. Lightwave Technol., 2003, 21(5), 1334 CrossRef CAS.
- N. Reul, S. Fournier, J. Boutin, O. Hernandez, C. Maes, B. Chapron, G. Alory, Y. Quilfen, J. Tenerelli, S. Morisset, Y. Kerr, S. Mecklenburg and S. Delwart, Surv. Geophys., 2014, 35(3), 681 CrossRef.
- C. Gabarró, J. Font, A. Camps, M. Vall-llossera and A. Julià, Geophys. Res. Lett., 2004, 31(1), 1309 CrossRef.
- D. A. Pereira, O. Frazao and J. L Santos, Opt. Eng., 2004, 43(2), 299 CrossRef.
- S. I. Karaaslan and A. B. Tugrul, Eighth International Water Technology Conference (IWTC8 2004), Alexandria, Egypt, 2004, vol. 163 Search PubMed.
- S. Robinson and R. Nakkeeran, Photonic Sens., 2012, 2, 187 CrossRef CAS.
- S. John, Phys. Rev. Lett., 1987, 58(23), 2486 CrossRef CAS PubMed.
- E. Yablonovitch, Phys. Rev. Lett., 1987, 58(20), 2059–2062 CrossRef CAS PubMed.
- A. H. Aly, W. Sabra and H. A. Elsayed, J. Supercond. Novel Magn., 2013, 26, 553 CrossRef CAS.
- A. H. Aly and W. Sabra, J. Supercond. Novel Magn., 2016, 29, 1981 CrossRef CAS.
- A. H. Aly, W. Sabra and H. A. Elsayed, Int. J. Mod. Phys. B, 2017, 31, 1750123 CrossRef.
- A. M. Mohamed, W. Sabra, A. H. Aly, M. Mobarak and A. S. Shalaby, Phys. Scr., 2020, 95, 115503 CrossRef CAS.
- C. Wu, B. Guan, C. Lu and H. Tam, Opt. Express, 2011, 19(21), 20003 CrossRef CAS PubMed.
- F. Attivissimo, C. G. C. Carducci, A. M. L. Lanzolla, A. Massaro and M. R. Vadrucci, IEEE Sens. J., 2015, 15(1), 146 Search PubMed.
- D. Vigneswaran, N. Ayyanar, M. Sharma, M. Sumathi, M. S. M. Rajan and K. Porsezian, Sens. Actuators, A, 2017, 269, 22 CrossRef.
- I. S. Amiri, B. K. Paul, K. Ahmed, A. H. Aly, R. Zakaria, P. Yupapin and D. Vigneswaran, Microw. Opt. Technol. Lett., 2019, 61, 847 CrossRef.
- M. A. Mollah, M. Yousufali, M. R. B. A. Faysal, M. R. Hasan, M. B. Hossain and I. S. Amiri, Results Phys., 2020, 16, 103022 CrossRef.
- F. S. Chaves, H. V. Posada, V. Dhasarathan and M. S. M. Rajan, Optik, 2019, 185, 930 CrossRef.
- S. R. Qutb, A. H. Aly and W. Sabra, Int. J. Mod. Phys. B, 2021, 35, 2150012 CrossRef CAS.
- M. Kaliteevski, I. Iorsh, S. Brand, R. A. Abram, J. M. Chamberlain, A. V. Kavokin and I. A. Shelykh, Phys. Rev. B: Condens. Matter Mater. Phys., 2007, 76(16), 165415 CrossRef.
- M. K. Shukla and R. Das, Opt. Lett., 2018, 43(3), 362 CrossRef CAS PubMed.
- A. J. Fecteau and L. G. Fréchette, Opt. Mater. Express, 2018, 8(9), 2774 CrossRef.
- L. Ferrier, H. S. Nguyen, C. Jamois, L. Berguiga, C. Symonds, J. Bellessa and T. Benyattou, APL Photonics, 2019, 4(10), 106101 CrossRef.
- B. Auguié, M. C. Fuertes, P. C. Angelomé, N. L. Abdala, G. J. A. A. Soler Illia and A. Fainstein, ACS Photonics, 2014, 1(9), 775 CrossRef.
- A. J. Fecteau and L. G. Fréchette, Opt. Mater. Express, 2018, 8, 2774 CrossRef.
- M. L. S. Sudha, D. Pratyusha, W. Meher and B. B. N. Shivakiran, Nanophotonics, 2018, 10672, 106723E Search PubMed.
- Z. Wang, et al., J. Opt. Soc. Am. B, 2019, 36, 215 CrossRef CAS.
- S. Y. Vetrov, A. Y. Avdeeva, M. V. Pyatnov and I. V. Timofeev, Comput. Opt., 2020, 44(3), 319 Search PubMed.
- H. A. Elsayed, Mater. Chem. Phys., 2018, 216, 191 CrossRef CAS.
- H. A. Elsayed, Phys. Scr., 2020, 95(6), 065504 CrossRef CAS.
- A. M. Ahmed, A. Mehaney and H. A. Elsayed, Eur. Phys. J. Plus, 2021, 136, 626 CrossRef.
- A. Alabastri, S. Tuccio, A. Giugni, A. Toma, C. Liberale, G. Das, F. D. Angelis, E. D. Fabrizio and R. Zaccaria, Mater., 2013, 6, 4879 CrossRef PubMed.
- A. H. Aly and H. A. Elsayed, Phys. Scr., 2019, 94(12), 125501 CrossRef CAS.
- X. Li, L. Liu, J. Zhao and J. Tan, Appl. Spectrosc., 2015, 69, 635 CrossRef CAS PubMed.
- J. Chen, Z. Zhang and Y. Guo, J. Appl. Phys., 2022, 131, 215302 CrossRef CAS.
- M. Baskurt, J. Kang and H. Sahin, Phys. Chem. Chem. Phys., 2020, 22, 2949–2954 RSC.
- M. Shaban, A. M. Ahmed, E. Abdel-Rahman and H. Hamdy, Sci. Rep., 2017, 7, 41983 CrossRef CAS PubMed.
- J. P.-P. González, A. Lamure and F. Senocq, Surf. Coat. Technol., 2007, 201, 9437–9944 CrossRef.
- A. G. Nassiopoulou, V. Tsakiri, V. Ioannou-Sougleridis, P. Photopoulos, S. Menard, F. Bassani and F. Arnaud d’ Avitaya, J. Lumin., 1999, 80, 81 CrossRef.
- V. Ioannou-Sougleridis, T. Ouisse, A. G. Nassiopoulou, F. Bassani and F. Arnaud d'Avitaya, J. Appl. Phys., 2001, 89, 610 CrossRef CAS.
- T. Ejima, K. Ouchi and M. Watanabe, J. Electron Spectrosc. Relat. Phenom., 1999, 101–103 Search PubMed.
- E. Takeo, O. Katsumi and W. Makoto, Jpn. J. Appl. Phys., 2005, 44, 7A CrossRef.
- C. D. Salzberg and J. J. Villa, J. Opt. Soc. Am., 1957, 47, 244 CrossRef CAS.
- M. Daimon and A. Masumura, Appl. Opt., 2002, 41, 5275 CrossRef CAS PubMed.
- P. B. Johnson and R. W. Christy, Phys. Rev. B: Solid State, 1972, 6, 4370 CrossRef CAS.
- H. P. Chiang, H. T. Yeh, C. M. Chen, J. C. Wu, S. Y. Su, R. Chang, Y. J. Wu, D. P. Tsai and P. T. Leung, Opt. Commun., 2004, 241, 409 CrossRef CAS.
- A. M. Ahmed and A. Mehaney, Sci. Rep., 2019, 9, 6973 CrossRef PubMed.
- S. Amoudache, R. Moiseyenko, Y. Pennec, B. D. Rouhani, A. Khater, R. Lucklum and R. Tigrine, J. Appl. Physiol., 2016, 119(11), 114502 CrossRef.
- M. Zaremanesh, L. Carpentier, H. Gharibi, A. Bahrami, A. Mehaney, A. Gueddida, R. Lucklum, B. D. Rouhani and Y. Pennec, APL Mater., 2021, 9, 061114 CrossRef CAS.
- S. Anantha Ramakrishna, Am. J. Phys., 2003, 71, 6 Search PubMed.
- Zhang and Y. Shi, Opt. Lett., 2015, 40, 2 CAS.
- I. M. White and X. Fan, Opt. Express, 2008, 16(2), 1020 CrossRef PubMed.
- M. El Beheiry, V. Liu, S. Fan and O. Levi, Opt. Express, 2010, 18(22), 22702 CrossRef CAS PubMed.
- L. Rindorf, J. B. Jensen, M. Dufva, L. H. Pedersen, P. E. Hoiby and O. Bang, Opt. Express, 2006, 14, 8224 CrossRef CAS PubMed.
- M. Naftaly and R. Dudley, Opt. Lett., 2009, 34(8), 1213 CrossRef PubMed.
- A. M. Ahmed and M. Shaban, Appl. Phys. B, 2020, 126(4), 1 CrossRef.
- M. S. Mohamed, M. F. O. Hameed, N. F. Areed, M. El-Okr and S. Obayya, Appl. Comput. Electromagn. Soc. J., 2016, 31(7), 584 Search PubMed.
- Z. A. Zaky, B. Moustafa and A. H. Aly, Optical and, Quantum Electron., 2021, 53, 591 CrossRef CAS PubMed.
- A. Mehaney, M. M. Abadla and H. A. Elsayed, J. Mol. Liq., 2021, 322, 114978 CrossRef CAS.
- X. Qian, Y. Zhao, Y.-n. Zhang and Q. Wang, Sens. Actuators, B, 2016, 228, 665–672 CrossRef CAS.
- Y. Chen, J. Dong, T. Liu, Q. Zhu and W. Chen, Mod. Phys. Lett. B, 2016, 30, 1650030 CrossRef CAS.
- V. V. Klimov, A. A. Pavlov, I. V. Treshin and I. V. Zabkov, J. Phys. D: Appl. Phys., 2017, 50, 285101 CrossRef.
- N. A. Mohammed, M. M. Hamed, A. A. Khalaf and S. EL-Rabaie, Eur. Phys. J. Plus, 2020, 135, 1–22 CrossRef.
- Y. Gao, P. Dong and Y. Shi, Opt. Exp., 2020, 28, 12272–12278 CrossRef CAS PubMed.
Footnote |
| † Electronic supplementary information (ESI) available. See DOI: https://doi.org/10.1039/d3ra00308f |
| This journal is © The Royal Society of Chemistry 2023 |

