 Open Access Article
Ultrafine Pt nanoparticles anchored on core–shell structured zeolite–carbon for efficient catalysis of hydrogen generation†
Yue-Wei Weiabd,
Guang Yangd,
Xi-Xi Xud,
Yan-Yan Liu e,
Bao-Jun Li
 *c,
Yong-Zhao Wang
 *ab and
Yong-Xiang Zhao*ab
aSchool of Chemistry and Chemical Engineering, Shanxi University, Taiyuan 030006, China. E-mail: catalyst@sxu.edu.cn; yxzhao@sxu.edu.cn
bEngineering Research Center of Ministry of Education for Fine Chemicals, Shanxi University, Taiyuan 030006, China
cResearch Center of Green Catalysis, College of Chemistry, Zhengzhou University, Zhengzhou 450001, China. E-mail: lbjfcl@zzu.edu.cn
dTobacco College of Henan Agricultural University, Zhengzhou 450002, China
eCollege of Science, Henan Agricultural University, Zhengzhou 450002, China
First published on 8th March 2023
Abstract
Ammonia borane (AB) is a potential hydrogen storage material with high-efficiency hydrolytic dehydrogenation under a suitable catalyst. Noble metal catalysts have drawn a lot of attention. In this study, a carbon-coated zeolite was obtained by calcination at high temperatures using glucose as a carbon source. Pt nanoparticles were fixed on a core–shell composite support by a simple chemical reduction method. A series of catalysts were prepared with different synthesis parameters. The results show that PSC-2 has excellent catalytic performance for hydrolytic dehydrogenation of AB in alkaline solution at room temperature, and the turnover frequency (TOF) is 593 min−1. The excellent catalytic performance is attributed to the carbon layer on the zeolite surface which inhibits the aggregation or deformation of metals in the catalytic reaction. The metal-support interaction activates the water and accelerates the rate-limiting step of hydrolysis. The activation energy (Ea = 44 kJ mol−1) was calculated based on the reaction temperature. In addition, the kinetics of AB hydrolysis was studied, and the effects of catalyst concentration, AB concentration and NaOH concentration on AB hydrolysis rate were further investigated. The high-efficiency catalyst prepared in this work provides a new strategy for the development of chemical hydrogen production in the field of catalysis.
1. Introduction
Increasing energy consumption and environmental degradation make the development of clean energy particularly important. To meet the energy demand, people must develop new alternative energy sources. Hydrogen is an excellent energy carrier that is environmentally friendly after combustion and has a higher energy density than fossil fuels. It is widely regarded as one of the most promising clean energy sources.1–5 However, the efficient storage and controlled release of hydrogen limit the practical application of hydrogen energy. Therefore, safe and reliable storage of hydrogen under environmental conditions is widely studied.6–9 Hydrogen can be stored chemically in some materials, such as metal hydrides,10 hydrazine hydrate,11 borohydrides,12,13 and ammonia borane (AB).14,15 The advantages of high hydrogen content (19.6 wt%), stability and non-toxicity make AB a potential hydrogen storage material.16–18 AB is stable in aqueous solution for a long time, but it has good thermodynamics for hydrolysis and release of hydrogen. Each mole of AB can release 3 mol of H2, as shown in reaction (1).| NH3BH3 + 2H2O → NH4+ +BO2− + 3H2↑ | (1) |
A safe, effective, and useful hydrogen production technique, AB's hydrolytic hydrogen production can be controlled by the catalyst and benefits from mild reaction conditions and no CO.19 Owing to the strong hydrolysis resistance of AB aqueous solution under environmental conditions, the suitable catalyst is needed to accelerate hydrolysis reaction. A suitable catalyst is key to the hydrolysis reaction of AB.20,21 At present, many catalysts for hydrolytic dehydrogenation of AB have been extensively studied, including transition metal catalysts such as Pt,22,23 Rh,24,25 Ru,26,27 Pd,28,29 Co,30,31 and Ni.32,33 Although noble metals have a high price and few resources, they have characteristics of long life and high activity. Previous studies have shown that catalysts containing noble metals have higher catalytic activity and lower activation energy.34–36 However, to realize the practical application of AB in hydrogen energy, it is still a great challenge to develop efficient and stable catalysts. Pt-based catalysts have attracted much attention as excellent catalysts in various reactions.37,38 Highly scattered Pt nanoparticles (NPs) have been prepared using a variety of supports to increase the number of atoms that are exposed to the catalyst surface and hence enhance the catalytic efficiency of the catalyst.39,40 Suitable support is very important for the stability and activity of metal-based catalysts. The catalysts show excellent catalytic activity because the support materials with large specific surface areas and suitable porosity can evenly spread metal NPs and provide a synergistic effect.41–46 Shen et al. reported engineering bimodal oxygen vacancies and Pt to boost the activity toward water dissociation.47 A bimodal oxygen vacancy (VO) catalysis strategy is adopted to boost the efficient water dissociation on Pt nanoparticles. The single facet-exposed TiO2 surface and NiOx nanocluster possess two modes of VO different from each other. In ammonia borane hydrolysis, the highest catalytic activity among Pt-based materials is achieved with a turnover frequency of 618 min−1 under alkaline-free conditions at 298 K. Zeolite is widely used as a catalyst or carrier material in the large-scale petroleum industry.48,49 However, the metal NPs on the catalyst surface tend to aggregate and form larger particles. The porous structure of carbon materials can effectively prevent the aggregation of metal NPs and increase their active sites. Carbon-based materials are widely used as supports.50,51 Liu et al. reported a NiRu alloy anchored on the surface of nitrogen-doped carbon-coated titanium dioxide showed the highest catalytic activity (2.51 × 10⁵ mL min−1 gRu−1) for NH3BH3 hydrolysis at 298 K. The unprecedented activity is beyond previous reports.52
In this paper, a carbon–zeolite support was prepared by calcination at high temperatures with glucose as carbon source. The resulting composite support was impregnated in the Pt precursor solution. By a simple chemical reduction method, the Pt NPs were fixed on composite support with a core–shell structure, and the supported Pt-based catalyst was obtained. A series of catalysts (PSC-x) were prepared with different synthesis parameters. The results show that PSC-2 has excellent catalytic performance for hydrolytic dehydrogenation of AB at room temperature, and the turnover frequency (TOF) is 593 min−1. In addition, the catalytic mechanism of AB hydrolysis was proposed. The high catalytic activity is attributed to the metal-support interaction and the inhibition of metal aggregation or deformation by the carbon layer on the zeolite surface. According to the reaction temperature, the activation energy (Ea = 44 kJ mol−1) was obtained. The interaction of Pt–zeolite speeds up the rate-limiting step of water dissociation in the hydrolysis reaction. This study provides a new opportunity for the industrial application of noble metal nanocatalysts in the field of hydrogen energy.
2. Experimental section
2.1 Preparation of materials
2.2 Characterization
The crystalline phases of the prepared catalysts were characterized by X-ray powder diffraction (XRD, Bruker/D8-Advance, Cu Kα, λ = 1.5418 Å) in the 2θ range from 5° to 80°. The Raman spectrum was recorded on a HORIBA LabRAM HR Evolution Raman Spectrometer (Horiba Scientific, Japan) with excitation from the 532 nm line of the Ar-ion laser at a power of about 5 mW. The morphology of catalysts was studied by using transmission electron microscope (HRTEM, FEI Tecnai G2 F20 S-TWIN electron microscope, operating at 200 kV) and scanning electron microscopy (SEM, ZEISS sigma500, Germany). The metal content was determined by inductively coupled plasma optical emission spectrometer (ICP-OES, Agilent-5110, USA). X-ray photoelectron spectroscopy (XPS) was recorded on a Thermo ESCALAB 250 electron spectrometer with an Al Kα = 1486.6 eV excitation source, and the binding energy was calibrated by reference to the C 1s peak (284.8 eV) to reduce the charge effect of the sample. The N2 sorption isotherms were measured on surface area and pore size analyzer (MicromeriticTristar 3000, USA) at 77 K. The specific surface areas (SBET) of materials were calculated by the multi-point Brunauer–Emmett–Teller (BET) method. The pore size distribution was evaluated by the Barrett–Joyner–Halenda (BJH).The hydrogen production from AB hydrolysis was monitored by the water displacement method. The catalyst (20 mg) was added to a 25 mL flask, and the flask was placed in a magnetic stirring water bath at a constant temperature of 25 °C. The speed of the stirring device is controlled at 500 rpm. An upside-down measuring cylinder filled with water is used to monitor the volume of hydrogen. A mixture of AB (84 mg) and NaOH (1 M, 10 mL) is then quickly injected into the flask. Bubbles can be observed in the cylinder. Record the time every 10 mL. According to the obtained data (at 80 mL), the TOF value of the catalyst was calculated according to the following formula:
 | (2) |
TOF is the turnover frequency, nH2 is the number of moles of hydrogen, nPt is the number of moles of platinum, and t is the time of hydrogen to 80 mL, in minutes.
3. Results and discussion
Fig. 1a shows the preparation process of the catalyst. The supported catalyst in this study was synthesized by a simple in situ reduction method. Firstly, zeolite and glucose are mixed thoroughly, and then carbon–zeolite support is formed after high-temperature calcination. The Pt metal precursor was reduced by sodium borohydride to form metal nanoparticles, which were effectively anchored to support. Carbon materials effectively limit the aggregation of Pt NPs. The interaction between metal and support enhances the catalytic activity of the catalyst.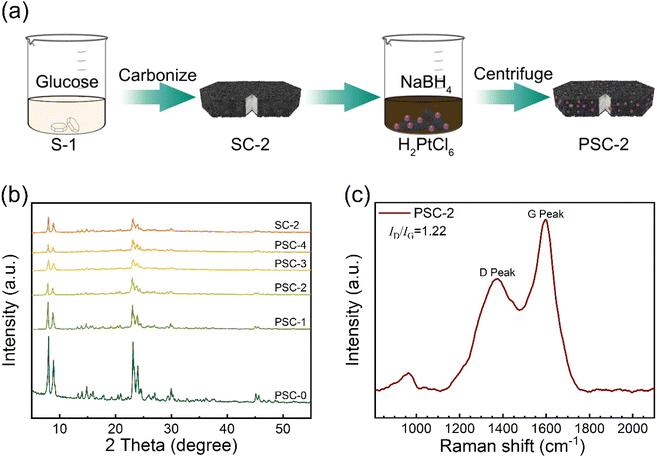 | ||
| Fig. 1 (a) The preparation process of PSC-2, (b) XRD patterns of catalysts and support, (c) Raman spectra of PSC-2. | ||
Phase analysis of support and catalyst was performed by X-ray powder diffraction (Fig. 1b). The results show that the broad peak at about 23.6° is identified as amorphous carbon. The diffraction peak between 8°–30° is assigned to the standard peak position of S-1 (JCPDS Card No. 44-0696). The intensity and position of the diffraction peak of support do not shift. This indicated that the structure of support remained intact without loss of skeleton lattice and crystallinity after the Pt precursor was reduced during catalyst synthesis. However, the characteristic peak of Pt NPs was not found, which was attributed to the small particle size and a low load of Pt NPs in the catalyst. The catalyst was tested and analyzed by Raman spectroscopy (Fig. 1c). Two distinct peaks in the figure are attributed to the best catalyst (PSC-2). The D and G peaks are Raman characteristic peaks of C atom crystals. Peak D near 1381 cm−1 represents a defect in the lattice of C atoms. Peak G near 1594 cm−1 represents the in-plane stretching vibration of sp2 hybridization of the C atom.53,54 The intensity ratio (ID/IG) of peak D to peak G is 1.22, indicating that the C-atom crystal has more defects. The integrated area data of D and G peak are shown in Table S1 of ESI.†
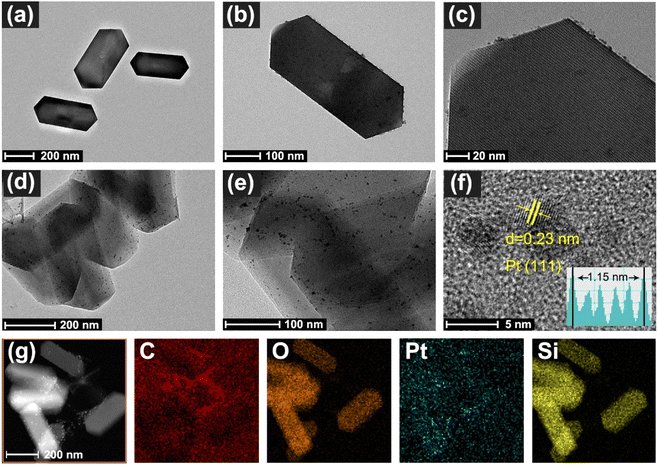
The morphology and structure of the catalyst were observed by TEM. The TEM image of PSC-0 is shown in Fig. 2a–c, showing slight aggregation of metal nanoparticles on the catalyst surface. Fig. 2d–f is attributed to PSC-2. It can be observed that S-1 is coated with carbon, and Pt NPs are uniformly distributed on the catalyst surface. Fig. S1† shows the scanning electron microscope image of PSC-2. The results show that the porous structure of support can effectively inhibit the aggregation of metal particles, thus improving the catalytic performance.55 As can be seen from Fig. 2f, the particle size of Pt is between 3–5 nm. The crystal lattice with a spacing of 0.23 nm is attributed to the (111) face of Pt (JCPDS No. 04-0802). In addition, Fig. 2g shows a high-angle annular dark field-scanning transmission electron microscope (HAADF-STEM) image of PSC-2. The elements C, O, Pt, and Si were identified by element mapping, and Pt was uniformly distributed on the catalyst surface. The content of Pt in the catalyst was measured by ICP-OES (Table S2†).
The chemical composition and valence states of PSC-2 were analyzed by X-ray photoelectron spectroscopy (XPS). The spectra in Fig. S2† identify Pt (75 eV), C (287 eV), Si (103 eV), and O (557 eV) elements in the catalyst. This is consistent with the results in EDX. Fig. 3a shows the C 1s spectrum of PSC-2, and the peaks at 284.8, 285.9, and 288.9 eV are attributed to C–C, C–O, and C![[double bond, length as m-dash]](https://www.rsc.org/images/entities/char_e001.gif) O, respectively.56 Fig. 3b shows the spectrum of Pt 4f. The Pt element mainly exists in the metallic form of Pt(0), and the peaks at 75.0 and 71.7 eV are attributed to Pt 4f5/2 and Pt 4f7/2, respectively.57 The results show that the binding energy of Pt is lower than reported, and the introduction of SC makes electron transfer to surface Pt atoms easier.58 The reduction in binding energy is attributed to the electron-rich Pt. The electron-rich metal surface promotes the activation of H2O, thus increasing the activity of the catalyst. Fig. S3† shows the O 1s spectrum of PSC-2. The peak value at 534.0 eV corresponds to oxygen atoms in SiO2. Fig. S4† shows the Si 2p spectrum of PSC-2, and the peak at 104.6 eV is attributed to Si.
O, respectively.56 Fig. 3b shows the spectrum of Pt 4f. The Pt element mainly exists in the metallic form of Pt(0), and the peaks at 75.0 and 71.7 eV are attributed to Pt 4f5/2 and Pt 4f7/2, respectively.57 The results show that the binding energy of Pt is lower than reported, and the introduction of SC makes electron transfer to surface Pt atoms easier.58 The reduction in binding energy is attributed to the electron-rich Pt. The electron-rich metal surface promotes the activation of H2O, thus increasing the activity of the catalyst. Fig. S3† shows the O 1s spectrum of PSC-2. The peak value at 534.0 eV corresponds to oxygen atoms in SiO2. Fig. S4† shows the Si 2p spectrum of PSC-2, and the peak at 104.6 eV is attributed to Si.
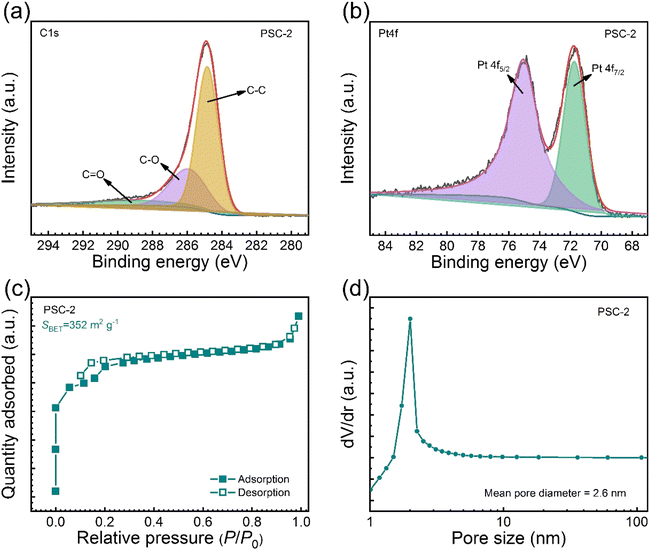 | ||
| Fig. 3 (a and b) XPS spectra of PSC-2, (c) nitrogen adsorption and desorption isotherms of PSC-2, and (d) pore size distributions of PSC-2 calculated by BJH method. | ||
Fig. 3c shows the N2 adsorption–desorption test. Both support and catalyst show type I isotherms and type H4 hysteresis loops.59,60 The specific surface areas were 369 m2 g−1 and 352 m2 g−1, respectively. The reduction of specific surface area was attributed to Pt loading on the catalyst surface occupying part of the pore. As shown in Fig. 3d, the aperture distribution was analyzed using the BJH model (Barrett–Joiner–Halenda). The results show that the support and catalyst are abundant in micropores and mesoporous. The porous structure can limit the aggregation of metal particles, thus improving the activity of the catalyst.
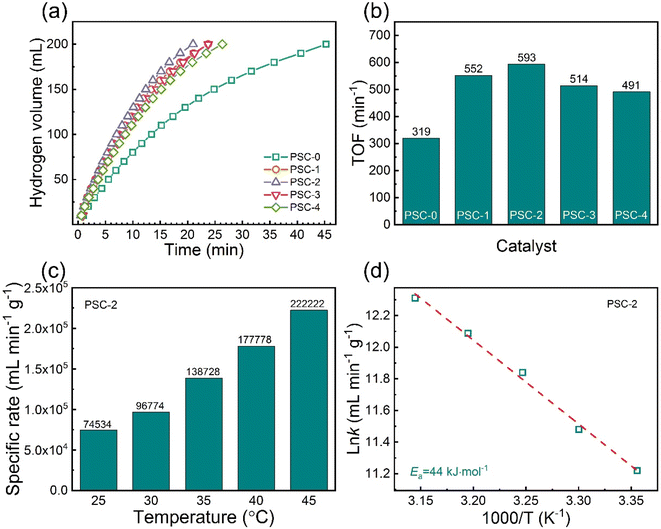
Suitable support is crucial to the catalyst. A series of catalysts were prepared by changing the parameters of glucose content in the process of catalyst preparation. In addition, S-1 or SC is used as a catalyst to catalyze the hydrolysis of AB, and no reaction occurred within 2 h. The results show that S-1 and SC have no catalytic activity for AB hydrolysis under the same conditions, and Pt is the key for AB hydrolysis. Under environmental conditions, different catalysts are used to catalyze AB hydrolysis to produce hydrogen, and the results are shown in Fig. 4a. The TOF values of different catalysts are obtained by calculation. It can be observed from Fig. 4b that PSC-0 exhibits poor catalytic activity, which is attributed to the lack of carbon protection on the surface of the catalyst, leading to the aggregation of metal particles. However, catalyst activity increased significantly when the zeolite is coated with carbon. Protection of carbon can effectively limit the aggregation of metal particles, and the performance of the catalyst is improved. By adjusting the carbon content, catalyst activity is affected. The addition of excess carbon in the preparation process resulted in a decrease in catalytic activity, possibly owing to the limited interaction of S-1 with Pt NPs. The results show that SC-2 is the best catalyst support, and PSC-2 has excellent catalytic activity with a TOF of 593 min−1.
The catalytic hydrogen production results of PSC-2 at different reaction temperatures (25–45 °C) are shown in Fig. 4c. The rate of hydrogen production increases with increasing temperature, which is attributed to the fact that high temperature increases the activity of water molecules and accelerates the rate-limiting step of the hydrolysis reaction.
Within the temperature range of 298–318 K, the Arrhenius curve of ln![[thin space (1/6-em)]](https://www.rsc.org/images/entities/char_2009.gif) k and the inverse of absolute temperature (1/T) is a straight line (Fig. 4d). According to the slope, the activation energy of PSC-2 is 44 kJ mol−1, which is lower than that of most reported metal-based catalysts. PSC-2 is used as a catalyst in subsequent kinetic studies.
k and the inverse of absolute temperature (1/T) is a straight line (Fig. 4d). According to the slope, the activation energy of PSC-2 is 44 kJ mol−1, which is lower than that of most reported metal-based catalysts. PSC-2 is used as a catalyst in subsequent kinetic studies.
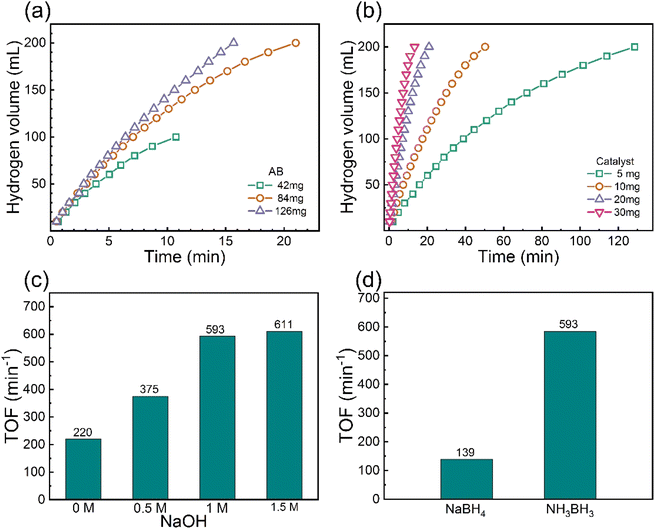
In addition, the kinetics of the catalyst is explored. The influence of different AB concentrations on catalyst activity is explored, as shown in Fig. 5a. The results show that amount of hydrogen varies with AB concentration (only 200 mL of data). A line with a slope of 0.16 is fitted between the catalytic rate and AB concentration (Fig. S5†), indicating that AB hydrolysis is a quasi-zero-order reaction with respect to AB concentration.61 Under the same conditions, different catalyst dosages (5, 10, 20, and 30 mg) are used in the experiment, as shown in Fig. 5b. The catalytic activity is positively correlated with the content of the catalyst, and the hydrolysis rate of AB is increased with the increase of active component. A line with a slope of 1.2 is fitted according to the catalytic rate and catalyst amount (Fig. S6†), indicating that AB hydrolysis is a first-order reaction with regard to catalyst amount. The rate of hydrolysis of AB is accelerated by NaOH. Therefore, the influence of different NaOH concentrations on AB hydrolysis is explored (Fig. 5c). In the initial stage, the catalytic rate increases with the increase of NaOH. The improvement of the catalytic rate is attributed to the coordination of OH− ions with the metal surface, which makes the metal surface more electron-rich and promotes the activation of H2O.62 AB is difficult to hydrolyze in an aqueous solution of NaOH. NaOH is considered a cocatalyst. However, excessive NaOH has an adverse effect on the reaction device and catalyst. Excessive OH− coordination may occupy the active site on the catalyst surface, resulting in decreased activity. NaBH4 is one of the most widely studied hydrogen storage materials.63,64 Therefore, PSC-2 is used as a catalyst for hydrolysis of NaBH4 to produce hydrogen (Fig. 5d). The final TOF value is only 139 min−1. The results show that PSC-2 has catalytic activity for NaBH4 but has the best catalytic effect for AB.
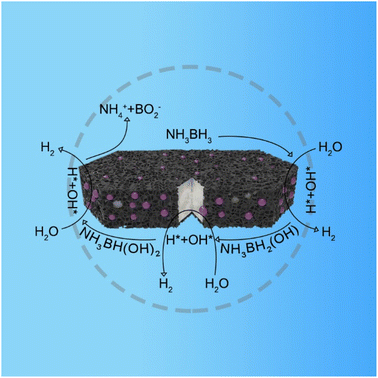
The mechanism of catalytic hydrolysis of AB by PSC-2 is proposed (Fig. 6). The hydrolysis of AB occurs on the surface of the catalyst.65–67
First, H2O and NH3BH3 molecules are activated by electron-rich Pt NPs. H* and OH* are formed by breaking the O–H bond in H2O. Similarly, NH3BH3 is activated causing the B–H bond to break, forming  and H*. Two H* adsorbs form an H2 molecule and dissociate from the catalyst surface. The OH* attacks
  to form NH3BH2OH* through a reduction–oxidation step. Second, another H2O molecule and NH3BH2OH* are activated again, and two H* form an H2 molecule in the same way and dissociate from the catalyst surface. An H2O molecule is released owing to
  instability formed by OH* and NH3BHOH*. Subsequently, an H2 molecule is formed again owing to the B–H bond in NH3BHO* and the O–H bond in H2O breaking. Eventually, OH* and NH3BO* form NH4+ and BO2−, which is attributed to the attraction of
  to H. The interaction between S-1 and Pt makes H2O more easily dissociated and speeds up the rate-limiting step of AB hydrolysis. Therefore, the catalytic performance of PSC-2 is among the top Pt-based catalysts.
4. Conclusions
In summary, carbon–zeolite supports with core–shell structures are prepared using glucose as a carbon source. A series of Pt-based catalysts with different carbon content is obtained. The results show that PSC-2 exhibits excellent catalytic activity (TOF = 593 min−1) for AB hydrolysis under the condition of 298 K alkaline solution. This is attributed to the metal-support interaction between Pt and zeolite which effectively promotes the activation of H2O and improves the performance of the catalyst. The protection of carbon limits the aggregation of metal particles and increases the exposure of the active site. The apparent activation energy of PSC-2 is determined as Ea = 44 kJ mol−1 based on kinetic studies. The electron transfer of metal-carrier interaction is affected by carbon content. PSC-2 is an efficient Pt-based catalyst whose excellent catalytic performance provides a new strategy in the field of catalysis. This work will advance the development of hydrogen energy.Conflicts of interest
The authors declare no competing financial interests.Acknowledgements
This study was financially supported by the National Natural Science Foundation of China (No. 22279118, 31901272, U1204203, and 21401168) and the Key Projects of Shanxi Coal-based Low Carbon Joint Fund (No. U1710221).References
- I. P. Jain, Int. J. Hydrogen Energy, 2009, 34, 7368–7378 CrossRef CAS.
- I. Staffell, D. Scamman, A. V. Abad, P. Balcombe, P. E. Dodds, P. Ekins, N. Shah and K. R. Ward, Energy Environ. Sci., 2019, 12, 463–491 RSC.
- A. Zuettel, A. Remhof, A. Borgschulte and O. Friedrichs, Philos. Trans. R. Soc., A, 2010, 368, 3329–3342 CrossRef PubMed.
- Z. X. Yang, X. G. Li, Q. L. Yao, Z. H. Lu, N. Zhang, J. Xia, K. Yang, Y. Q. Wang, K. Zhang, H. Z. Liu, L. T. Zhang, H. J. Lin, Q. J. Zhou, F. Wang, Z. M. Yu and J. M. Ma, Rare Met., 2022, 41, 3251–3267 CrossRef CAS.
- M. Balat, Int. J. Hydrogen Energy, 2008, 33, 4013–4029 CrossRef CAS.
- C. D. Mboyi, D. Poinsot, J. Roger, K. Fajerwerg, M. L. Kahn and J.-C. Hierso, Small, 2021, 17, 2102759 CrossRef CAS PubMed.
- C. G. Lang, Y. Jia and X. D. Yao, Energy Storage Mater., 2020, 26, 290–312 CrossRef.
- P. Jena, J. Phys. Chem. Lett., 2011, 2, 206–211 CrossRef CAS.
- A. M. Abdalla, S. Hossain, O. B. Nisfindy, A. T. Azad, M. Dawood and A. K. Azad, Energy Convers. Manage., 2018, 165, 602–627 CrossRef CAS.
- Y. F. Liu, K. Zhong, M. X. Gao, J. H. Wang, H. G. Pan and Q. D. Wang, Chem. Mater., 2008, 20, 3521–3527 CrossRef CAS.
- S. K. Singh, X.-B. Zhang and Q. Xu, J. Am. Chem. Soc., 2009, 131, 9894–9895 CrossRef CAS PubMed.
- L. H. Yao, X. G. Li, W. F. Peng, Q. L. Yao, J. H. Xia and Z. H. Lu, Inorg. Chem. Front., 2021, 8, 1056–1065 RSC.
- Y. Y. Liu, J. Zhang, X. J. Zhang, B. J. Li, X. Y. Wang, H. Q. Cao, D. Wei, Z. F. Zhou and A. K. Cheetham, J. Mater. Chem. A, 2016, 4, 4280–4287 RSC.
- R. F. Shen, Y. Y. Liu, H. Wen, T. Liu, Z. K. Peng, X. L. Wu, X. G. Ge, S. Mehdi, H. Q. Cao, E. J. Liang, J. C. Jiang and B. J. Li, Appl. Catal., B, 2022, 306, 121100 CrossRef CAS.
- H. H. Zhang, K. Zhang, S. Ashraf, Y. P. Fan, S. Y. Guan, X. L. Wu, Y. S. Liu, B. Z. Liu and B. J. Li, Energy Environ. Mater., 2021, 6, e12273 Search PubMed.
- U. Sanyal, U. B. Demirci, B. R. Jagirdar and P. Miele, ChemSusChem, 2011, 4, 1731–1739 CrossRef CAS PubMed.
- S. Akbayrak and S. Özkar, Int. J. Hydrogen Energy, 2018, 43, 18592–18606 CrossRef CAS.
- H. L. Jiang and Q. Xu, Catal. Today, 2011, 170, 56–63 CrossRef CAS.
- C. L. Wang and D. Astruc, Chem. Soc. Rev., 2021, 50, 3437–3484 RSC.
- C. Yüksel Alpaydın, S. K. Gülbay and C. Ozgur Colpan, Int. J. Hydrogen Energy, 2020, 45, 3414–3434 CrossRef.
- Q. M. Sun, N. Wang, Q. Xu and J. H. Yu, Adv. Mater., 2020, 32, 2001818 CrossRef CAS PubMed.
- W. Y. Chen, W. Z. Zheng, J. B. Cao, W. Z. Fu, G. Qian, D. Chen, X. G. Zhou and X. Z. Duan, ACS Catal., 2020, 10, 11417–11429 CrossRef CAS.
- M. Morishita, A. Nozaki, H. Yamamoto, N. Fukumuro, M. Mori, K. Araki, F. Sakamoto, A. Nakamura and H. Yanagita, RSC Adv., 2021, 11, 14063–14070 RSC.
- D. Ozhava and S. Ozkar, Appl. Catal., B, 2018, 237, 1012–1020 CrossRef CAS.
- D. Özhava and S. Özkar, Appl. Catal., B, 2016, 181, 716–726 CrossRef.
- X. Y. Huang, Y. Y. Liu, H. Wen, R. F. Shen, S. Mehdi, X. L. Wu, E. J. Liang, X. J. Guo and B. J. Li, Appl. Catal., B, 2021, 287, 119960 CrossRef CAS.
- H. Can and Ö. Metin, Appl. Catal., B, 2012, 125, 304–310 CrossRef CAS.
- J. Manna, S. Akbayrak and S. Ozkar, Appl. Catal., B, 2017, 208, 104–115 CrossRef CAS.
- S. Akbayrak, G. Çakmak, T. Öztürk and S. Özkar, Int. J. Hydrogen Energy, 2021, 46, 13548–13560 CrossRef CAS.
- Y. Y. Liu, G. S. Han, X. Y. Zhang, C. C. Xing, C. X. Du, H. Q. Cao and B. J. Li, Nano Res., 2017, 10, 3035–3048 CrossRef CAS.
- S. Akbayrak and S. Ozkar, J. Colloid Interface Sci., 2021, 596, 100–107 CrossRef CAS PubMed.
- C. C. Cui, Y. Y. Liu, S. Mehdi, H. Wen, B. J. Zhou, J. P. Li and B. J. Li, Appl. Catal., B, 2020, 265, 118612 CrossRef CAS.
- S. Chen, B. B. Gong, J. Gu, Y. Lin, B. Yang, Q. Q. Gu, R. Jin, Q. Liu, W. X. Ying, X. X. Shi, W. L. Xu, L. H. Cai, Y. Li, Z. H. Sun, S. Q. Wei, W. H. Zhang and J. L. Lu, Angew. Chem., Int. Ed., 2022, 61, e202211919 CAS.
- S. Akbayrak, Z. Ozcifci and A. Tabak, J. Colloid Interface Sci., 2019, 546, 324–332 CrossRef CAS PubMed.
- M. Chandra and Q. Xu, J. Power Sources, 2007, 168, 135–142 CrossRef CAS.
- X. G. Li, C. L. Zhang, M. H. Luo, Q. L. Yao and Z. H. Lu, Inorg. Chem. Front., 2020, 7, 1298–1306 RSC.
- M. A. Khalily, H. Eren, S. Akbayrak, H. H. Susapto, N. Biyikli, S. Ozkar and M. O. Guler, Angew. Chem., Int. Ed., 2016, 55, 12257–12261 CrossRef CAS PubMed.
- J. Yang, W. Z. Fu, C. Q. Chen, W. Y. Chen, W. G. Huang, R. O. Yang, Q. Q. Kong, B. Y. Zhang, J. X. Zhao, C. M. Chen, J. Luo, F. Yang, X. Z. Duan, Z. Jiang and Y. Qin, ACS Catal., 2021, 11, 4146–4156 CrossRef CAS.
- X. Zhao, Z. Q. Yang, W. J. Wang, Y. X. Li, X. H. Zhou and H. B. Zhang, J. Mater. Chem. A, 2020, 8, 7171–7176 RSC.
- J. J. Li, Q. Q. Guan, H. Wu, W. Liu, Y. Lin, Z. H. Sun, X. X. Ye, X. S. Zheng, H. B. Pan, J. F. Zhu, S. Chen, W. H. Zhang, S. Q. Wei and J. L. Lu, J. Am. Chem. Soc., 2019, 141, 14515–14519 CrossRef CAS PubMed.
- J. K. Zhang, W. Y. Chen, H. B. Ge, C. Q. Chen, W. J. Yan, Z. Gao, J. Gan, B. Y. Zhang, X. Z. Duan and Y. Qin, Appl. Catal., B, 2018, 235, 256–263 CrossRef CAS.
- S. S. Acharyya, S. Ghosh, Y. Yoshida, T. Kaneko, T. Sasaki and Y. Iwasawa, ACS Catal., 2021, 11, 6698–6708 CrossRef CAS.
- M. Boronat and A. Corma, ACS Catal., 2019, 9, 1539–1548 CrossRef CAS PubMed.
- H. Shi, S. Eckstein, A. Vjunov, D. M. Camaioni and J. A. Lercher, Nat. Commun., 2017, 8, 15442 CrossRef PubMed.
- Y. Li, Y. Fu, C. Lai, L. Qin, B. Li, S. Liu, H. Yi, F. Xu, L. Li, M. Zhang, M. Xu, C. Du and W. Chen, Environ. Sci.: Nano, 2021, 8, 3067–3097 RSC.
- S. Ghosh, S. S. Acharyya, Y. Yoshida, T. Kaneko, Y. Iwasawa and T. Sasaki, ACS Appl. Mater. Interfaces, 2022, 14, 18464–18475 CrossRef CAS PubMed.
- R. F. Shen, Y. Y. Liu, H. Wen, X. L. Wu, G. S. Han, X. Z. Yue, S. Mehdi, T. Liu, H. Q. Cao, E. J. Liang and B. J. Li, Small, 2021, 18, 2105588 CrossRef PubMed.
- Y. C. Chai, W. X. Shang, W. J. Li, G. J. Wu, W. L. Dai, N. J. Guan and L. D. Li, Adv. Sci., 2019, 6, 1900299 CrossRef PubMed.
- N. Wang, Q. M. Sun, T. J. Zhang, A. Mayoral, L. Li, X. Zhou, J. Xu, P. Zhang and J. H. Yu, J. Am. Chem. Soc., 2021, 143, 6905–6914 CrossRef CAS PubMed.
- M. Navlani-Garcia, K. Mori, Y. Kuwahara and H. Yamashita, NPG Asia Mater., 2018, 10, 277–292 CrossRef CAS.
- W. Y. Chen, W. Z. Fu, B. X. Chen, C. Peng, G. Qian, D. Chen, X. Z. Duan and X. G. Zhou, J. Catal., 2020, 385, 289–299 CrossRef CAS.
- Y. Y. Liu, H. Wen, D. J. Zhou, X. Y. Huang, X. L. Wu, J. C. Jiang, X. J. Guo and B. J. Li, Appl. Catal., B, 2021, 291, 120094 CrossRef CAS.
- S. S. Duan, G. S. Han, Y. H. Su, X. Y. Zhang, Y. Y. Liu, X. L. Wu and B. J. Li, Langmuir, 2016, 32, 6272–6281 CrossRef CAS PubMed.
- X. Cui, Y. Liu, G. Han, M. Cao, L. Han, B. Zhou, S. Mehdi, X. Wu, B. Li and J. Jiang, Small, 2021, 17, 2101607 CrossRef CAS PubMed.
- G. Yang, S. Y. Guan, S. Mehdi, Y. P. Fan, B. Z. Liu and B. J. Li, Green Energy Environ., 2021, 6, 236–243 CrossRef CAS.
- X. L. Cui, H. Li, G. Q. Yu, M. Yuan, J. Yang, D. Xu, Y. M. Hou and Z. P. Dong, Int. J. Hydrogen Energy, 2017, 42, 27055–27065 CrossRef CAS.
- W. Y. Chen, Z. J. Wang, X. Z. Duan, G. Qian, D. Chen and X. G. Zhou, Chem. Eng. Sci., 2018, 192, 1242–1251 CrossRef CAS.
- W. Y. Chen, S. M. Chen, G. Qian, L. Song, D. Chen, X. G. Zhou and X. Z. Duan, J. Catal., 2020, 389, 492–501 CrossRef CAS.
- X. M. Ning, Y. H. Li, B. Q. Dong, H. J. Wang, H. Yu, F. Peng and Y. H. Yang, J. Catal., 2017, 348, 100–109 CrossRef CAS.
- G. Han, M. Hu, Y. Liu, J. Gao, L. Han, S. Lu, H. Cao, X. Wu and B. Li, J. Solid State Chem., 2019, 274, 207–214 CrossRef CAS.
- H. Lv, R. Wei, X. W. Guo, L. Z. Sun and B. Liu, J. Phys. Chem. Lett., 2021, 12, 696–703 CrossRef CAS PubMed.
- Q. L. Yao, K. Yang, X. L. Hong, X. S. Chen and Z. H. Lu, Catal. Sci. Technol., 2018, 8, 870–877 RSC.
- C. L. Wang, Q. Wang, F. Y. Fu and D. Astruc, Acc. Chem. Res., 2020, 53, 2483–2493 CrossRef CAS PubMed.
- N. X. Kang, R. Djeda, Q. Wang, F. Y. Fu, J. Ruiz, J. L. Pozzo and D. Astruc, Chemcatchem, 2019, 11, 2341–2349 CrossRef CAS.
- S. Y. Guan, L. L. An, S. Ashraf, L. N. Zhang, B. Z. Liu, Y. P. Fan and B. J. Li, Appl. Catal., B, 2020, 269, 118775 CrossRef CAS.
- L. B. Wang, H. L. Li, W. B. Zhang, X. Zhao, J. X. Qiu, A. Li, X. S. Zheng, Z. P. Hu, R. Si and J. Zeng, Angew. Chem., Int. Ed., 2017, 56, 4712–4718 CrossRef CAS PubMed.
- F. Y. Fu, C. L. Wang, Q. Wang, A. M. Martinez-Villacorta, A. Escobar, H. B. Chong, X. Wang, S. Moya, L. Salmon, E. Fouquet, J. Ruiz and D. Astruc, J. Am. Chem. Soc., 2018, 140, 10034–10042 CrossRef CAS PubMed.
Footnote |
| † Electronic supplementary information (ESI) available: Some SEM, XPS, and comparison of catalytic performance. See DOI: https://doi.org/10.1039/d3ra00358b |
| This journal is © The Royal Society of Chemistry 2023 |

