 Open Access Article
Optimization of a polyvinyl butyral synthesis process based on response surface methodology and artificial neural network†
Wenwen Luan,
Li Sun,
Zuoxiang Zeng * and
Weilan Xue
School of Chemical Engineering, East China University of Science and Technology, 200237 Shanghai, China. E-mail: zengzx@ecust.edu.cn
First published on 8th March 2023
Abstract
High quality polyvinyl butyral (PVB) can be used as the intermediate film of automobile and building glass and the packaging film of photovoltaic cells. Therefore, it is necessary to optimize its synthesis process to obtain suitable products with a high acetalization degree (AD) and small particle size (dp). In this work, a deep eutectic solvent (DES) was selected as the catalyst, and response surface methodology (RSM) and artificial neural network (ANN) were utilized to optimize the synthesis process of PVB. The concentration of polyvinyl alcohol (A), the dosage of DES (B) and n-butanal (C), and the aging temperature (D) were selected as process variables, and the comprehensive score (AD, dp and material and energy consumption) was introduced as the response. The results showed that single-factors B, C, D, and the interactions AB, BC and CD had significant effects on the comprehensive score, and the qualified PVB products (AD > 81%, dp = 3–3.5 μm) were obtained under the optimal conditions obtained by RSM and ANN models. ANN is a better and more precise optimization tool than RSM. Also, DES played a dual role in catalysis and dispersion in the synthesis of PVB and showed good reusability, so it has great application potential in PVB industrial production.
1. Introduction
Polyvinyl butyral (PVB) is an important synthetic resin, which has the advantages of strong adhesion, great flexibility, high UV stability and optical transparency, and excellent impact and weather resistance.1–3 PVB is usually used as interlayer material for laminated glass in automobiles and buildings, due to its strong adhesion to glass, excellent mechanical strength, and optical clarity.4–6 Recently, PVB has gained wide attention because of its great potential for applications in encapsulation film for solar cells,7,8 protective coating for metal substrates,9–11 and ultrafiltration membrane for wastewater treatment.12–14The acetalization degree (AD) of PVB is one of the most important parameters determining its application performance such as mechanical and thermal properties, bond strength and water resistance. To meet the mechanical and hydrophobic property requirements for application, the AD value needs to reach more than 78%.3 In addition, the particle size (dp) is also an important parameter for PVB application, and it is closely related to the purity, acetalization degree, and intermolecular crosslinking of PVB products, all of which are strictly required in ultrafiltration membranes, biomedical applications and photovoltaic cells.15 The performance of PVB depends mainly on its synthesis process, which involves the acetal reaction of polyvinyl alcohol (PVA) and n-butanal (BA) in the presence of an acidic catalyst. Therefore, to meet the extreme demand of some applications, the synthesis process of PVB becomes important to produce high quality PVB products with high AD value, and small and uniform particle sizes.
PVB resin is mainly produced by the precipitation method in the industry, which involves two temperature-controlled stages: the condensation stage (reaction at a low temperature) and the aging stage (reaction at a high temperature).3,16 Precipitation method is relatively mature, but there are still disadvantages such as low degree of acetalization, easy agglomeration and high energy consumption. In recent years, researchers have been working to improve the PVB synthesis process by changing the solvent system, improving the reaction device and using new catalysts. Fernández et al.17 used N-methylpyrrolidone (NMP) instead of water as a reaction medium to prepare PVB, and products with different degrees of acetalization were prepared in a homogeneous system. But this method requires special solvents, and the separation and purification of the product from the solvent are difficult. Lin et al.16 and Zhou et al.3 used membrane dispersion microreactors to synthesize PVB, which had a strong mixing capacity, shortened reaction time and reduced energy consumption. However, the production cost of the microreactor is high, and PVB particles are easy to block the channels, so it is difficult to industrially produce PVB with the microreactor. Typically, a strong inorganic acid (usually HCl or H2SO4) is used as the catalyst for PVB synthesis, which has the disadvantages of corrosion of equipment, agglomeration of PVB particles and uneven distribution of acetalization degree. Researchers today are trying to develop new catalysts to replace inorganic acids. In recent years, ionic liquids (ILs) have become increasingly attractive as novel and efficient catalysts because of their low vapor pressure, non-flammability, and excellent chemical and thermal stability.18–20 Qin et al.21 successfully synthesized PVB using N-methylimidazole sulfate ([HMIM]+HSO4−) as an IL catalyst, and the AD value of the product was up to 72%. Nevertheless, ILs are expensive and difficult to biodegrade.22 Deep eutectic solvent (DES) has been developed as a novel alternative to ILs.23,24 It is synthesized by mixing a hydrogen bond acceptor (HBA) (quaternary ammonium salts) and a hydrogen bond donor (HBD) (carboxylic acids) at 60–80 °C,25–27 and is cheap, biodegradable, low toxic and reusable.28–30 Hence, DES as a catalyst has potential applications in polymer chemistry and synthetic organic chemistry.
Traditionally, surfactants are added to the reaction system to disperse reactants and product molecules during PVB synthesis, thus improving particle aggregation. However, too much surfactant residue in PVB will cause it to turn yellow during high temperature processing.31 Fortunately, DES also has good dispersal ability and is widely used as an efficient dispersant for the chemical synthesis of advanced nanomaterials.32–34 Therefore, DES is expected to achieve a double goal of catalysis and dispersion in the synthesis of PVB. Furthermore, DES has excellent reusability performance, which is an important factor for the possibility of its use in large-scale industrial applications.
Response surface methodology (RSM) is a powerful tool for optimizing process conditions.35–37 The Box–Behnken design (BBD), a type of RSM design, can provide 3–7 factors and three levels of experimental conditions. BBD has proven to be more efficient than the other response surface designs and has been widely used in the field of chemical engineering due to its benefits such as fewer experiments, shorter time and lower costs.38,39 Rathee et al.40 optimized the prepared phytosomes formulations using a 3-factor, 3-level BBD, and the results showed that the polyherbal phytosome preparation can be used as an alternative to dosage form design and delivery.
Artificial neural network (ANN) is a powerful data processing technology based on mimicking the biological nervous systems. Because of its advantages of mega-parallelism, high nonlinearity, self-learning, tolerance to scattered data and fast processing speed,41,42 ANN has been widely applied in many fields such as prediction,43 classification,44 signal processing,45,46 image processing47,48 and chemical process control.49–51 ANN trains experimental data by establishing relationships between input and output variables to predict and optimize complex processes.52,53 Haido54 established new empirical ANN models to evaluate the performance of RC connections based on a database of more than 200 experiments from the literature. The results showed that the obtained ANN models are stable and simple, and are suitable for the expected beam–column joint structure design.
RSM modeling consists of two steps, i.e., designing experiments and establishing a model based on the experimental results. ANN can derive models from available data without prior design or adjustment.55 Their features help to compare the models obtained by RSM and ANN and to combine the advantages of both methods to better solve complex problems.56,57 Toppo et al.57 used RSM and ANN models to optimize the synthesis process conditions of gold nanoparticles. The experiments were designed by RSM and the obtained model was further optimized by ANN. Ezemagu et al.56 optimized the process conditions for turbidity removal from produced water using RSM and ANN techniques.
In this study, DES formed by benzyltrimethylammonium chloride (BAC) and p-toluene sulphonic acid (PTSA) was selected as the catalyst for the synthesis of PVB, and the process conditions were optimized using both RSM and ANN. The four factors considered in this work are as follows: PVA concentration (wPVA), DES dosage (mDES/mPVA), n-butanal dosage (mBA/mPVA) and aging temperature (Tage). The comprehensive score considering acetalization degree, particle size and energy consumption was introduced as the response. Validation experiments were carried out to confirm the efficacy of RSM and ANN models, and their prediction accuracy was compared. Finally, recycling experiments were carried out to examine the reusability of DES.
2. Materials and methods
2.1 Materials
PVA (MW 24![[thin space (1/6-em)]](https://www.rsc.org/images/entities/char_2009.gif) 000–24
000–24![[thin space (1/6-em)]](https://www.rsc.org/images/entities/char_2009.gif) 500 g mol−1, hydrolysis degree of 99.0%) and ethanol (99.5%) were supplied by Shanghai Macklin Biochemical Co., Ltd. n-Butanal (99.5%) was got from Shanghai Mairuier Chemical Technology Co., Ltd. Benzyltrimethylammonium chloride (BAC, 98.0%) was got from Shanghai Di Bo Chemical Co., Ltd. p-Toluenesulfonic acid monohydrate (PTSA, 99.0%) was got from Shanghai Aladdin Biochemical Technology Co., Ltd. Sodium dodecyl sulfonate (SDS, 97.0%) and sodium hydroxide (NaOH, 98.0%) was supplied by Sinopharm Chemical Reagent Co., Ltd. Hydrochloric acid (HCl, 36–38%) and hydroxylamine hydrochloride (98.5%) were bought from Shanghai Titan Scientific Co., Ltd.
500 g mol−1, hydrolysis degree of 99.0%) and ethanol (99.5%) were supplied by Shanghai Macklin Biochemical Co., Ltd. n-Butanal (99.5%) was got from Shanghai Mairuier Chemical Technology Co., Ltd. Benzyltrimethylammonium chloride (BAC, 98.0%) was got from Shanghai Di Bo Chemical Co., Ltd. p-Toluenesulfonic acid monohydrate (PTSA, 99.0%) was got from Shanghai Aladdin Biochemical Technology Co., Ltd. Sodium dodecyl sulfonate (SDS, 97.0%) and sodium hydroxide (NaOH, 98.0%) was supplied by Sinopharm Chemical Reagent Co., Ltd. Hydrochloric acid (HCl, 36–38%) and hydroxylamine hydrochloride (98.5%) were bought from Shanghai Titan Scientific Co., Ltd.
2.2 Synthesis of PVB
The detailed reaction mechanism of PVB synthesis is shown in Fig. 1, and it is described as follows. First, n-butanal is protonated under acidic conditions, and the protonated n-butanal then reacts with the hydroxyl group on the PVA molecule to form a protonated hemiacetal group. Next, the protonated hemiacetal loses one H2O molecule and reacts with the neighboring hydroxyl group to form an acetal group. Finally, H+ leaves and the acetal reaction is complete.58 The synthetic procedure of PVB is similar to that of our previous publication,59 and it is described in detail in ESI.†2.3 Preparation and selection of DES
The preparation procedure of DES has been described in detail in our previous study,58 and it can be found in ESI.† Experiments of selecting catalyst were carried out, and results showed that DES (BAC–PTSA) prepared by BAC and PTSA with a molar ratio of 1 exhibited the best catalysis effect for PVB synthesis. The detailed results and the characterization of DES are shown in ESI.†2.4 Evaluation of the catalytic performance of DES
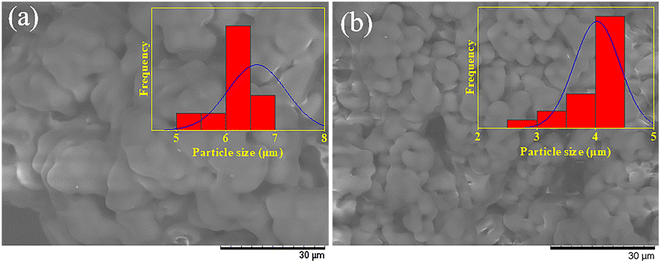
To evaluate the catalytic performance of DES, BAC–PTSA and HCl were used as the catalyst to synthesize PVB, and the dosage of the catalyst was determined by the pH of the system (adjusted to ∼1.5). For these two catalysts, the dosage of SDS (mSDS/mPVA) is 0.01 and 0.03, respectively, and the samples obtained are named PVB–DES and PVB–HCl, respectively. The AD values of the samples were determined to be almost identical (∼80%). The SEM images of the two samples are shown in Fig. 2. Interestingly, despite the much lower amount of surfactant, PVB products with the smaller particle size were obtained with the presence of DES. Specifically, the dp was measured to be ∼6.6 μm (PVB–HCl) and ∼4.2 μm (PVB–DES) respectively. The results indicated that DES played a dual role in catalysis and dispersion in the synthesis of PVB, and it was selected as the catalyst to synthesize PVB in this study.2.5 Determination of acetalization degree of PVB
The AD value of PVB is determined by the hydroxylamine hydrochloride method,59,60 which is defined as the mass ratio of acetal groups to the total mass of the molecular chain, and it can be calculated by eqn (1):
 | (1) |
2.6 Characterization of PVB
The samples of PVA and PVB were characterized by Fourier transition infrared spectroscopy (FTIR, Thermo Fisher Scientific Nicolet iS10, USA) on the specimens made through KBr. The glass transition temperature (Tg) was measured by a differential scanning calorimeter (DSC1, Mettler Toledo Switzerland) under a nitrogen atmosphere. Thermogravimetric analysis (TGA, NETZSCH STA 449F5 simultaneous thermal analyzer) was utilized to measure the thermal stability of PVB products, and the test was carried out at a heating rate of 10 °C min−1 from 25 °C to 700 °C under an air atmosphere. Gel permeation chromatography (GPC, Waters 1515, USA) was used to determine the molecular weight of PVB, and the values were calculated by the calibration curve of polystyrene standards. A scanning electron microscope (SEM, S-3400N, Hitachi) was utilized to image PVB particles and measure the particle size. UV spectrophotometer (UV-1800, Shimadzu) was used to determine the concentration of n-butanal.2.7 RSM modeling
(1) PVA concentration (wPVA): when the wPVA value is too high (>10%), the molecular chains of PVA cannot stretch freely, which is unfavorable to the reaction of hydroxyl groups with n-butanal. However, too small wPVA value (<4%) leads to too low equipment utilization. Therefore, the suitable range of wPVA is 4–10%.
(2) DES dosage (mDES/mPVA): if the catalyst dosage is lower than 0.1, the reaction rate would be very slow. When the value of mDES/mPVA is higher than 0.3, the concentration of protonated n-butanal will reach the threshold value, and the reaction rate no longer increases with increasing DES dosage. Therefore, the suitable range of mDES/mPVA is 0.1–0.3.
(3) n-Butanal dosage (mBA/mPVA): the AD value of PVB increases with the increase of mBA/mPVA until mBA/mPVA is 0.9, and then tends to be stable. On the other hand, when mBA/mPVA < 0.6, the reaction rate is too low. So, the suitable range of mBA/mPVA is 0.6–0.9.
(4) Aging temperature (Tage): if Tage is lower than 50 °C, the AD value will be lower than 76%; however, when Tage > 70 °C, the dp value of the product will increase significantly. So, the suitable range of Tage is 50–70 °C.
The above four factors were selected as input variables in RSM and each variable was set at three levels: low (−1), medium (0), and high (+1) as shown in Table 1.
| Factors | Unit | Coded and actual levels | |||
|---|---|---|---|---|---|
| −1 | 0 | +1 | |||
| A | wPVA | % | 4 | 7 | 10 |
| B | mDES/mPVA | g g−1 | 0.1 | 0.2 | 0.3 |
| C | mBA/mPVA | g g−1 | 0.60 | 0.75 | 0.90 |
| D | Tage | °C | 50 | 60 | 70 |
 | (2) |
| Y = β0 + β1A + β2B + β3C + β4D + β11A2 + β22B2 + β33C2 + β44D2 +β12AB + β13AC + β14AD + β23BC + β24BD + β34CD | (3) |
| Run | Factors and coded levels | Comprehensive score | |||
|---|---|---|---|---|---|
| A (%) | B (g g−1) | C (g g−1) | D (°C) | ||
| 1 | 0 | 0 | −1 | 1 | 76.87 |
| 2 | −1 | 0 | 0 | −1 | 89.61 |
| 3 | 0 | 0 | 0 | 0 | 90.80 |
| 4 | 0 | −1 | 1 | 0 | 81.05 |
| 5 | 0 | 0 | 1 | −1 | 86.10 |
| 6 | 0 | −1 | 0 | −1 | 87.32 |
| 7 | 1 | 0 | 1 | 0 | 84.69 |
| 8 | 0 | 0 | −1 | −1 | 87.70 |
| 9 | 1 | 0 | 0 | −1 | 87.61 |
| 10 | 0 | 1 | −1 | 0 | 81.70 |
| 11 | 0 | 1 | 0 | 1 | 83.59 |
| 12 | 0 | −1 | −1 | 0 | 82.17 |
| 13 | 0 | 1 | 1 | 0 | 87.52 |
| 14 | 0 | 0 | 0 | 0 | 91.01 |
| 15 | 1 | −1 | 0 | 0 | 84.16 |
| 16 | 0 | 0 | 0 | 0 | 91.49 |
| 17 | 1 | 1 | 0 | 0 | 85.85 |
| 18 | −1 | 0 | −1 | 0 | 79.87 |
| 19 | 0 | 0 | 0 | 0 | 91.09 |
| 20 | 0 | −1 | 0 | 1 | 79.89 |
| 21 | −1 | −1 | 0 | 0 | 81.32 |
| 22 | −1 | 0 | 0 | 1 | 81.85 |
| 23 | 0 | 0 | 1 | 1 | 83.95 |
| 24 | −1 | 1 | 0 | 0 | 88.55 |
| 25 | 0 | 0 | 0 | 0 | 91.59 |
| 26 | 1 | 0 | 0 | 1 | 80.93 |
| 27 | 0 | 1 | 0 | −1 | 90.26 |
| 28 | −1 | 0 | 1 | 0 | 85.65 |
| 29 | 1 | 0 | −1 | 0 | 81.70 |
2.8 ANN modeling
In ANN, a back propagation (BP) was used, which is a multi-layer feedforward neural network trained by the error back-propagation learning algorithm and has strong stability. The basic structure of the BP ANN model consists of input, hidden, and output layers, and the node of each layer in the ANN model was determined as follows.(1) Input layer: the input layer includes four variables that affect the quality of PVB product: PVA concentration, DES dosage, n-butanal dosage and aging temperature.
(2) Output layer: the output layer includes one node, which is the comprehensive score as an evaluation indicator.
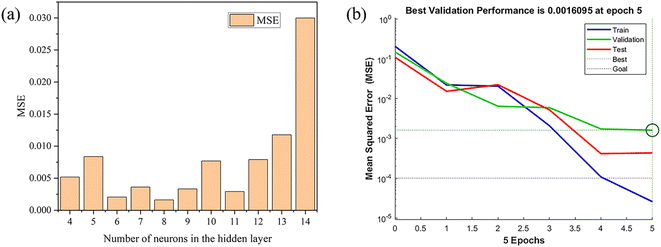
(3) Hidden layer: the number of hidden layer nodes can directly affect the performance of the ANN model. The determination of hidden layer nodes includes two steps. First, a reasonable range of the number of nodes in the hidden layer is inferred using an empirical formula. Then the number of nodes was increased from small to large, and the trial-and-error approach was used to finally determine the optimal number. One common empirical formula is shown in eqn (4):61
| r = 2n + 1 | (4) |
In this study, Levenberg–Marquardt was selected as the training algorithm because of its fast convergence speed. The mean squared error (MSE) and the correlation coefficient (R2) were used to estimate the performance of the network. The ANN model and related parameter variations are determined based on the minimum of the MSE. The data obtained from the RSM design will be used to constitute the architecture of ANN and randomly divided into three subsets: 70% for training, 15% for validation and 15% for testing. The maximum number of training epochs is set to 1000 and the final error is less than 0.0001.
2.9 Assessing fit and accuracy of RSM and ANN models
The prediction accuracy of ANN and RSM models can be evaluated by comparing the predicted responses with the experimental responses. Correlation coefficient (R2), root mean square error (RMSE) and absolute average deviation (AAD%) were often used to determine the accuracy of the models as follows:62–64
 | (5) |
 | (6) |
 | (7) |
3. Results and discussion
3.1 Characterization of PVB
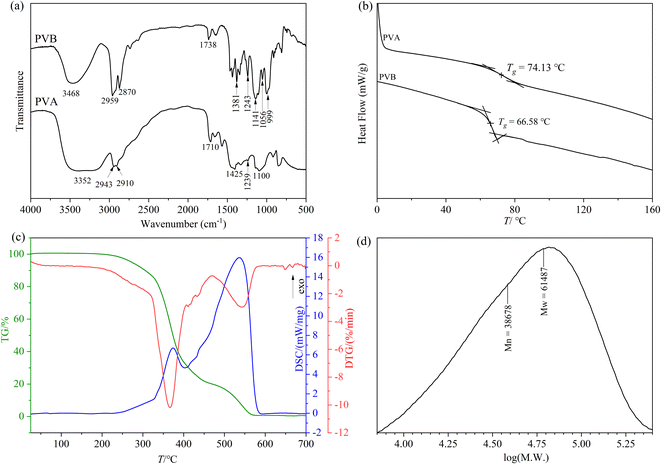
![[double bond, length as m-dash]](https://www.rsc.org/images/entities/char_e001.gif) O of vinyl acetate groups. The peak at 1381 cm−1 belongs to the bending vibration of C–H.21 The two peaks around 1243 cm−1 and 1056 cm−1 are assigned to the asymmetric and symmetric stretching vibration of the C–O–C of the acetate groups, respectively. The two peaks at 1141 cm−1 and 999 cm−1 belong to the asymmetric and symmetric stretching vibration of C–O–C–O–C,65 respectively, which are not found in the spectrum of PVA, confirming that the acetal reaction of PVA and n-butanal did occur.
O of vinyl acetate groups. The peak at 1381 cm−1 belongs to the bending vibration of C–H.21 The two peaks around 1243 cm−1 and 1056 cm−1 are assigned to the asymmetric and symmetric stretching vibration of the C–O–C of the acetate groups, respectively. The two peaks at 1141 cm−1 and 999 cm−1 belong to the asymmetric and symmetric stretching vibration of C–O–C–O–C,65 respectively, which are not found in the spectrum of PVA, confirming that the acetal reaction of PVA and n-butanal did occur.
![[thin space (1/6-em)]](https://www.rsc.org/images/entities/char_2009.gif) 678 and 61
678 and 61![[thin space (1/6-em)]](https://www.rsc.org/images/entities/char_2009.gif) 487 g mol−1, and the ratio of them (Mn/Mw) was 1.58972.
487 g mol−1, and the ratio of them (Mn/Mw) was 1.58972.3.2 Modeling and parameters optimization by RSM
| Y = 91.20 − 0.16A + 1.80B + 1.58C − 3.46D − 1.39AB − 0.70AC + 0.27AD + 1.73BC + 0.19BD + 2.17CD − 3.29A2 − 3.09B2 − 4.89C2 − 2.80D2 | (8) |
The results of ANOVA are shown in Table 3, which is used to evaluate the applicability of the model and judge the significance of each factor. As shown in Table 3, the model F-value of 73.09 and the p-value of < 0.0001 indicate that the model is significant. The lack of fit F-value of 5.50 and p-value of > 0.05 imply that lack of fit is quite low and not significant relative to the pure error. The high values of R2 (0.9865) and adjusted R2 (0.9730) indicate that the model fits well with the experimental data and has considerable compatibility.
| Source | Sum of squares | df | Mean square | F-value | p-value | |
|---|---|---|---|---|---|---|
| Model | 479.42 | 14 | 34.24 | 73.09 | <0.0001 | Significant |
| A | 0.30 | 1 | 0.30 | 0.64 | 0.4365 | |
| B | 38.73 | 1 | 38.73 | 82.66 | <0.0001 | |
| C | 29.93 | 1 | 29.93 | 63.88 | <0.0001 | |
| D | 143.69 | 1 | 143.69 | 306.69 | <0.0001 | |
| AB | 7.69 | 1 | 7.69 | 16.42 | 0.0012 | |
| AC | 1.94 | 1 | 1.94 | 4.14 | 0.0612 | |
| AD | 0.29 | 1 | 0.29 | 0.63 | 0.4411 | |
| BC | 12.03 | 1 | 12.03 | 25.69 | 0.0002 | |
| BD | 0.14 | 1 | 0.14 | 0.31 | 0.5883 | |
| CD | 18.87 | 1 | 18.87 | 40.27 | <0.0001 | |
| A2 | 70.06 | 1 | 70.06 | 149.54 | <0.0001 | |
| B2 | 61.93 | 1 | 61.93 | 132.19 | <0.0001 | |
| C2 | 155.09 | 1 | 155.09 | 331.03 | <0.0001 | |
| D2 | 50.99 | 1 | 50.99 | 108.83 | <0.0001 | |
| Residual | 6.56 | 14 | 0.47 | |||
| Lack of fit | 6.11 | 10 | 0.61 | 5.50 | 0.0574 | Not significant |
| Pure error | 0.44 | 4 | 0.11 | |||
| Cor total | 485.98 | 28 | ||||
| R2 = 0.9865, Adj. R2 = 0.9730, Adeq. precision = 30.28, C.V.% = 0.80% | ||||||
Moreover, the p-value is an important criterion for determining the significance of each independent variable. Specifically, p-value > 0.05 is not significant; p-value < 0.05 is significant, and p-value < 0.01 is extremely significant. From Table 3, the p-values of independent variables B, C, and D, and interactions AB, BC and CD are all less than 0.05, indicating that they have significant effects on the quality of PVB resin, and other factors are not significant.
Adequate precision (AP) measures the signal-to-noise ratio, and a greater ratio value is desirable. The value of AP of this model is 30.28, which indicates that the model has a good predictive ability. The coefficient of variation (CV) is also known as the relative standard deviation and reflects the degree of dispersion of the data. The lower the CV value, the higher the reliability of the data. The low value of CV% (0.80%) shows that the experimental data is reliable.
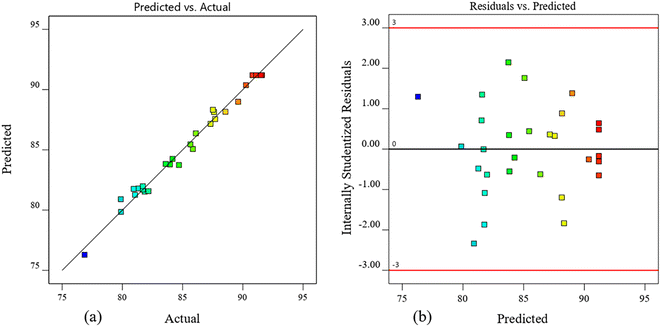
Fig. 4 shows the comparison between the predicted Y values and the actual ones. From Fig. 4a, the points are arranged along a straight diagonal line; from Fig. 4b, the residuals are normally distributed and within the range of −3 to +3, indicating that the regression model is credible. In conclusion, the established quadratic polynomial model is reliable and can be used to optimize the PVB synthesis process.
These 3D response surfaces and 2D contour plots show the interaction effects between PVA concentration and DES dosage (Fig. 5a and b), DES dosage and n-butanal dosage (Fig. 5c and d), n-butanal dosage and aging temperature (Fig. 5e and f) on the comprehensive score, respectively. From Fig. 5a and b, it can be found that as wPVA and mDES/mPVA increased simultaneously, the comprehensive score first increased and then decreased. The comprehensive score was up to 90 when wPVA was in the range of 5.5% ∼8.5% and mDES/mPVA was in the range of 0.17–0.30. A similar trend was observed for the plots in Fig. 5c and d. As shown in Fig. 5c and d, the optimal regions for the two interacting variables were located in the middle area of the design, and the maximum value of the comprehensive score was achieved in the range of mDES/mPVA from 0.17 to 0.30, and mBA/mPVA from 0.72 to 0.85.
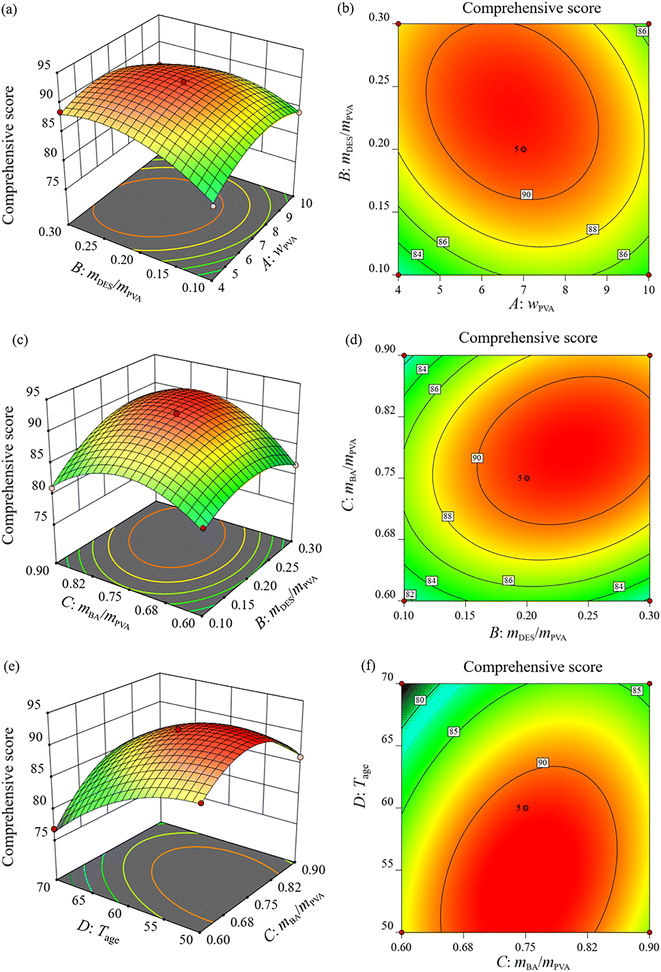 | ||
| Fig. 5 Response surface plots and contour plots of interaction effects of AB (a and b), BC (c and d), and CD (e and f) on the comprehensive score. | ||
As shown in Fig. 5e and f, the 3D response surface plot is steepest and the associated contour plot shows a considerable curvature, indicating that the interaction between n-butanal dosage and aging temperature on the comprehensive score is the most significant, which is consistent with the p-value of CD (<0.0001). The comprehensive score first increased and then decreased with increasing n-butanal dosage, while it decreased as the aging temperature increased. The comprehensive score reached the highest value in the range of mBA/mPVA from 0.65 to 0.85, and Tage from 50 °C to 62 °C.
3.3 Modeling and parameters optimization by ANN
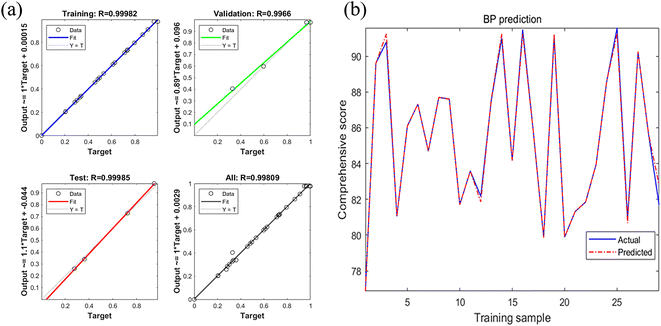
As the regression analysis of output and target are shown in Fig. 7a, the regression coefficients of training (0.99982), validation (0.9966), test (0.99985) and the network (training, testing and validation, 0.99809) are all greater than 0.99, which demonstrates a good fit. Fig. 7b shows the plot of the predicted comprehensive score versus the actual values of the training sample, and the predicted values are close to the actual values. The results of Fig. 7a and b indicate that the predictive capability of the ANN model is good, and the prediction result is reliable.
3.4 Comparison of RSM and ANN models
To verify the predictive performance of the models, validation experiments were performed under the optimal process conditions obtained by RSM and ANN models, which have been described in detail in the previous section. The values of AD, dp and the comprehensive score of PVB products are summarized in Table 4, and the SEM images of PVB obtained by RSM and ANN are shown in Fig. 8a and b, respectively. As shown in Table 4, the PVB product obtained by RSM has slightly higher AD and dp values than that of PVB obtained by ANN. The differences mainly because DES dosage, n-butanal dosage, and Tage in the optimal process conditions of RSM all exceeded those of ANN, which accelerated the acetal reaction rate and increased AD. However, the excessively fast reaction rate and higher temperatures resulted in the product molecules not being dispersed in time and sticking together, so the PVB particles were larger. Compared with the RSM model, the value of the comprehensive score obtained by the ANN model is higher and much closer to its predicted value, indicating that the optimal process condition obtained from ANN has better reliability and accuracy.| Model | R2 | RMSE | AAD (%) | AD (%) | dp (μm) | Comprehensive score | |
|---|---|---|---|---|---|---|---|
| Actual | Predicted | ||||||
| RSM | 0.9865 | 0.4754 | 0.45 | 83.54 | 3.5 | 91.78 | 92.08 |
| ANN | 0.9962 | 0.2551 | 0.13 | 81.35 | 3.0 | 92.60 | 92.71 |
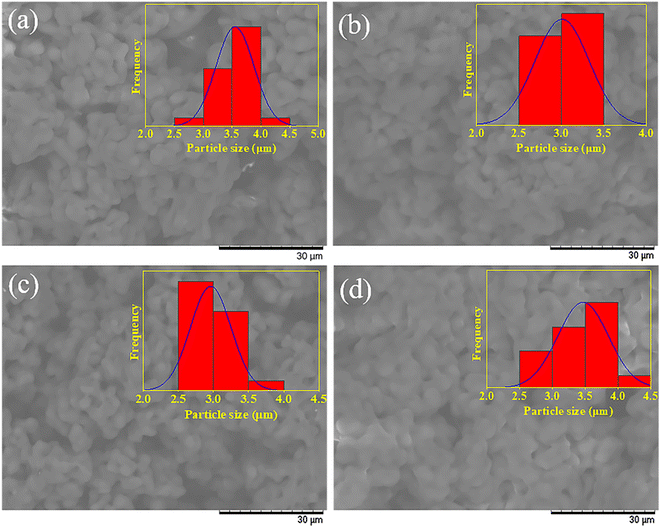 | ||
| Fig. 8 SEM images of PVB samples obtained by RSM (a), ANN (b); recycling experiments: R1 (c) and R2 (d). | ||
The performance of the RSM and ANN models was further compared based on three statistical indicators (R2, RMSE, and AAD%). As shown in Table 4, both models have R2 values close to 1 and very low RSME and AAD% values. However, ANN has a higher R2 value and lower RMSE and AAD% values. Therefore, it can be concluded that both RSM and ANN are efficient tools for optimizing the synthesis process of PVB, and the optimization performance and prediction accuracy of ANN model is better than RSM model.
3.5 Recycling experiments
The reusability of the catalyst is an important factor for its large-scale industrial application. Based on the above results, the recycling experiments were conducted based on the optimal process conditions obtained from the ANN model. After the aging reaction, PVB particles were separated by centrifugation and the mother liquor was collected. The content of DES and n-butanal remaining in the solution was measured through acid–base titration and UV spectrophotometer, respectively. The mother liquor was used as the raw material for the recycling experiment, and the required amounts of DES, water, n-butanal and SDS were carefully calculated and supplemented, and the experimental operations were performed as previously described. The detailed experimental parameters and results are shown in Table 5, and the SEM images are shown in Fig. 8c and d. As shown in Table 5 and Fig. 8c, the AD and dp values of PVB product in the recycling experiment (R1) were similar to those in the basic experiment (Fig. 8b), and the comprehensive score reached 92.49, indicating good reusability of DES (BAC–PTSA) for the synthesis reaction of PVB. A contrast recycling experiment (R2) was carried out in which only water and n-butanal were supplemented to the mother liquor, while DES and SDS were not supplemented. As shown in Table 5 and Fig. 8d, PVB products obtained by R2 had lower AD and larger dp than those of the basic experiment and R1. This may be because the loss of DES slowed down the reaction rate, so the AD of PVB obtained in the same reaction time was lower. In addition, the loss of both DES and SDS led to a poor dispersion effect, so the particle size of PVB was large. Qualified PVB products could be obtained by supplementing a small amount of lost raw material, demonstrating the feasibility of the recycling technology in PVB practical production.| Water (mwater/mPVA) | DES (mDES/mPVA) | n-Butanal (mBA/mPVA) | SDS (mSDS/mPVA) | AD (%) | dp (μm) | Comprehensive score | |
|---|---|---|---|---|---|---|---|
| Basic | 12.4 | 0.230 | 0.73 | 0.01 | 81.35 | 3.0 | 92.60 |
| R1 | 1.4 | 0.026 | 0.61 | 0.003 | 81.20 | 3.0 | 92.49 |
| R2 | 1.4 | 0 | 0.61 | 0 | 80.41 | 3.5 | 89.35 |
4. Conclusions
In this work, DES (BAC–PTSA) was prepared and selected as the catalyst for the synthesis of PVB. RSM and ANN were applied to investigate the effects of PVA concentration, DES dosage, n-butanal dosage and aging temperature on the quality of PVB resin, and to predict the optimal synthesis process conditions of PVB. The obtained results showed that both RSM and ANN were efficient tools for optimizing the synthesis process of PVB, and ANN is a better and more precise optimization tool than RSM. The optimal process conditions predicted by ANN were wPVA = 8.1%, mDES/mPVA = 0.23, mBA/mPVA = 0.73 and Tage = 55.6 °C with the predicted comprehensive score of 92.71, which was validated as 92.60. Moreover, PVB products obtained in the recycling experiment had similar AD values and particle morphologies to those of the basic experiment. It can be concluded that the DES used in this work exhibited good catalytic and dispersion properties, as well as excellent reusability, in which not only the amount of SDS but also the discharge of wastewater was reduced, so it has great application potential in PVB industrial production.Author contributions
Wenwen Luan: conceptualization, validation, data curation, writing – original draft, writing – review & editing; Li Sun: resources, software; Zuoxiang Zeng: formal analysis, validation, writing – review & editing; Weilan Xue: conceptualization, supervision.Conflicts of interest
There are no conflicts to declare.References
- L. Calucci, S. Pizzanelli, A. Mandoli, A. Birczynski, Z. T. Lalowicz, C. De Monte, L. Ricci and S. Bronco, Polymers, 2021, 13, 2686 CrossRef CAS PubMed.
- J. C. Hoepfner, M. R. Loos and S. H. Pezzin, J. Appl. Polym. Sci., 2019, 136, 48146 CrossRef.
- B. Y. Zhou, X. Y. Lin, K. Wang and G. S. Luo, Ind. Eng. Chem. Res., 2017, 56, 14463–14470 CrossRef CAS.
- B. Guner, Y. E. Bulbul and N. Dilsiz, J. Taiwan Inst. Chem. Eng., 2022, 132, 104136 CrossRef CAS.
- J. Xu, Y. Li, D. Ge, B. Liu and M. Zhu, Int. J. Impact Eng., 2011, 38, 106–114 CrossRef.
- X. Zhang, H. Hao, Y. Shi and J. Cui, Constr. Build. Mater., 2015, 93, 404–415 CrossRef.
- X. Huang, Y. Lin and G. Fang, Solar Energy, 2018, 161, 187–193 CrossRef CAS.
- N. G. Dhere, K. Agroui, B. Koll, G. Collins, M. Salama, A. Hadj Arab, A. Belghachi, N. Doulache and M. W. Khemici, Presented in Part at the Reliability of Photovoltaic Cells, Modules, Components, and Systems, 2008 Search PubMed.
- H. Yao, X. Zhang, L. Shen and N. Bao, Prog. Org. Coat., 2021, 158, 106382 CrossRef CAS.
- Z. Ma, M. Sun, A. Li, G. Zhu and Y. Zhang, Prog. Org. Coat., 2020, 144, 105662 CrossRef CAS.
- L. Xiong, J. Liu, M. Yu and S. Li, Corros. Sci., 2019, 146, 70–79 CrossRef CAS.
- W.-Z. Lang, J.-P. Shen, Y.-X. Zhang, Y.-H. Yu, Y.-J. Guo and C.-X. Liu, J. Membr. Sci., 2013, 430, 1–10 CrossRef CAS.
- X. Ma, Q. Sun, Y. Su, Y. Wang and Z. Jiang, Sep. Purif. Technol., 2007, 54, 220–226 CrossRef CAS.
- H. Azad, M. Mohsennia, C. Cheng and A. Amini, Chem. Eng. J., 2022, 435, 134849 CrossRef CAS.
- B. Yang, R. Liu, J. Huang and H. Sun, Ind. Eng. Chem. Res., 2013, 52, 7425–7431 CrossRef CAS.
- X. Lin, S. Yan, B. Zhou, K. Wang, J. Zhang and G. Luo, Green Chem., 2017, 19, 2155–2163 RSC.
- M. D. Fernández, M. J. Fernández and P. Hoces, J. Appl. Polym. Sci., 2006, 102, 5007–5017 CrossRef.
- M. Nasrollahzadeh, Z. Nezafat, F. Momenbeik and Y. Orooji, J. Mol. Liq., 2022, 345, 117811 CrossRef CAS.
- Y. Pei, Y. Zhang, J. Ma, M. Fan, S. Zhang and J. Wang, Mater. Today Nano, 2022, 17, 100159 CrossRef CAS.
- C. G. Yoo, Y. Pu and A. J. Ragauskas, Curr. Opin. Green Sustainable Chem., 2017, 5, 5–11 CrossRef.
- X.-X. Qin and Z.-L. Cheng, Chin. Chem. Lett., 2016, 27, 145–148 CrossRef CAS.
- A. Romero, A. Santos, J. Tojo and A. Rodriguez, J. Hazard. Mater., 2008, 151, 268–273 CrossRef CAS.
- K. Li, X. Chen, W. Xue, Z. Zeng and S. Jiang, Int. J. Chem. Kinet., 2019, 51, 329–336 CrossRef CAS.
- A. Hayyan, M. A. Hashim, M. Hayyan, F. S. Mjalli and I. M. AlNashef, J. Cleaner Prod., 2014, 65, 246–251 CrossRef CAS.
- S. Jiang, Z. Zeng, W. Xue, W. Zhang and Z. Zhou, Korean J. Chem. Eng., 2020, 37, 1482–1489 CrossRef CAS.
- K. Li, W. Xue, Z. Zeng and X. Shi, Can. J. Chem. Eng., 2018, 97, 1144–1151 CrossRef.
- M. H. Shafie, R. Yusof and C.-Y. Gan, J. Mol. Liq., 2019, 288, 111081–111086 CrossRef CAS.
- Y. Guo, L. Tang, W. Xue and Z. Zeng, Int. J. Chem. Kinet., 2021, 53, 1241–1252 CrossRef CAS.
- M. K. Miraki, J. A. Mehraban, E. Yazdani and A. Heydari, J. Mol. Liq., 2017, 234, 129–132 CrossRef CAS.
- L. Tang, Y. Guo, J. Xu, Z. Zeng and W. Xue, Braz. J. Chem. Eng., 2022, 39, 715–726 CrossRef CAS.
- H. Wang, W. Luan, L. Sun, Z. Zeng, W. Xue and Y. Bai, Chem. Eng. Res. Des., 2022, 184, 291–302 CrossRef CAS.
- Q. Liu, W. Sun, T. Yuan, S. B. Liang, F. Peng and C. L. Yao, Carbohydr. Polym., 2021, 272, 118514 CrossRef CAS.
- A. Brandao, S. Rosoiu, R. Costa, A. F. Silva, L. Anicai, M. Enachescu and C. M. Pereira, Nanomaterials, 2021, 12, 99–121 CrossRef PubMed.
- A. Abo-Hamad, M. Hayyan, M. A. AlSaadi and M. A. Hashim, Chem. Eng. J., 2015, 273, 551–567 CrossRef CAS.
- N. Asanjarani, M. Bagtash and J. Zolgharnein, J. Chemom., 2020, 34, e3283 CrossRef CAS.
- S. M. Huang, C. H. Kuo, C. A. Chen, Y. C. Liu and C. J. Shieh, Ultrason. Sonochem., 2017, 36, 112–122 CrossRef CAS.
- F. Wang, L. Chen, S. Jiang, J. He, X. Zhang, J. Peng, Q. Xu and R. Li, J. Liposome Res., 2014, 24, 171–181 CrossRef CAS PubMed.
- L. Zhao, Q. Li, X. Xu, W. Kong, X. Li, Y. Su, Q. Yue and B. Gao, Chem. Eng. J., 2016, 287, 537–544 CrossRef CAS.
- S. N. Ayyubi, A. Purbasari and Kusmiyati, Mater. Today: Proc., 2022, 63, S78–S83 CAS.
- S. Rathee and A. Kamboj, J. Liposome Res., 2018, 28, 161–172 CrossRef CAS PubMed.
- Y. Zhang, L. Zhou, Z. Hu, Z. Yu, S. Hao, Z. Lei and Y. Xie, Energies, 2018, 11, 1896 CrossRef.
- M. Yue and S. Li, AJRCOS, 2022, 13, 1–12 Search PubMed.
- J. Gao, P. Chongfuangprinya, Y. Z. Ye and B. Yang, IEEE, Electr. Network, 2020 Search PubMed.
- Y. Lecun, L. Bottou, Y. Bengio and P. Haffner, Proc. IEEE, 1998, 86, 2278–2324 CrossRef.
- J. Gao, D. Chakraborty, H. Tembine and O. Olaleye, A. Int Speech Commun, Graz, Austria, 2019 Search PubMed.
- M. A. Khan, H. Tembine and A. V. Vasilakos, IEEE Wireless Commun., 2012, 19, 50–56 Search PubMed.
- F. Shi, J. Gao and X. Huang, Int. J. Distrib. Sens. Netw., 2016, 12, 1–12 CrossRef.
- J. Gao and H. Tembine, IEEE Trans. Intell. Transport. Syst., 2019, 20, 507–521 Search PubMed.
- W. Haonan and C. Yijia, AJRCOS, 2022, 14, 22–37 Search PubMed.
- Y. Si and B. He, AJRCOS, 2022, 14, 1–7 Search PubMed.
- F. Xindi and S. Li, JERR, 2022, 23, 26–36 Search PubMed.
- G. Petroli, I. Dalmolin and C. Z. Brusamarello, Chem. Thermodyn. Therm. Anal., 2022, 6, 100048 CrossRef.
- C. Wang and C. Li, AJRCOS, 2021, 11, 8–16 CAS.
- J. H. Haido, Structures, 2022, 38, 1191–1209 CrossRef.
- M. R. Sabour and A. Amiri, Waste Manag., 2017, 65, 54–62 CrossRef CAS PubMed.
- I. G. Ezemagu, M. I. Ejimofor, M. C. Menkiti and C. C. Nwobi-Okoye, S. Afr. J. Chem. Eng., 2021, 35, 78–88 Search PubMed.
- A. L. Toppo, S. Dhagat and S. E. Jujjavarapu, Prep. Biochem. Biotechnol., 2022, 53, 195–206 CrossRef PubMed.
- W. Luan, J. Xu, Z. Zeng, W. Xue and Y. Bai, Can. J. Chem. Eng., 2023, 1, 1–14 Search PubMed.
- W. Luan, C. Wang, Z. Zeng, W. Xue, F. Liang and Y. Bai, J. Mol. Liq., 2021, 336, 116864 CrossRef CAS.
- W. Luan, C. Wang, Z. Zeng, W. Xue, X. He and Y. Bai, Korean J. Chem. Eng., 2021, 38, 1810–1817 CrossRef CAS.
- L. Tong, P. Bénard, Y. Zong, R. Chahine, K. Liu and J. Xiao, Energy and AI, 2021, 5, 10075 CrossRef.
- F. Geyikçi, E. Kılıç, S. Çoruh and S. Elevli, Chem. Eng. J., 2012, 183, 53–59 CrossRef.
- E. Betiku and S. O. Ajala, Ind. Crops Prod., 2014, 53, 314–322 CrossRef CAS.
- Q.-Q. Yang, R.-Y. Gan, D. Zhang, Y.-Y. Ge, L.-Z. Cheng and H. Corke, LWT--Food Sci. Technol., 2019, 114, 108321 CrossRef CAS.
- E. Corroyer, M.-C. Brochier-Salon, D. Chaussy, S. Wery and M. N. Belgacem, Int. J. Polym. Anal. Charact., 2013, 18, 346–357 CrossRef CAS.
- G. C. Kingston and H. K. Yuen, Thermochim. Acta, 1987, 116, 317–327 CrossRef CAS.
- X. Li, B. Shen, J. Chen, J. Yang and J. Yang, Henan Sci., 1994, 12, 111–115 Search PubMed.
- C. Wang, W. Luan, Z. Zeng, X. He, Z. Liu and J. H. Wang, Polym. Bull., 2022 DOI:10.1007/s00289-022-04366-0.
Footnote |
| † Electronic supplementary information (ESI) available. See DOI: https://doi.org/10.1039/d2ra08099k |
| This journal is © The Royal Society of Chemistry 2023 |


