
 Open Access Article
 This Open Access Article is licensed under a Creative Commons Attribution-Non Commercial 3.0 Unported Licence
New silicon substituted BiMeVOx: synthesis and study of structural properties in relation to ionic conductivity
A. Agnanou a,
W. Mhairaa,
R. Essalima,
M. Zamamaa,
F. Mauvy*b,
M. Algaa and
A. Ammara
a,
W. Mhairaa,
R. Essalima,
M. Zamamaa,
F. Mauvy*b,
M. Algaa and
A. Ammara
aLaboratoire des Sciences des Matériaux et Optimisation des procèdes, Faculté des Sciences-Semlalia, Université Cadi Ayyad, Av. My Abdellah, B. P. 2390, Marrakech, Morocco
bCNRS, Univ. Bordeaux, Bordeaux INP, ICMCB, UMR 5026, 87, F-33600, Pessac, France. E-mail: fabrice.mauvy@icmcb.cnrs.fr
First published on 10th March 2023
Abstract
Partial substitution of vanadium with silicon in the compound Bi4V2O11, which belongs to the Aurivillius family, leads to the creation of a solid solution Bi4V2−xSixO11−δ (0 ≤ x ≤ 0.4). The compound with x = 0.1 turns out to be a monoclinic α-form of Bi4V2O11, while the compounds with x = 0.2 and x = 0.3 are orthorhombic β-polymorphs, and the compound with x = 0.35 is of tetrahedral γ-polymorph. Electrochemical Impedance Spectroscopy has been used to measure the ionic conductivity of doped samples. The ceramic sample with x = 0.1 has the highest ionic conductivity values.
1. Introduction
In these last years, considerable research has been focused on ionic conductors as a class of interesting materials. Particular attention has been paid to solid electrolytes due to their technological applications in practical energy devices, such as Solid Oxide Fuel Cells (SOFCs), Solid Oxide Electrolysis Cells (SOEC), oxygen membranes, catalysts, oxygen pumps, and oxygen sensors. Zirconia-based compounds (ZrO2), lanthanum gallate-based perovskites (LaGaO3), and Bi2O3-based compounds are the materials that have been the subject of many investigations. Compared to other solid electrolytes, oxide ion conducting materials based on the bismuth oxide phase are especially interesting due to their high ionic O2− conductivity level. Bi2O3-based materials also have a number of disadvantages, including thermodynamic instability in reducing atmospheres and the volatilization of bismuth oxide at moderate temperatures. At the end of the 1980s, a new family with excellent low-temperature ion conduction properties was highlighted named: BiMeVOx (where Bi is bismuth, Me is a metal ion, V is vanadium and Ox is oxygen). These materials derive from the parent compound Bi4V2O11 (also written Bi2VO5.5). This compound family was obtained by partial substitution of vanadium with a metal cation. The deduced materials of formula Bi4V2−xMexO11−δ were obtained, which leads to the stabilization of the most conductive form. The compound Bi4V2O11 was originally explored by Abraham et al.1 The structure of Bi4V2O11, which may be defined as an Aurivillius-type layered structure, consist of the alternating layers of (Bi2O2)2+ and (VO3.5□0.5)2−, (where □ represents the oxygen ion vacancy). The high conductivity of the compound is owing to the oxygen gap in the perovskite layers. However, this intrinsic oxygen-deficient structure is in harmonic relation with the proposed mechanism of ionic conduction.The Bi4V2O11 compound exists in three polymorphs α, β and γ. All these polymorphs can be described based on the orthorhombic cell of average dimensions am ≈ 5.53 Å, bm ≈ 5.61 Å, cm ≈ 15.28 Å.1,2 The high-ordered and low-conductive phase α-Bi4V2O11 (monoclinic a ≈ 3 am, b ≈ bm and c ≈ cm), is stable at room temperature up to 430 °C. The intermediate-level disordered phase with intermediate conductivity β-Bi4V2O11 (orthorhombic a ≈ 2 am, b ≈ bm, and c ≈ cm) is stable between 430 and 570 °C. Above 570 °C up to the melting point (around 870 °C), γ-Bi4V2O11 is obtained (tetragonal a = b ≈ am/√2 and c ≈ cm). This last polymorph is the most disordered and the best conductive. It is therefore essential to attempt to stabilize this phase at room temperature by partial substitution of vanadium by other ions.
The obtained BiMeVOx (Bi4MexV2−xO11−δ where x is the amount of doped metal ion, and δ is the stoichiometric loss of oxygen) is a large family of O2− solid electrolytes. These compounds exhibit excellent ionic conductivities, especially at low and intermediate temperatures, up to σ ≈ 10−3 S cm−1 at 300 °C and 10−1 S cm−1 at 600 °C.3–5 A wide variety of partial substitutions of V5+ were carried out to produce BiMeVOx (Me = Cu2+, Co2+, Zn2+, Fe3+, Al3+, Ti4+, Sn4+, P5+, Nb5+, etc.) and many synthesis methods have been explored to make BiMeVOx powders including co-precipitation,5 sol–gel,6 combustions,7 and mechano-chemical activation.8 To produce the selected powders, the solid-state reaction approach is the most extensively utilized. Several references are available in the literature concerning the effect of the substitution of vanadium (V5+) by monovalent, divalent, trivalent, tetravalent, and pentavalent cations. BiMeVOx: Me = Cu2+,9,10 Fe3+,9 Zn2+,10 Co2+,11 Ti4+,12 (Cu2+, Ti4+),13 (Cu2+, Al3+),14 (Al3+, Ti4+),15 P5+,16 and (Ti4+, Nb5+).17 The present work is devoted to the structural analysis of Bi4V2O11 as well as to the Si(IV) doped series Bi4V2−xSixO11−δ (0.1 ≤ x ≤ 0.4). This wide range of substituent elements with different sizes and different valences shows that the two-dimensional structure of BiMeVOx has a remarkable ability to accommodate large changes. Moreover, we note that most of these substitutions allow the generation of disorder in the lattice which is in favor of the properties of conduction by ion O2−.
It can notice that the vast majority of the BiMeVOx studied were obtained by substitution of vanadium by metal ions, particularly the transition elements. This does not exclude the tolerance of this structure to accommodate other types of elements such as the elements of the p block of the periodic table. In our research team, we realized the substitution of vanadium by phosphorus P5+.16 The present work is devoted to the structural analysis of Bi4V2O11 as well as to the Si(IV) doped series Bi4V2−xSixO11−δ (0.1 ≤ x ≤ 0.4). The choice of Si(IV) was motivated by the fact that Bi2VO5.5 and Bi2SiO5 are both considered as Aurivillius phases with structures constituted by the alternation of Bi2O2 layers and layers of lacunar octahedra for the first and layers of tetrahedrons for the second. Therefore, we considered the possibility of the existence of the solid solution in the system Bi2VO5.5 – Bi2SiO5.
The main objective of this study is to characterize the variation of the crystal structure as a function of the amount of dopant and to analyze the behavior of the studied system with respect to ionic conductivity.
2. Experimental procedure
2.1 Sample preparation
Bi4V2−xSixO11−x/2 powder samples were prepared using the solid-state reaction. Stoichiometric amounts of high-purity chemical powder oxide reagents: Bi2O3 (purity: 99.5%), V2O5 (purity: 99%), and SiO2 (purity: 99.9%) were mixed and homogenized, then ground in an agate mortar. The obtained mixtures were heated at 800 °C for 24 h with a heating rate of 5 °C min−1 in the furnace. The obtained products were then cooled slowly to room temperature.2.2 Characterization
Powder samples were characterized by X-ray diffraction (XRD) using a Rigaku, SmartLab SE diffractometer with a copper anti-cathode emitting a Cu Kα radiation (λ = 1.54059 Å). Measurements were performed over the 2θ range from 5° to 80° at a scan rate of 2° min−1, with a step width of 0.02°, in order to characterize the phase, composition, and crystal structure of the samples. The lattice parameters were determined by the Rietveld refinement technique considering DICVOL06 as starting models in the Rietveld “FullProf” program.The surface morphology of the sintered samples was carried out through a Scanning Electron Microscope (VEGA3), equipped with an energy-dispersive X-ray spectroscopy (EDS) analyzer. The measurement of the seed size was carried out using the image processing software ImageJ. The microstructure of the pellets of BiSiVOx has been studied using a scanning electron microscope with field emission (SEM), operated at 10 kV with an energy-dispersion X-ray spectroscopy detector (EDS). Measurement was performed on pellets samples sintered at 830 °C for 5 h.
The Raman scattering spectra were recorded using the Confotec MR520 spectrometer from samples confined in the form of powders. A laser with argon ionized emitting in the green at the wavelength λ = 532 nm has been used for such measurements.
Differential thermal and thermo-gravimetric analyses (DTA-TGA) were performed on samples at increasing temperatures from 25 °C to 700 °C, using a Labsys Evo-gas analyzer at a heating rate of 10 °C min−1.
Ionic conductivity measurements were performed by Electrochemical Impedance Spectroscopy (EIS) measurements in the frequency range from 0.01 to 1 MHz using a Solartron SI 1260 impedance gain phase analyser. The amplitude of the AC signal applied to the sample was 50 mV. For the manufacture of ceramics, the powders were crushed and then sieved (50 μm) in order to have a seed size ≤ 50 μm, pressed by uniaxial hand pressing in a pelletizer of 13 mm in diameter with a pressure of 1 ton per cm2. Measurements were performed on pellets sintered at 830 °C for 5 hours. In the present study, platinum electrodes sputtered by Physical Vapor Deposition (PVD) have been selected. PVD can be performed at room temperature and contrary to other metals, platinum deposition does not require post-thermal treatment (which could partly re-oxide the sample) and remains stable up to 800 °C. For each ceramic sample, impedance measurements were performed under dry air from 150 to 700 °C, on the isothermal plate for 30 min.
3. Results and discussion
3.1 X-ray diffraction characterizations
Fig. 1 shows the XRD diagrams at ambient temperature for Bi4V2−xSixO11−δ prepared samples with compositions (0 ≤ x ≤ 0.40). The characteristic Bragg peaks of the BiMeVOx phases are observed for all compositions. However, the XRD diagram corresponding to the solid solution with the composition x = 0.1, shows the presence of doublets at 2θ ≈ 32°, 34°, 48° and 55° with a superstructure peak at 2θ ≈ 24.3°, which is related to the monoclinic structure with the space group C2/m. At x = 0.2 and 0.3, the structure corresponds to the orthorhombic phase β with the Amam space group. When x increases, the coalescence of the doublet diffraction peaks (020) and (200) at 2θ ≈ 32° into a singlet (110) is observed, which reveals that the quadratic form γ of Bi4V2O11 is stabilized for the composition x = 0.35. The coalescence of doublets at 2θ ≈ 34°, and 55° into the singlet diffraction peaks (112), and (213) can also be mentioned. Fig. 2 shows a typical Rietveld refined XRD pattern (x = 0.35). The upper limit of the solid solution seems to be around x = 0.4 since a secondary phase indexed as Bi8V2O17 is observed. This last phase is generally observed as a secondary phase during the BiMeVOx synthesis.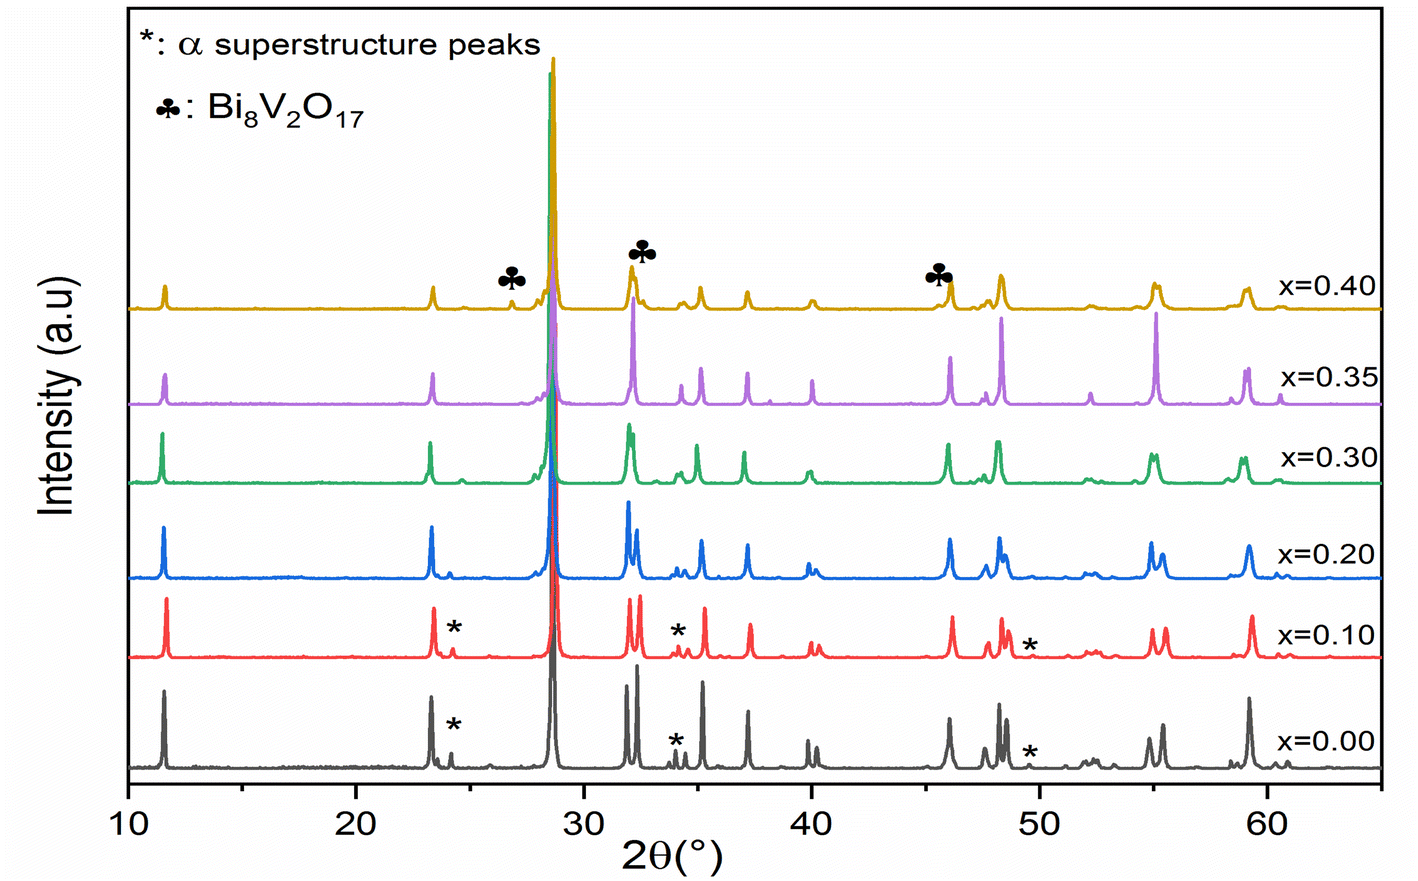 | ||
| Fig. 1 X-ray diffraction patterns of Bi4SixV2−xO11−δ (x = 0, 0.1, 0.2, 0.3, 0.35 and 0.4). | ||
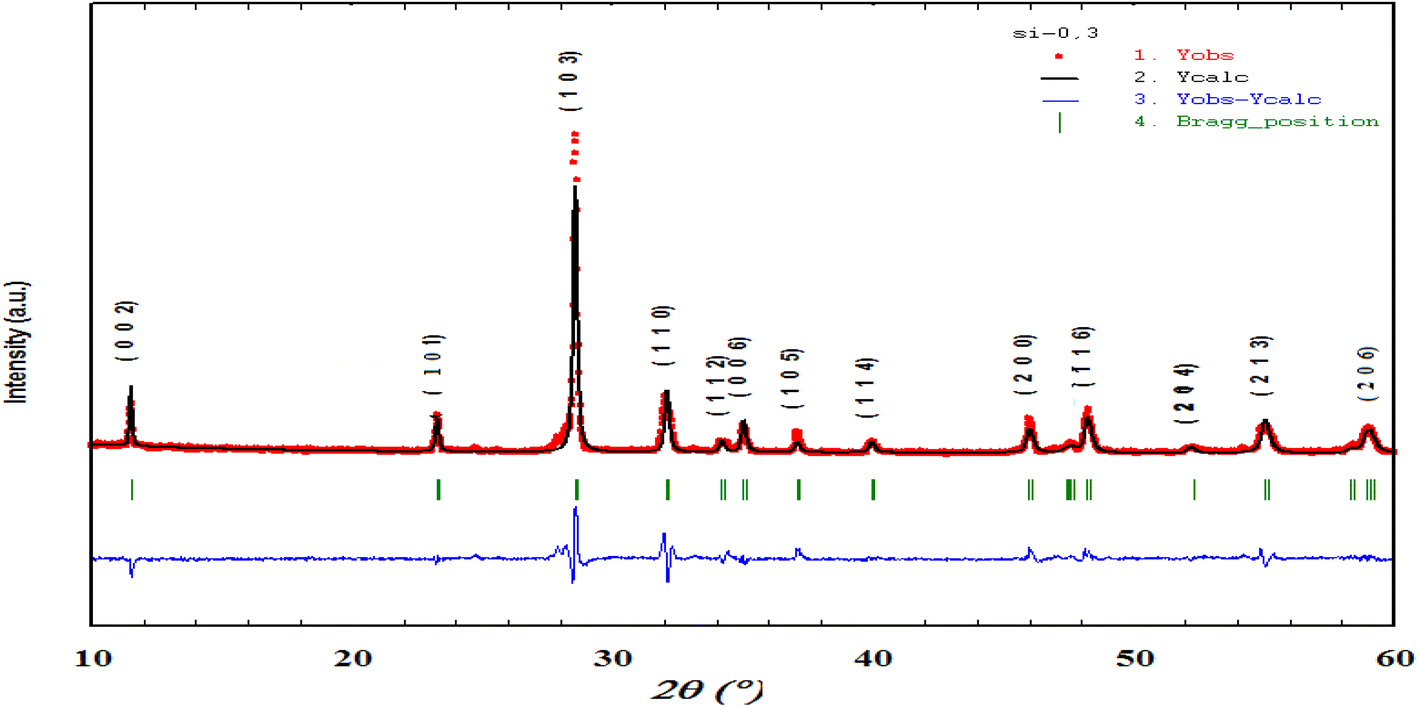 | ||
| Fig. 2 Rietveld refined XRD pattern of Bi4V1.65Si0.35O10.825. | ||
The values of the parameters (a, b, c) and the volume of the cell (V) as a function of the silicon doping for all the prepared samples which were obtained by the Rietveld analysis and are presented in Table 1. The cell parameters have been converted into the orthorhombic mean cell dimensions in order to facilitate the comparison.
| x | a (Ȧ) | b (Ȧ) | c (Ȧ) | V (Ȧ3) | Phase | Space group |
|---|---|---|---|---|---|---|
| x = 0; Bi4V2O11 | 5.5338(1) | 5.6100(9) | 15.2872(6) | 474.5909(3) | α | C2/m |
| x = 0.1; Bi4V1.9Si0.1O10.95 | 5.5326(5) | 5.6062(8) | 15.2888(9) | 474.2095(7) | α | C2/m |
| x = 0.2; Bi4V1.8Si0.2O10.90 | 5.5384(0) | 5.5989(3) | 15.3029(0) | 474.5293(6) | β | Amam |
| x = 0.3; Bi4V1.7Si0.3O10.85 | 5.5620(9) | 5.5913(6) | 15.3035(6) | 475.9353(2) | β | Amam |
| x = 0.35; Bi4V1.65Si0.35O10.825 | 5.5786(1) | — | 15.3522(5) | 477.7756(7) | γ | I4/mmm |
| x = 0.4; Bi4V1.6Si0.4O10.80 | 5.5764(8) | — | 15.3527(2) | 477.4255(1) | γ | I4/mmm |
The values presented in Table 1 show that the cell parameters a and c increase with increasing silicon ratio (0.20 ≤ x ≤ 0.35), whereas the b parameter decreases with the substitution amount. The decrease of the b parameter can be assigned to the increase of the anionic vacancies which are generally located in equatorial positions in BiMeVOx structures. The same result was observed by Essalim et al.14 However, the c parameter which is quite sensitive to the difference in the effective ionic radius of the doping cation should decrease because the ionic radius of the Si4+ ion is smaller than that of the V5+ ion (rion (Si4+) = 0.40 Å, rion (V5+) = 0.54 Å).18 Our results show the opposite phenomenon. This increase in the c parameter while the radius of the doping cation decreases can be explained by a stretching of the octahedra in the perovskite layers (effect of a ferroelectric displacement of the Si4+ ions) or by a decrease in the bond strength between the (Bi2O2)2+ and perovskite layers. In both cases, it is possible that the polarizing power of Si4+ which is greater than that of V5+ (rion (Si4+) < rion (V5+)) may enhance the magnitude of the M–O covalent bonding force in the perovskite layers. The same phenomenon was observed in other BiMeVOx compounds.19,20
Furthermore, the values presented in Table 1 show also that the volume V increases simultaneously with the increase in the silicon doping (0.20 ≤ x ≤ 0.35), whereas a very slight decrease in volume V for low dopant compositions (x = 0.0 to x = 0.1) and at the end doping (x = 0.4). These processes can be attributed respectively to the increase in oxygen vacancies generated in the basal plane and the presence of the secondary phase (Bi8V2O17) determined from the XRD result.
3.2 Microstructure characterization
The typical particle size distribution and the morphology of the particles at different compositions can be observed in Fig. 3. Well-defined grains separated by grain boundaries are observed in the starting sample (x = 0.0). The shape of the grains evolves according to the composition of the dopant. A decrease in the size of the grains and an increase in the width of the grain boundaries are observed as the dopant rate increases up to x = 0.2. For the specific compositions of x = 0.30 and x = 0.35, an increase in the densification is observed and can be explained on the one hand by the presence of disordered ion vacancies thus favoring the oxygen ion diffusion and on the other hand by decreasing the melting point as the degree of substitution increases.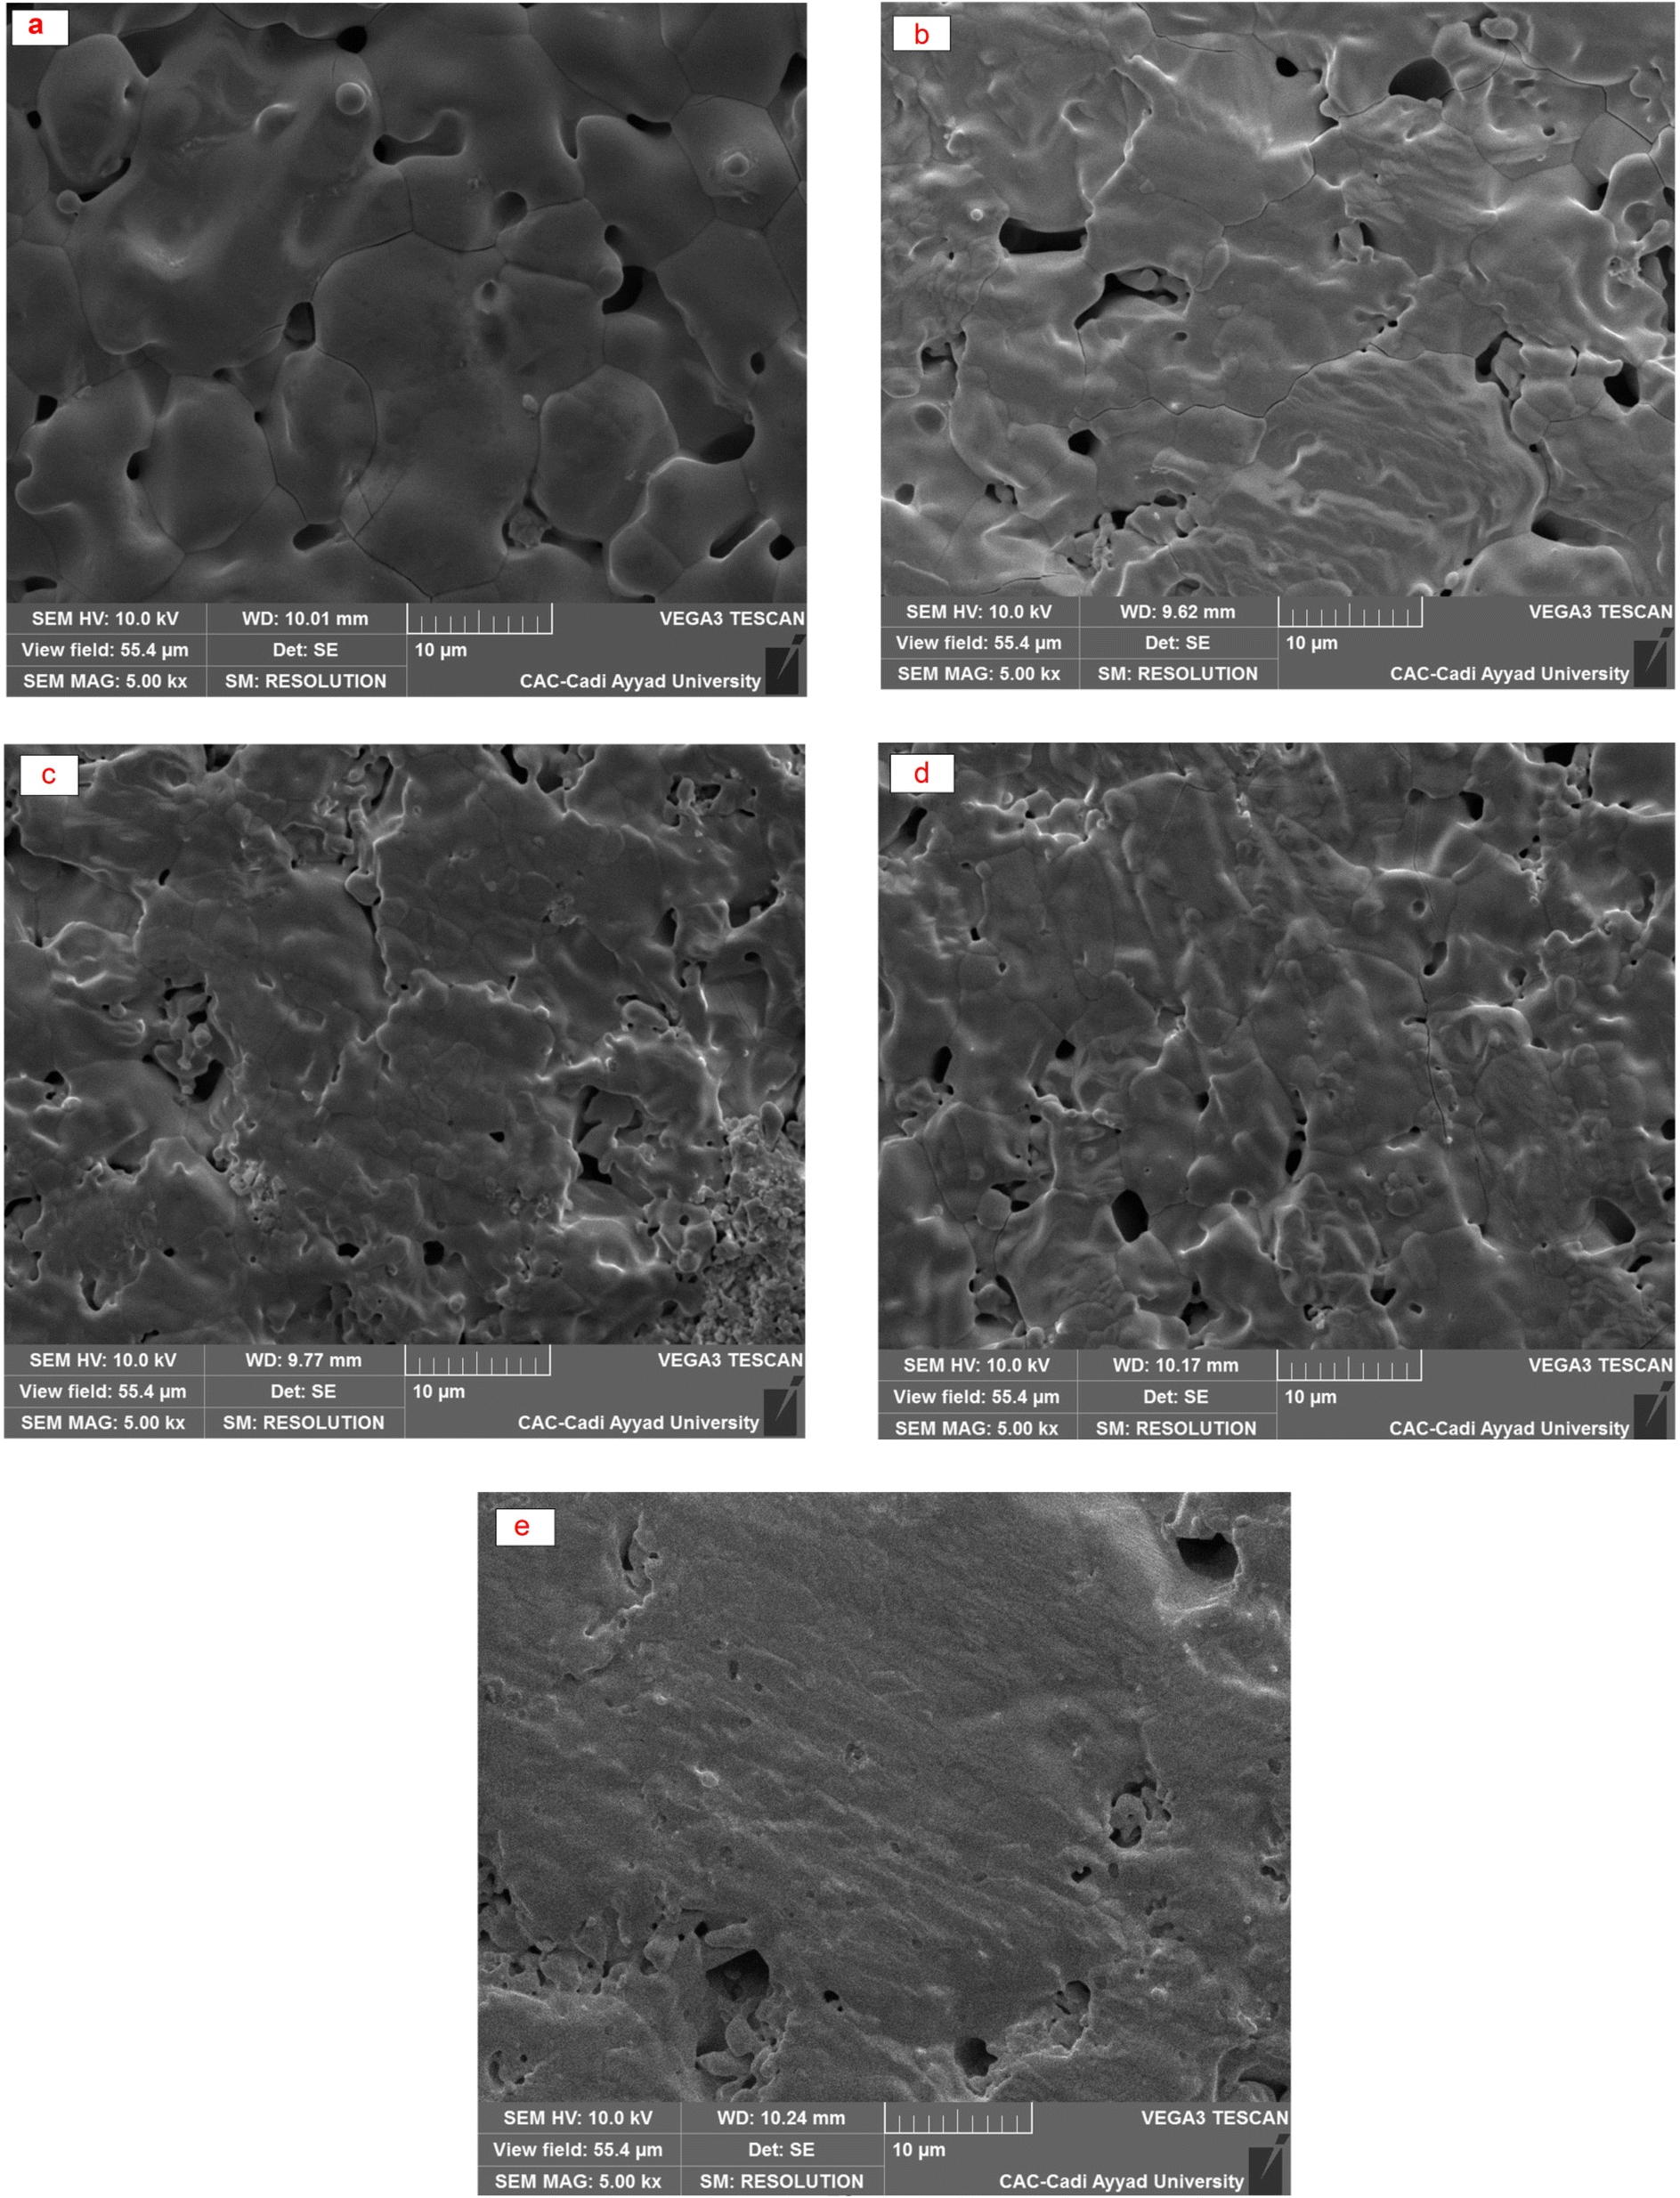 | ||
| Fig. 3 SEM micrographs of sintered Bi4V2−xSixO11−δ compounds. (a) x = 0.0, (b) x = 0.1, (c) x = 0.2, (d) x = 0.3 and (e) x = 0.35. | ||
Elemental analysis results obtained by SEM-EDS (Fig. 4) are presented in Table 2 which shows the presence of the elements Bi, V, Si, C, and O. The EDS shows that the atomic percentages of Bi and V atoms are in close proportion with the expected values given by the formulas of the selected compounds. The presence of carbon as an impurity on all compounds can be due to the sputtering step for sample preparation for SEM imaging.
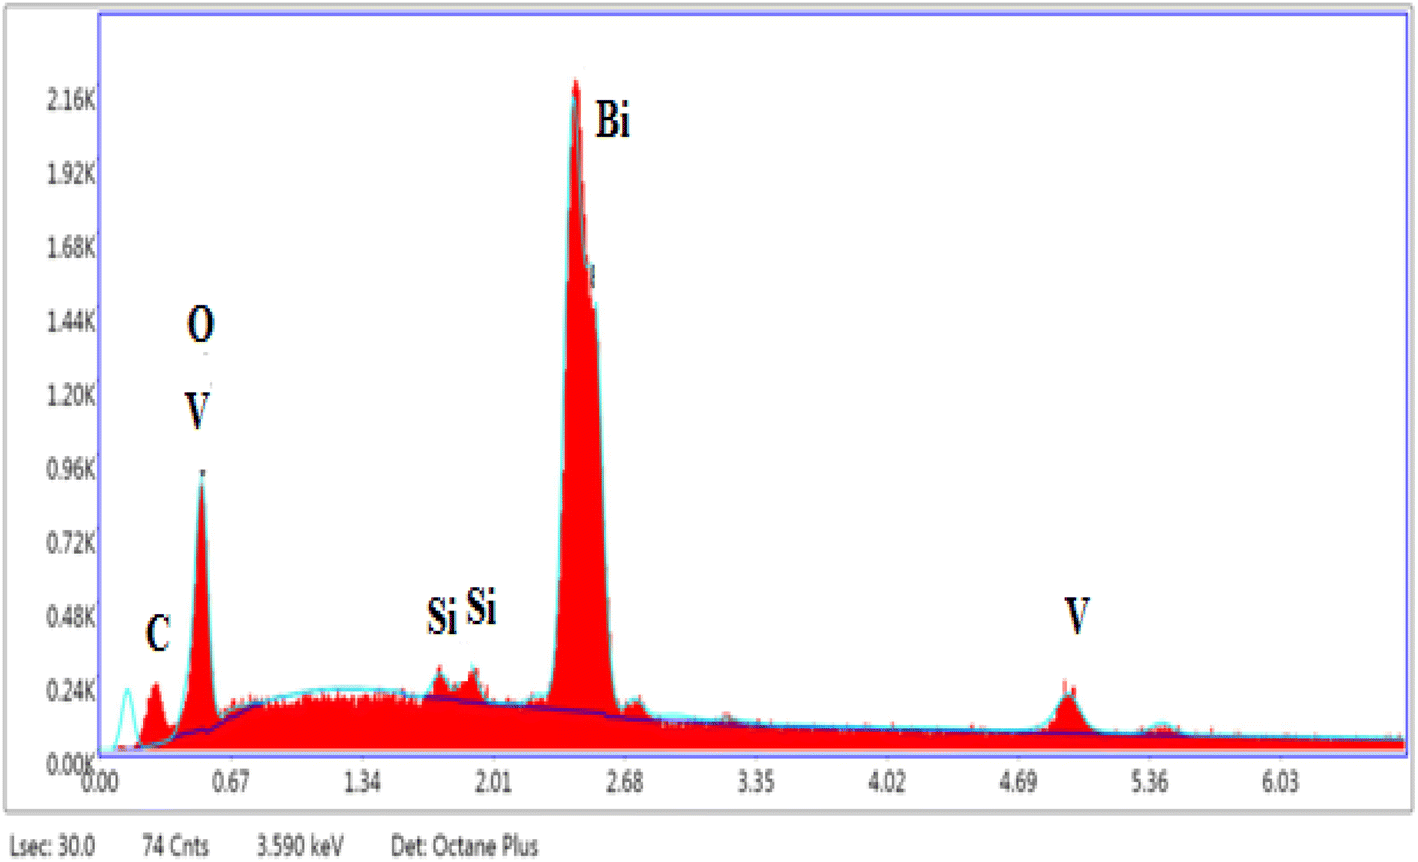 | ||
| Fig. 4 Typical EDS image of the Bi4V1.8Si0.2O10.90. | ||
| x | Elementary analysis-EDS (at%) | ||||
|---|---|---|---|---|---|
| Bi | V | Si | O | C | |
| x = 0.0; Bi4V2O11 | 22.86 | 13.26 | — | 43.01 | 20.87 |
| x = 0.1; Bi4V1.9Si0.1O10.95 | 24.46 | 13.63 | 1.10 | 41.68 | 18.95 |
| x = 0.2; Bi4V1.8Si0.2O10.90 | 21.69 | 9.33 | 2.38 | 47.47 | 19.14 |
| x = 0.3; Bi4V1.7Si0.3O10.85 | 22.57 | 9.38 | 2.43 | 46.68 | 18.94 |
| x = 0.35; Bi4V1.65Si0.35O10.825 | 24.62 | 8.95 | 3.10 | 44.18 | 19.15 |
3.3 Raman spectroscopy
The Raman spectra for the Bi4V2−xSixO11−δ system are illustrated in Fig. 5. It can be noted that the spectrum of the parent compound (x = 0.0) presents vibration bands as reported in the literature of the α-Bi4V2O11.21,22 Bands observed in the frequency range from 527 to 990 cm−1 are associated with the vibration of the VO4 tetrahedral while the fine structure of the spectrum has been attributed to the distortion of VO4, resulting of the V–O bonds length variations.23 However, all the spectra of silicon-doped compounds have a close similarity with that of the parent compound. On the other hand, the spectrum becomes less resolved with the increase in the silicon composition: the fine structure disappears completely for x > 0.35 to result in a spectrum of very wide bands for x = 0.4.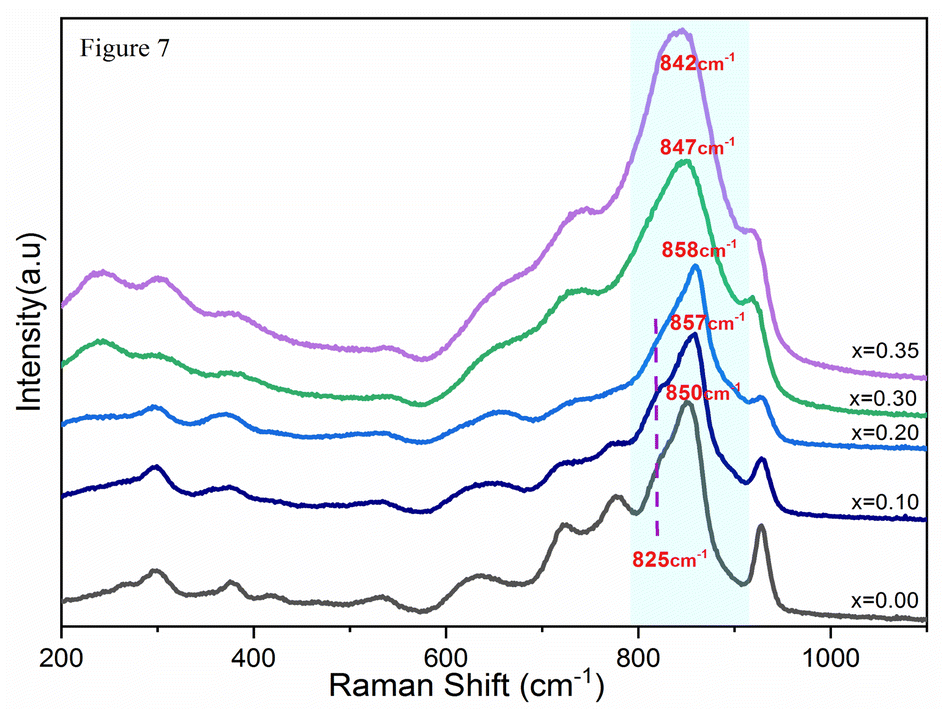 | ||
| Fig. 5 Raman spectra of doped BiSiVOx. | ||
At this stage of the spectra analysis, it can be confirmed that the profile of the bands already makes it possible to account for a disorder that can be revealed by the disappearance of the fine structures of the spectra with the increase of doping rate. But, although Raman spectroscopy provides a lot of information when applied to the study of metal oxides in the solid state or in the form of bulk phases. The analysis of the presented spectra does not allow discussing of the crystallographic changes in the structure of the vanadate anion.24,25 To do this, it would be necessary to elicit a rigorous analysis of the modes of vibration. The procedure consists in taking into account all the atoms that make up the lattice. In the case of BiMeVOx, the vibration study should be quite complex, taking into account the fact that the crystal lattice consists of two different types of metal–oxygen polyhedral, and one of them contains metal cations of different charges and sizes. On the other hand, the symmetry changes revealed by XRD do not make it possible to predict the additional spectral complexities since the spectra of the doped BiSiVOx do not have significant differences form that of the parent compound. This complexity could be circumvented by a detailed vibration analysis in the factor group. Nevertheless, such an approach is not feasible insofar as the spatial groups of most of these prepared materials are not yet known with certainty and the simplicity of the recorded spectra limits the correlation field effects that could be derived from the vibration coupling of the unit cells (Fig. 6).
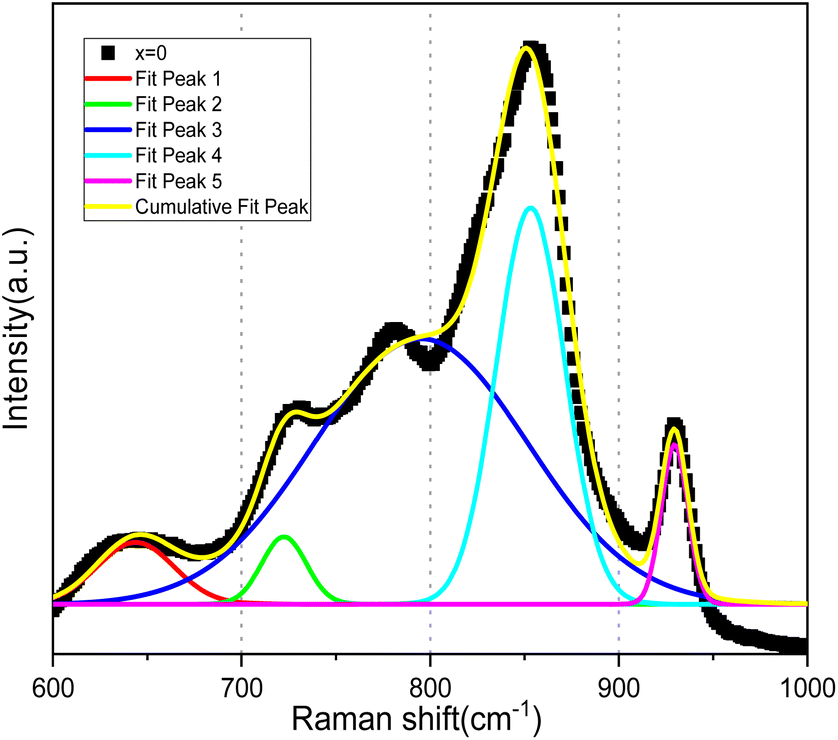 | ||
| Fig. 6 Deconvolution of the Bi4V2O11 spectrum into Gaussian bands. | ||
Three essential approximations have been performed in order to more easily interpret the Raman spectrum of transition metal oxide complexes.25–31
First of all, the hypothesis of the site symmetry approximation allows the separation between the internal modes of the molecular unit and the external modes of the crystal lattice. The external modes occur at lower frequencies and correspond to the translations and the liberation of the molecular units in the crystal while the internal modes occur in the high-frequency region and constitute the normal vibrations of the molecular unit.26,27
Secondly, despite the differences in the symmetry of the prepared materials depending on the composition of the dopant, their IR spectra are very similar, showing strong and well-defined absorption bands, typical of perovskite materials.28,29,32 These bands are mainly assigned to the anti-symmetric stretching and deformation modes of the octahedral fractions BO6.26 In addition since the two cations Bi and V are present as octahedral MO6 building blocks with M–O bonds involving metal cations of different charges, it can be assumed that the MO6 units behave as approximately ‘isolated’ groups that dominate the spectroscopic behavior. It is then possible to distinguish between the vibrators of the vanadium polyhedron and that of bismuth.30,31
Finally, the diatomic approach makes it possible to consider each metal–oxygen bond in a molecular species or a crystal lattice as a vibrating oscillator independently of its environment. Such an approximation assumes that there are no vibrational interactions between neighboring metal–oxygen bonds in the lattice. Thus, the Raman spectrum of the crystalline compound can be considered as a superposition of bands each of which is attached to an elongation motion directly reflecting the metal–oxygen bond. Specific frequencies observed on the Raman spectrum then uniquely characterize the metal–oxygen bond. Naturally, this approach does not lead to an analysis of the vibrational modes because it neglects the interactions between the nearest neighboring groups.25–27,33
According to these hypotheses, empirical relationships have been established to correlate the bond lengths (M–O) to their elongation frequencies observed on the vibration spectra of different metal oxides: Mo–O,26 V–O,27 Nb–O,34 Bi–O,35 and W–O.36 Relationships have been adapted to the determination of both the Metal–O distances and the determination of the environments (tetrahedral/octahedral) of the cation as in the ferrite Cu–Si Cu1+xSixFe2−2xO4,25 and in the BiMeVOx.18,19,33 However, this approach can be justified within the limits of the experimental error allowed by crystallographic determinations of bond lengths.
In light of the bibliographic analysis, the bond lengths (R) calculated from the frequencies of our Raman spectra of BiSiVOx at different compositions are reported in Table 3. The recorded frequencies show that the number of νas waves (V–O) decreases substantially with the increase in the Si composition. This decrease in the wave numbers during the substitution of V5+ can be related, on the one hand, to the increase in the V–O bond distance and, on the other hand, to the vanadium environments. For the composition x = 0.1 and x = 0.2, the Raman spectrum presents two components located at 857 and 825 cm−1 indicating, according to the diatomic approximation, that two types of V–O bonds exist with substantially different lengths [νas (857 cm−1); R = 1.6767 Å, νas (825 cm−1); R = 1.6966 Å] respectively.
| x | νs(V–O) cm−1 | νas(V–O) cm−1 | δ(O–V–O) cm−1 | R(V–O) Å | R(V–O) Å | |||
|---|---|---|---|---|---|---|---|---|
| 0.0 | 776 | 723 | 850 | 825 | 639 | 534 | 1.6810 | 1.6966 |
| 0.1 | 776 | 722 | 857 | 825 | 649 | 534 | 1.6767 | 1.6966 |
| 0.2 | 732 | — | 858 | 825 | 653 | 534 | 1.6761 | 1.6966 |
| 0.3 | 733 | — | 847 | — | 651 | 535 | 1.6829 | |
| 0.35 | 740 | — | 842 | — | 663 | 539 | 1.6860 | |
In contrast, only a single broad component is observed on the spectrum when x becomes greater than >0.2. This contribution is located at 847 cm−1 for x = 0.3 and at 842 cm−1 for x = 0.35. According to the same hypothesis, the existence of a single band can be explained by the existence of one type of V–O group [νas (847 cm−1); R = 1.6829 Å], [νas (842 cm−1); R = 1.6860 Å]. In view of the bond lengths and the width of the strip, this grouping should be located in a more disorderly environment.
In parallel, the Raman frequencies show a decrease in the average V–O bond length with increasing x-value. Yue et al.37 explain that when increasing the x-value, as the vacancy content increases, more octahedral V polyhedra transform to lower coordinate geometries, resulting in a decrease in the average V–O bond length. The decrease in bond lengths has been related to the transformation of octahedral V polyhedra to lower coordinate geometries, which increases the vacancies content and which well explains the conductivity discontinuity.
3.4 Differential thermal analysis
The DTA thermo-grams recorded for the BiMeVOx samples with x = 0.1, 0.2, 0.3, and 0.35 are shown in Fig. 7. The DTA curve of the compound with x = 0.1, shows two endothermic peaks that appeared during heating at 447 °C and 532 °C, representing the phase transition α → β and β → γ, respectively. However, a single endothermic peak observed for the compositions with x = 0.2 and 0.3 at 429 °C and 421 °C respectively, is attributed to the β → γ transition, which is in good agreement with the results of the X-rays diffraction presented previously. The BiSiVOx system, like other prepared BiMeVOx, exhibits a general decrease in both the transition temperature and the intensity of the peak corresponding to slow heat flux for the β → γ transition with the increase in the silicon content. In the case of the sample with x = 0.35, no peak was observed in the DTA diagram which indicates that the γ-forms stabilized at room temperature instead of the γ′-form. The same result was observed in the Bi4V2−xCux/2Alx/2O11−5x/4 for x = 0.3 compositions.14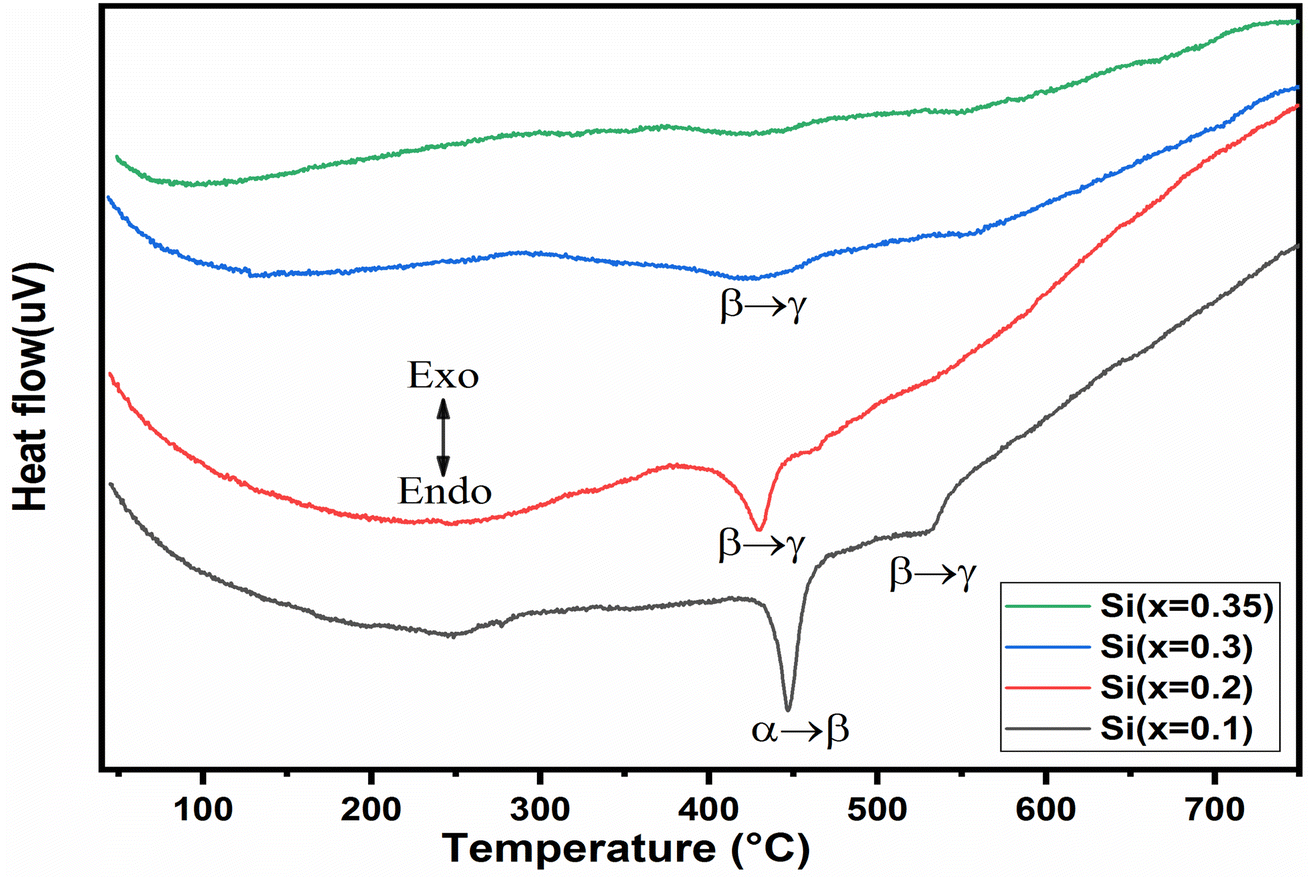 | ||
| Fig. 7 Thermo-grams DTA of the BiSiVOx system as a function of the composition (x). | ||
3.5 Ionic conductivity
Measurements were performed on sintering pellets at 800 °C for 24 h. Samples with different compositions exhibit relative densities about 89%. Fig. 8 shows typical Nyquist plots generated by representing the imaginary part Z′′ as a function of the real part Z′ for different compounds at the temperature of 300 °C under air. At this temperature, the impedance diagrams consisted of a single depressed semicircular arc in the region of high frequencies, which reflects both grain boundary and grain bulk effects. The straight lines observed at low frequencies are associated with electrode polarization processes.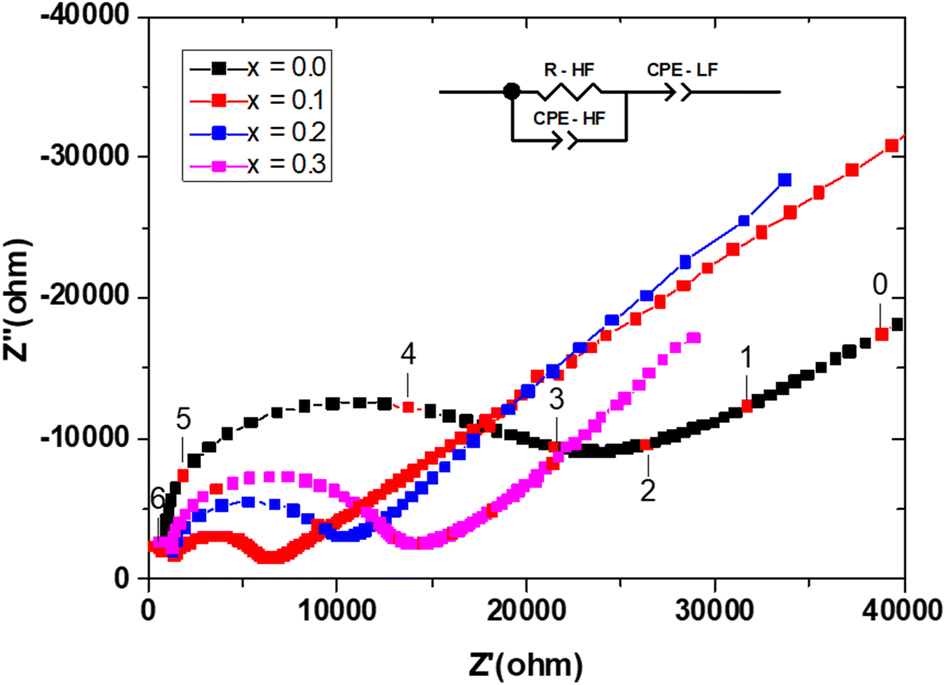 | ||
| Fig. 8 Typical Nyquist plots at T = 300 °C for the different compositions in the Bi4V2−xSixO11−x/2 system. The selected equivalent circuit used for data fitting is inserted. The numbers inside are the logarithm of frequencies. | ||
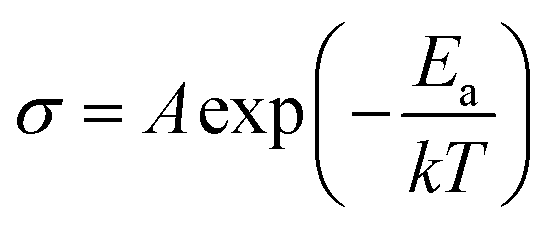
The Arrhenius curves of the ionic conductivity for the compositions Bi4V2−xSixO11−x/2 over the temperature range of 300–700 °C are presented in Fig. 9. The corresponding activation energy for each linear part was calculated from the slope of the graphs using the following Arrhenius equation:
 | (1) |
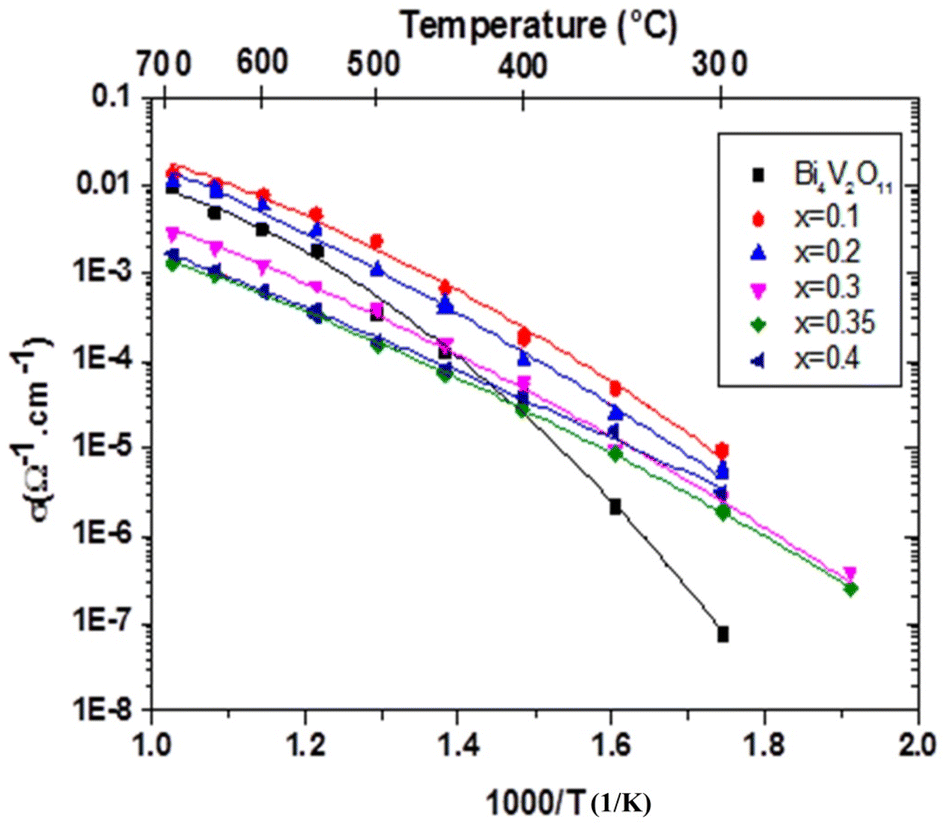 | ||
| Fig. 9 Arrhenius plots of the electrical conductivity of the Bi4V2−xSixO11−x/2 compounds: x = 0.00, x = 0.10, x = 0.20, x = 0.30, x = 0.35 and x = 0.40. | ||
From the conductivity plots, a clear discontinuity in conductivity can be observed in three distinct regions, for compounds with x = 0 and x = 0.1, the two drops in the diagrams occur around 400 °C and 549 °C with x = 0 and around 450 °C and 500 °C with x = 0.1. The DTA analysis shows the two-phase transitions at 447 °C and 532 °C for the sample with x = 0.1.
For the composition x = 0.2 and 0.3, a clear discontinuity in the conductivity can be noticed, around 450 and 400 °C, respectively. This discontinuity indicates a transition from the β phase to the γ phase and the improvement in the conductivity could be due to the structural disorder of the crystal following the phase transformation. Similarly, the DTA analysis shows that the phase transition occurs at 429 °C and 421 °C for the sample with x = 0.2 and x = 0.3 respectively.
In the tetragonal phase with x = 0.35, two distinct linear regimes can be observed with a small change in slope around 580 °C. Moreover, the two regimes with different activation energy (Ea) observed vary between 0.88 eV in the low-temperature range LT and 0.5 eV at higher temperature HT, corresponding to the order-disorder phase transition γ′ → γ. DTA analysis does not show this transition which seems to induce a slight vacancy ordering. It should be mentioned here that there is no apparent structural difference between the γ′ and γ phases. However, the latter seems to be more disordered with low activation energy compared to the first one.14,34
According to the ionic conductivity curves, it can be seen that the highest conductivity value is of the order of 10−5 S cm−1 at 300 °C. This value is obtained from the composition x = 0.1, on the other hand, for x = 0.35, the conductivity value is of the order of 10−6 S cm−1 at 300 °C, while for the undoped compound, the conductivity value is lower and close to 10−7 S cm−1 at 300 °C. It can be found that the optimal amount of the totally ordered gaps are obtained in the composition of x = 0.1. At 600 °C, the highest ionic conductivity, namely 10−2 S cm−1 was obtained for the composition x = 0.1, while for the other composition, the ionic conductivity is of the order of 10−3 S cm−1.
The values of the activation energy are given in Table 4. For BiSiVOx compounds, a decrease in activation energy was observed with increasing temperature, this decrease is related to the transition from the ordered phase (α and β) to the disordered phase (γ).
| x | Chemical formula | σ300°C (S cm−1) | σ600°C (S cm−1) | Ea HT (eV) T > 500 °C | Ea MT (eV) 400 °C ≤ T ≤ 500 °C | Ea LT (eV) T < 400 °C |
|---|---|---|---|---|---|---|
| 0.00 | Bi4V2O11 | 9.3 × 10⁻⁸ | 5 × 10⁻³ | 0.75 | 0.83 | 1.54 |
| 0.10 | Bi4V1.9Si0.1O10.95 | 9.4 × 10⁻⁶ | 10−2 | 0.44 | 1.76 | 1.06 |
| 0.20 | Bi4V1.8Si0.2O10.9 | 6.5 × 10⁻⁶ | 7.8 × 10⁻³ | 0.78 | __ | 1.12 |
| 0.30 | Bi4V1.7Si0.3O10.85 | 2.1 × 10⁻⁶ | 1.2 × 10⁻³ | 1.04 | __ | 1.05 |
| 0.35 | Bi4V1.65Si0.35O10.825 | 3.1 × 10⁻⁶ | 7.4 × 10⁻⁴ | 0.50 | __ | 0.88 |
In the case of x = 0.1, the ionic conductivity increases almost 100 times at 300 °C and 2 times at 600 °C, compared to the mother phase (x = 0.0). This compound with α form has a conductivity higher than compounds with the γ. Moreover, the ionic conductivity decreases when the degree of substitution of vanadium by silicon increases. This lowering of conductivity with increasing amount of the dopant ions is commonly observed in BiMeVOx compounds which is due to increased defect trapping effects caused by the increasing amounts of the substitution. The same phenomenon was observed in the BiGaVOx system.37
For x = 0.1, the conductivities obtained at 300 °C and 600 °C which are of the order of 10−5 S cm−1 and 10−2 S cm−1 respectively, are very close to the conductivities obtained by Beg et al.21 for the same composition of the Bi4V2−xCexO11−x/2 solid solution. This result clearly shows that the maximum conductivity presented by the BiMeVOx does not depend either on the effective, ionic radius or the charge of the doping metal ion.
In the case of x ≠ 0.0, in both high and low-temperature regions, a decrease in the activation energy is observed and a modification of the diffusion phenomena in the vanadate layers resulted in an improvement in ionic conductivity. In BiMeVOx compounds, the increase in the activation energy at low temperature can be related to the ordering of oxygen vacancies,2 which is probably accentuated, in the case of our samples, by the covalence of the Si–O bond. Generally, the activation energy Ea (γ) in BiMeVOx is between 0.2 and 0.44 eV, but in the case of our samples Ea(γ) > Ea(γ) BiMeVOx,1,16 this phenomenon is probably due to the anionic vacancy rate which is very sensitive to the cooling rate of these materials. Besides, the high activation energies can also be explained by creation of oxygen vacancies in the apical positions leading to a long term ion exchange in the vanadate layers as in the case of Bi4V2−x(Cu,Al)xO11−δ compounds.14
4. Conclusion
The solid solution Bi4V2−xSixO11−δ (0.1 ≤ x ≤ 0.4) has been investigated in the present paper. At room temperature, the XRD pattern shows that the α-monoclinic phase can be stabilized in the composition with x ≤ 0.1, the β-orthorhombic phase in the region 0.2 ≤ x ≤ 0.3, and the γ-tetragonal phase stable for composition x = 0.35. These results are in good agreement with the DTA. A substantial improvement in the electrical conductivity is observed especially at low temperature range, for the composition x = 0.1 which exhibits a ionic conductivity more than two orders of magnitude higher than that of Bi4V2O11. In parallel, the values of the V–O band relived from Raman spectra νas (842 cm−1) show that the relatively larger V–O bonds in the (γ) phase than in the β phase confirms the possibility of easier oxygen transport in the γ phase than in the β phase. As well as the discontinuity of the conductivity values for the indicated compositions. The compound with x = 0.1 has the highest values of conductivity in all the ranges of temperature (10−5 S cm−1 at 300 °C and 10−2 S cm−1 at 600 °C).Conflicts of interest
The authors declare no conflicts of interest.Acknowledgements
The authors are grateful to the Cadi Ayyad University Analysis and Characterization Center (CAC) for providing them with materials characterization techniques. They thank also ICMCB Bordeaux for EIS measurements.References
- F. Abraham, J. Boivin, G. Mairesse and G. Nowogrocki, Solid State Ionics, 1990, 40–41, 934–937 CrossRef CAS.
- I. Abrahams, Solid State Ionics, 2003, 157, 139–145 CrossRef CAS.
- I. Abrahams, A. J. Bush, F. Krok, G. E. Hawkes, K. D. Sales, P. Thornton and W. Bogusz, J. Mater. Chem., 1998, 8, 1213–1217 RSC.
- S. Beg, S. Hafeez and N. A. S. Al-Areqi, Phase Transitions, 2010, 83, 169–181 CrossRef CAS.
- A. Bhattacharya, K. Mallick and P. Thomas, Solid State Commun., 1994, 91, 357–360 CrossRef CAS.
- J. W. Pell, J. Y. Ying and H. C. zur Loye, Mater. Lett., 1995, 25, 157–160 CrossRef CAS.
- B. Roy and P. A. Fuierer, J. Mater. Res., 2009, 24, 3078–3086 CrossRef CAS.
- A. Castro, P. Millán, J. Ricote and L. Pardo, J. Mater. Chem., 2000, 10, 767–771 RSC.
- I. I. Mikhalenko, E. I. Povarova and A. I. Pylinina, Russ. J. Phys. Chem. A, 2016, 90, 771–776 CrossRef CAS.
- K. Trzciński, A. Borowska-Centkowska, M. Sawczak and A. Lisowska-Oleksiak, Solid State Ionics, 2015, 271, 63–68 CrossRef.
- S. Sharma, S. Aich and B. Roy, J. Phys. Chem. Solids, 2021, 148, 109754 CrossRef CAS.
- D. Tripathy, A. Saikia, G. T. Tado and A. Pandey, Indian J. Phys., 2018, 93, 845–859 CrossRef.
- J. Exner, P. Fuierer and R. Moos, Thin Solid Films, 2014, 573, 185–190 CrossRef CAS.
- R. Essalim, A. Ammar, M. Zamama and F. Mauvy, J. Solid State Chem., 2020, 288, 121405 CrossRef CAS.
- D. Tripathy, A. Saikia, G. T. Tado and A. Pandey, J. Adv. Ceram., 2019, 8, 489–499 CrossRef CAS.
- M. Alga, A. Ammar, R. Essalim, B. Tanouti, F. Mauvy and R. Decourt, Solid State Sci., 2005, 7, 1173–1179 CrossRef CAS.
- D. Tripathy and A. Pandey, J. Alloys Compd., 2018, 737, 136–143 CrossRef CAS.
- R. D. Shannon, Acta Crystallogr., Sect. A: Cryst. Phys., Diffr., Theor. Gen. Crystallogr., 1976, 32, 751–767 CrossRef.
- Y. Yue, A. Dzięgielewska, S. Hull, F. Krok, R. M. Whiteley, H. Toms, M. Malys, M. Zhang, H. Yan and I. Abrahams, J. Mater. Chem. A, 2022, 10, 3793–3807 RSC.
- A. Dziegielewska, M. Malys, W. Wrobel, S. Hull, Y. Yue, F. Krok and I. Abrahams, Solid State Ionics, 2021, 360, 115543 CrossRef CAS.
- S. Beg and N. A. S. Al-Areqi, J. Phys. Chem. Solids, 2009, 70, 1000–1007 CrossRef CAS.
- S. Beg and N. A. S. Al-Areqi, Philos. Mag., 2009, 89, 1279–1294 CrossRef CAS.
- O. Joubert, A. Jouanneaux and M. Ganne, Mater. Res. Bull., 1994, 29, 175–184 CrossRef CAS.
- B. Vaidhyanathan, K. Balaji and K. J. Rao, Chem. Mater., 1998, 10, 3400–3404 CrossRef CAS.
- H. M. Zaki and S. F. Mansour, J. Phys. Chem. Solids, 2006, 67, 1643–1648 CrossRef CAS.
- F. D. Hardcastle and I. E. Wachs, J. Phys. Chem., 1991, 95, 5031–5041 CrossRef CAS.
- F. D. Hardcastle, I. E. Wachs, H. Eckert and D. A. Jefferson, J. Solid State Chem., 1991, 90, 194–210 CrossRef CAS.
- S. D. Ross, J. Mol. Struct., 1973, 15, 468–469 Search PubMed.
- E. J. Baran, Catal. Today, 1990, 8, 133–151 CrossRef CAS.
- A. E. Lavat and E. J. Baran, Vib. Spectrosc., 2003, 32, 167–174 CrossRef CAS.
- A. E. Lavat and E. J. Baran, J. Alloys Compd., 2008, 460, 152–154 CrossRef CAS.
- J. T. Last, Phys. Rev., 1957, 105, 1740–1750 CrossRef CAS.
- S. J. Patwe, A. Patra, R. Dey, A. Roy, R. M. Kadam, S. N. Achary and A. K. Tyagi, J. Am. Ceram. Soc., 2013, 96, 3448–3456 CrossRef CAS.
- F. Hardcastle and I. Wachs, Solid State Ionics, 1991, 45, 201–213 CrossRef CAS.
- F. D. Hardcastle and I. E. Wachs, J. Solid State Chem., 1992, 97, 319–331 CrossRef CAS.
- F. D. Hardcastle and I. E. Wachs, J. Raman Spectrosc., 1995, 26, 397–405 CrossRef CAS.
- Y. Yue, A. Dzięgielewska, F. Krok, R. M. Whiteley, H. Toms, M. Malys, H. Yan and I. Abrahams, J. Phys. Chem. C, 2022, 126, 2108–2120 CrossRef CAS.
| This journal is © The Royal Society of Chemistry 2023 |