DOI:
10.1039/D3RA00492A
(Paper)
RSC Adv., 2023,
13, 7392-7401
Magnetic chitosan/TiO2 composite for vanadium(V) adsorption simultaneously being transformed to an enhanced natural photocatalyst for the degradation of rhodamine B†
Received
23rd January 2023
, Accepted 27th January 2023
First published on 7th March 2023
Abstract
A magnetic chitosan/TiO2 composite material (MCT) was developed. MCT was successfully synthesized by a one-pot method using chitosan, TiO2, and Fe3O4. The absorption equilibrium time of MCT was 40 min in absorbing vanadium(V), the optimal adsorption pH was 4, and the maximum adsorption capacity of vanadium(V) was 117.1 mg g−1. The spent MCT was applied to photocatalytic reactions for reutilization. The decolorization rates for the degradation of rhodamine B (RhB) by new and spent MCT were 86.4% and 94.3%, respectively. The new and spent MCT exhibited absorption bands at 397 and 455 nm, respectively, which showed that the spent MCT was red-shifted to the cyan light region. These results indicated that the forbidden band widths of the new and spent MCT were about 3.12 and 2.72 eV, respectively. The mechanism of the degradation reaction showed that the hydroxyl radicals as oxidants in the spent MCT mediated the photocatalytic degradation of RhB. In addition, the superoxide anion radical formation of hydroxyl radicals was the main reaction, and the hole generation of hydroxyl radicals was the subordinate reaction. The N-de-ethylated intermediates and organic acids were monitored by MS and HPLC.
Introduction
Vanadium belongs to group VB in the periodic table of elements.1 The appearance of compact vanadium is light gray, with a high melting point (1910 °C) and boiling point (3409 °C).2 Its hardness and tensile strength limit are closely related to the conditions applied in heat treatment processing and the impurity content.3 Pure V has good plasticity and can be rolled into sheets, foils, and drawn into wires at room temperature.4 Doping a small amount of impurities into V, especially interstitial elements, such as carbon, oxygen, nitrogen, and hydrogen, can reduce its plasticity and increase its hardness and brittleness.5 V exists mainly in the crust and contains excellent chemical and physical properties, which make it diffusely used in many industries, including mining, metallurgy, smelting, casting, polymers, petroleum refining, and pigments.6,7 However, vanadium(V) is hazardous for humans and can result in serious health problems, including heart disease and damage to the kidney and nervous central system. Thus far, the recycling techniques of vanadium(V) have also attracted the attention of researchers.8,9 The recovery of vanadium(V) is essential and necessary for environmental protection and resource recovery. At present, the main methods include extraction, membrane filtration, ion exchange, and adsorption.10–12 As adsorption has lots of advantages, such as low cost, simple operation, high efficiency, and no intermediate by-products, it has been widely applied in industries.13–15 The normal adsorbents include activated carbon, graphene, goethite, and metal–organic frameworks.16–19
Chitosan is a derivative of chitin.20 It is an ideal adsorbent material with low price, comprehensive sources, good biocompatibility, and no secondary pollution.21,22 The molecular chain of chitosan contains –NH2 and –OH groups, which can coordinate with heavy metal ions and provide high adsorption capacity;23 therefore, its use is imperative in water treatment, metal extraction and recycling fields. Up to now, there is a significant problem that afflicts adsorbents, namely an incomplete desorption of metal ions.24 This seriously affects the reusability of spent adsorbents. Moreover, the abandoned adsorbent remains with a lot of metal ions, which represent a serious secondary pollutant that can severely affect the environment. Thus, how to dispose of spent adsorbents is a valuable research subject. In this line, R. Das et al.25 prepared a thiol-functionalized (mercaptoacetic acid) conducting polypyrrole (PPy/MAA) composite for mercury (Hg) adsorption. The results showed that the adsorbent had a high adsorption capacity for Hg(II). In addition, the post-adsorbed Hg(II) adsorbent proved its catalytic potential and it could convert phenylacetylene to acetophenone. Recently, P. Fang et al.26 prepared copper (Cu) ion-imprinted polymers based on mesoporous silica/magnetic graphene oxide composites (MS/MGO) as the support 2-((2-(3-(trimethoxysilyl)propylamino)ethylimino)methyl)phenol (TPEMP) bearing a Schiff-base as the functional monomer. The results indicated these imprinted polymers could not only be applied to effectively remove Cu(II) ions from aqueous solution, but also could be used in the heterogeneous catalytic organic synthesis of 1-methyl-4-(p-tolyloxy)benzene, displaying a best catalytic efficiency of 95%. Recently, our group reported a temperature-sensitive block polymerpoly-N,N-diethylacrylamide-b-poly(N,N-diethylacrylamide-co-acrylamide) and then applied this for the selective absorption of Ru(III). Then the waste Ru-IIP as an effective catalyst was used to catalyze the coupling reactions of nitrobenzene and benzyl alcohol.27 However, the current reports of spent adsorbents and how they can be reused are confined to converting them into transition-metal-supported catalysts, essentially. They are usually used in oxidation, reduction, and cross-coupling catalytic reactions and so on, whereas the transition metal-catalyzed cross-coupling reaction almost inevitably uses toxicant organic solvents (such as methylbenzene, dimethyl formamide, chloroform, acetonitrile), and also need to be heated to a specific temperature to reach the activation energy. The research and development of the techniques reusing spent adsorbents is vital. However, the application of spent adsorbents in photocatalytic reactions has not been reported.
In this work, a magnetic chitosan/TiO2 composite material (MCT) was developed, which could efficiently recycle vanadium(V) from aqueous solution. The adsorption/desorption capacity of vanadium(V) was investigated, and the adsorption kinetics and isotherm are discussed. In addition, compared to the unused MCT, the spent MCT could enhance the photocatalytic degradation efficiency of RhB. To the best of our knowledge, this is the first time spent adsorbents have been applied to photocatalytic reactions for reutilization. Here, we report an economical and effective method for utilizing waste materials like in natural photocatalytic reactions, as these use clean energy and do not need any extra expensive energy. This would have a positive significance for environmental protection and put forward a new possible strategy for reusing spent adsorbents. Through experiments, the mechanism of the degradation reaction is revealed, in which active species served as oxidants in the photocatalyst-mediated photocatalytic oxidation of RhB.
Experimental
Materials
TiO2 was supplied by Tianjin Damao Co., Ltd. Fe3O4 was purchased from Heibei Hengxing Co., Ltd. NH4VO3 and RhB were provided by Aladdin Reagent Co., Ltd. Chitosan was purchased from Macklin Co., Ltd (deacetylation degree ≥95%). Ethylene diamine tetraacetic acid disodium salt (EDTA-2Na), benzoquinone (BQ), isopropanol (IPA), H2O2, NaOH, CH3COOH, and glutaraldehyde were purchased from Innochem Co., Ltd. All the chemicals were of analytical grade and used without further purification. Secondary distilled water was provided by our lab.
Characterization
The micromorphologies and composition were studied by field emission scanning electron microscopy (SEM, HITACHI, SU8020, Japan) and Flourier transformed infrared spectroscopy (FT-IR, 4000–400 cm−1, Nicolet 6700 apparatus, Thermo Fisher Scientific, U.S.). The ion concentration in solution was measured by ICP-AES (Optima 7300V, PerkinElmer, U.S.). Vibrating sample magnetometry was applied to measure the magnetic properties (VSM, MPMS-SQUID VSM-094, Quantum Design, U.S.). N2 adsorption–desorption analysis was performed for chitosan and MCT using a surface area and porosity analyzer (BET, ASAP 2020, Micromeritics Instrument Corp., U.S.). The enhanced photocatalytic mechanism was studied by X-ray photoelectron spectroscopy (XPS, ESCALAB 250Xi, Thermo Fisher Scientific, U.S.), ultraviolet-visible spectrometry (UV-vis, UV-752N, Shanghai Precision and Scientific Instrument Co., Ltd, China), ultraviolet-visible diffuse reflection spectroscopy (UV-DRS, ESCALAB 250XI, Thermo Fisher Scientific, U.S.), electron paramagnetic resonance (EPR, Bruker E-500, Switzerland), time-of-flight mass Spectrometry (MS, Orbitrap Fusion™ Tribrid™, Thermo Scientific, U.S.), and liquid chromatography (HPLC, Agilent 1200, U.S.).
Preparation of MCT
First, 200 mg chitosan was added into 10 mL 2% (v/v) acetic acid aqueous solution in a 25 mL flask, and mixed for 3 h until the chitosan had dissolved completely. Then, 200 mg TiO2 and 20 mg Fe3O4 were added into the chitosan solution and mixed for 2 h at room temperature. Under continuous stirring, 2.0 M NaOH solution was added dropwise until the precipitation was completed. In addition, 1 mL of 2.5% glutaraldehyde was added and stirred for 8 h. After the reaction had finished, the products were washed with secondary distilled water and ethanol alternately, until the waste liquid was neutralized. Finally, MCT was filtrated and dried at 50 °C for 24 h.
Adsorption studies
First, 1.483 g of NH4VO3 was dissolved in a 500 mL volumetric flask with secondary distilled water as a 1000 mg L−1 vanadium(V) standard stock solution. The 1000 mg L−1 vanadium(V) standard stock solution was diluted to a 100 mg L−1 vanadium(V) standard solution.
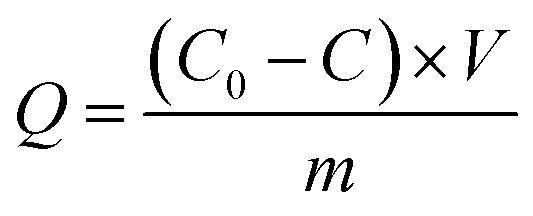
Next, 20.0 mg MCT adsorbents were added into a 100 mL beaker, with 50 mL 100 mg L−1 vanadium(V) aqueous solution, and then vibrated and adsorbed for 12 h at a constant temperature of 25 °C. After using a strong magnet to separate the adsorbent and the solution, an appropriate amount of supernatant was taken and measured by ICP-AES. The adsorption Q (mg g−1) was calculated according to eqn (1):
| |
 | (1) |
where
Qe is the adsorption capacity of vanadium(
V) at adsorption equilibrium (mg g
−1),
C0 stands for the concentration of vanadium(
V) in the initial mixture (mg L
−1),
Ce represents the concentration of vanadium(
V) at adsorption equilibrium (mg L
−1),
V is the solution volume (L), and
m is the mass of MCT (g).
Determination of the optimal pH
The pH value (2–10) of the solution was adjusted with 0.1 M NaOH and HCl solution as measured by a pH meter (PHS-3D, Shanghai Precision Scientific Instrument Co., Ltd). The other conditions were the same in the batch adsorption conditions. The value of the maximum adsorption capacity was calculated according to eqn (1).
Adsorption kinetics studies
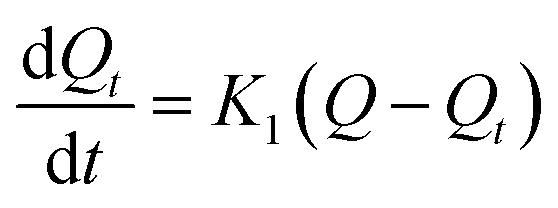
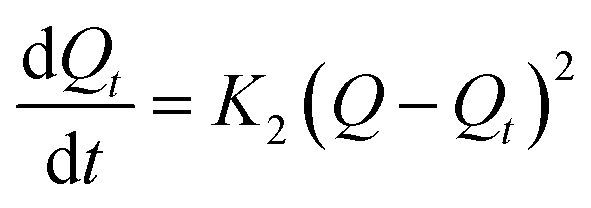
To explore the rate control steps of the physical and chemical adsorption process, the kinetic data were fitted by the pseudo-first-order and pseudo-second-order kinetic models. The solution pH was adjusted to pH 4, while the other conditions were the same as in the batch experiments, only changing the adsorption time (4–720 min). The adsorption Q (mg g−1) was calculated according to eqn (1). The pseudo-first-order and pseudo-second-order kinetic models are shown in eqn (2) and (3):
The pseudo-first-order kinetic model:
| |
 | (2) |
The pseudo-second-order kinetic model:
| |
 | (3) |
where
Q is the adsorption capacity of MCT (mg g
−1) when adsorption reached equilibrium,
Qt is the adsorption capacity of MCT (mg g
−1) when adsorption reached time
t,
K1 is the rate constant of the first-order kinetic model, and
K2 is the rate constant of the second-order kinetic model.
Adsorption isothermal analysis
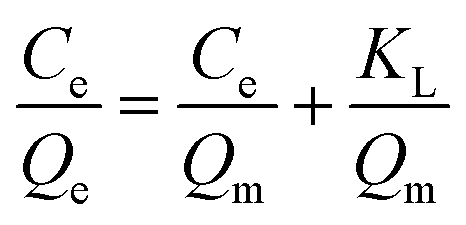
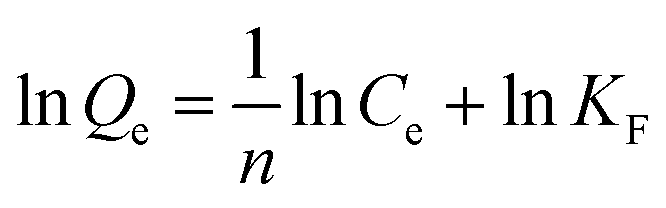
The adsorption isotherm process was explored by Langmuir and Freundlich isotherm adsorption models. The solution pH was adjusted to pH 4, and the adsorption time was 40 min. The other conditions were the same as for the batch adsorption experiment conditions, and only the initial concentration condition (10–300 mg L−1) was changed. The adsorption Qe (mg g−1) was calculated according to eqn (1). After that, the adsorption mechanism of MCT at 25 °C was further studied by the Langmuir and Freundlich isothermal adsorption models. The Langmuir and Freundlich models are shown in eqn (4) and (5):
Langmuir model:
| |
 | (4) |
Freundlich model:
| |
 | (5) |
where
Qe (mg g
−1) represents the adsorption capacity of MCT when the adsorption reached equilibrium,
Qm (mg g
−1) is the theoretical saturated adsorption capacity,
Ce (mg g
−1) stands for the concentration of vanadium(
V) when adsorption equilibrium was reached, and
KL and
KF are the adsorption equilibrium constants.
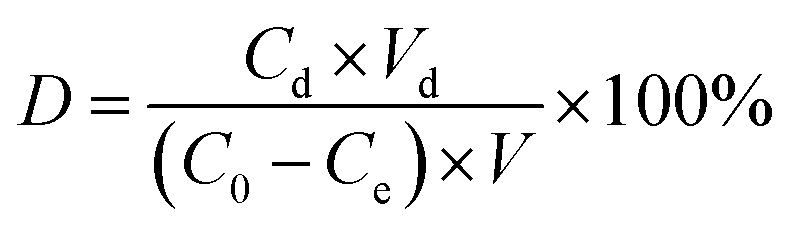
Determination of the desorption rate
First, 20.0 mg of adsorbent was immersed in 50 mL of vanadium(V) solution (100 mg L−1) in a beaker, and vibrated at 25 °C for 40 min. After separating the adsorbent with a strong magnet, it was added in to a beaker containing 50 mL of HCl or NaOH aqueous solution (pH 2 to 10), and then allowed to stand for 240 min before detecting the concentration of the residual solution. The desorption rate (D) was calculated by using eqn (6):| |
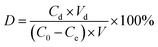 | (6) |
where D is the desorption rate of vanadium(V) (%), Cd represents the concentration of vanadium(V) in the desorption solution (mg L−1), Vd is the volume of the desorption solution (L), C0 stands for the concentration of vanadium(V) in the adsorbed stock (mg L−1), Ce is the concentrations of vanadium(V) in the adsorbed residue (mg L−1), and V is the volume of the adsorbed solution (L).
Cyclic adsorption–desorption performance experiments
First, 20 mg MCT was placed in a mixture solution of vanadium(V) with the same concentration (50 mL 100 mg L−1) at 25 °C for 40 min. Then the MCT was taken out and the adsorption capacity Qe was calculated according to eqn (1). After adsorption, the MCT was desorbed in NaOH solution (50 mL, pH 13) for 240 min at 25 °C. The desorption rate (D) was calculated according to eqn (6). The above process was repeated five times, and the reusability was evaluated according to Qe and D.
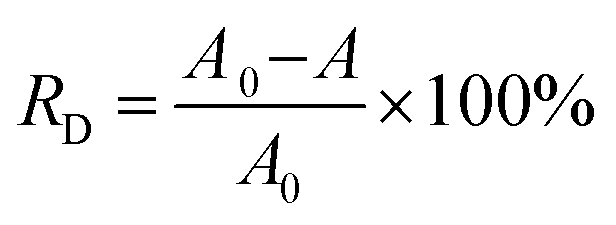
Natural photocatalytic degradation of RhB studies
The photocatalytic activities of spent MCT were comparatively studied by evaluating the photodegradation rate of RhB pollutant under visible-light irradiation as a model reaction. The adsorbent after adsorption was recycled 5 times, washed by DI water and drying, and then used for the photocatalysis. The efficiencies of the decolorization and degradation were proved by the absorbance changes at the maximum wavelength in RhB solution spectrophotometrically. The maximum absorption wavelength and standard curve are shown in Fig. S1.† In a typical batch process, 100 mL RhB aqueous solution (20 mg L−1) and 50 mg spent MCT were put in a 200 mL cylindrical quartz beaker. The mixture of the photocatalyst and dye were kept in the dark under stirring for 30 min to ensure the adsorption–desorption equilibrium, then exposed to sunlight. The reaction was kept at room temperature. At the set time intervals, 2.5 mL of the solution was extracted by an injector. The solution was analyzed by UV-vis spectroscopy after removing the samples with a magnet. A contrast experiment was carried out following the same procedure but with the unused MCT. The decolorization rate was calculated by using eqn (7):| |
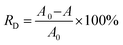 | (7) |
where RD is the decolorization rate of RhB, A0 is the absorbance of the solution before illumination, and A is the absorbance of the solution at illumination time t.
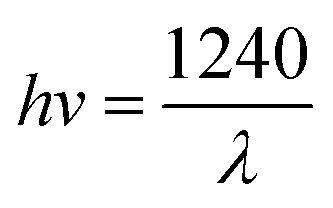
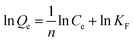
Calculation of the band gap energy
The band gap energy (Eg) was calculated by the plot of (F(R)hv)1/2 versus (hv) by using eqn (8–10):| |
 | (8) |
| |
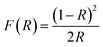 | (9) |
| |
 | (10) |
where R is the reflectance, hv is the photonic energy, λ is the wavelength, and B2 is the proportional constant.
TiO2 is an indirect band gap semiconductor material, so the value of m is 2. When y = 0, the tangent of the reverse extension curve intersects the x-axis, and the optical band gap energy Eg of the semiconductor material can thus be obtained.28,29
EPR measurements
EPR measurements were performed using a Bruker E-500 EPR spectrometer working in the X-band with a modulation frequency of 100 kHz, scanning width of 100 G, microwave power of 20 mW, time constant of 0.04096 s, and magnetic field range of 3434–3530 G. The spent MCT was irradiated at 25 °C directly in the EPR spectrometer microwave cavity by a sunlight lamp (OSRAM, Ultra Vitalux 300 W 230 v E27, China), and the EPR spectra were recorded in situ.
Analysis of the degradation products of RhB
The determination of RhB and the degradation products concentration were performed by HPLC using a C18 column (Ultimate XB-ODS, 250 mm × 4.6 mm, 25 °C). The HPLC separation used ammonium phosphate (0.1%, v/v) as the buffer solution, and 70% methanol as the eluent solvent (flow rate: 0.9 mL min−1, sample amount: 20 μL). The compounds were detected by a diode array detector at 480 nm wavelength.
For further confirming the degradation products, MS was used to analyze the solutions of the catalytic degradation products after 60 min. The MS analysis used positive and negative ion detection modes, respectively. The mass scanning range was m/z 100–500; ion source voltage was ±3.0 kV; ion-transfer tube temperature was 300 °C. For the collision induction experiment (CID): the precursor ion isolation width was 1.0 Da, and the collision energy was 50–60%. The other parameters were automatically optimized and set by the mass spectrometer system.
Results and discussion
Characterizations
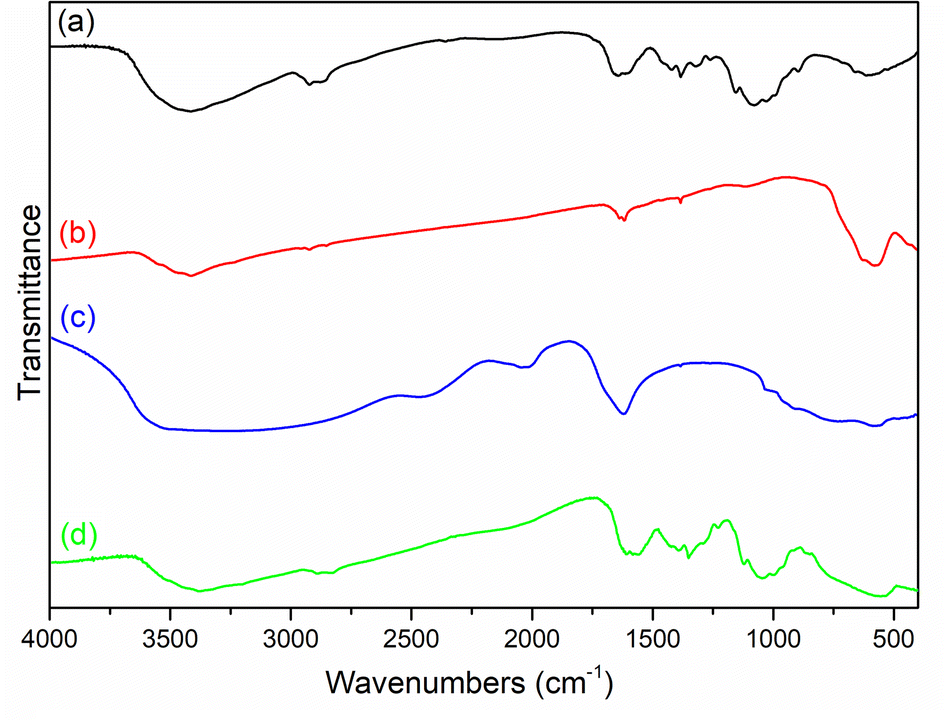
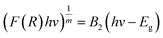
The chemical compositions of the materials were investigated by FT-IR. As shown in Fig. 1, chitosan was confirmed by the characteristic a broad peak at 3428 cm−1, which was ascribed to the overlapping –OH and N–H stretching vibrations, while the peak at 1600 cm−1 was assigned to the N–H bending vibration.30 For Fe3O4, the peaks at 3419, 1614, and 582 cm−1 were ascribed to –OH stretching, bending vibration, and inverse spinel stretching vibration.31 For TiO2, the peaks R 3523 and 586 cm−1 were THE–OH stretching vibration and Ti–O stretching vibration, respectively.32 For MCT, there was a peak at 565 cm−1, which was ascribed to the overlapping inverse spinel stretching vibration and Ti–O stretching vibration, confirming the composite materials had been successfully prepared.
 |
| | Fig. 1 FT-IR spectra of (a) chitosan, (b) Fe3O4, (c) TiO2, and (d) MCT. | |
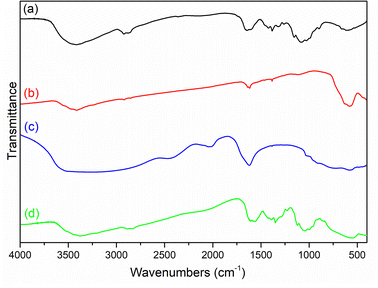
To characterize the surface micromorphology of the materials further, SEM images were obtained. Fig. 2(a) shows that chitosan possessed a compact and non-porous surface. It could be seen from Fig. 2(a) and (b) show that the MCT had a rougher surface with many bumps on it than the original chitosan. This indicated that MCT had been synthesized successfully.
 |
| | Fig. 2 SEM images of (a) chitosan and (b) MCT. | |
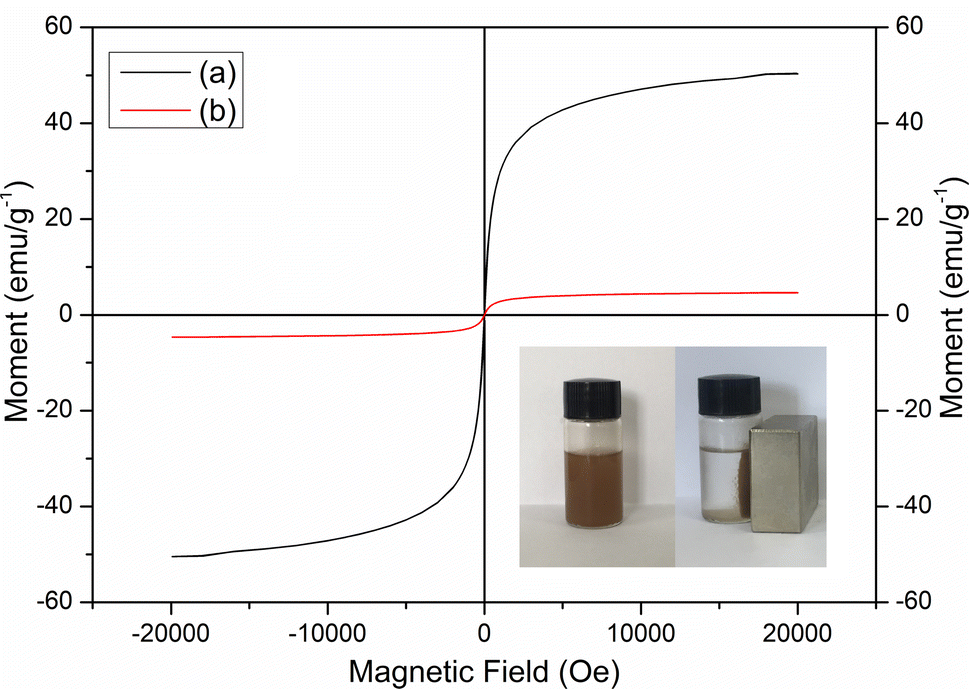
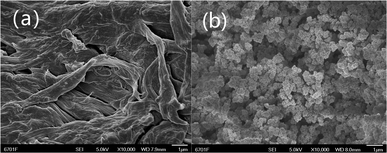
Fig. 3 shows the VSM spectra for Fe3O4 and MCT. The very weak hysteresis observed could infer that both Fe3O4 and MCT were nearly superparamagnetic.33 The saturation magnetization values of Fe3O4 and MCT were found to be 50.31 and 4.63 emu g−1, respectively. As seen in the picture, MCT was attracted to the walls of the vial and the supernatant became clear and transparent within 3 min by applying a strong magnet.
 |
| | Fig. 3 VSM spectra of (a) Fe3O4 and (b) MCT. | |
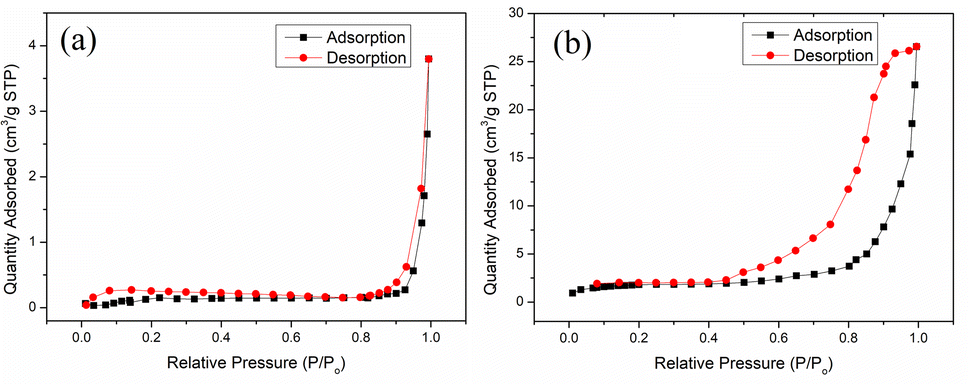
The surface area of the pores (SBET), pore volume (Vp), and pore size (Dp) of chitosan and MCT were analyzed by BET and BJH from the N2 adsorption isotherms using a surface area and porosity analyzer. Fig. 4 shows the nitrogen adsorption–desorption isotherms of chitosan and MCT, which displayed type II and type IV H2 (b) adsorption curves, respectively.34 This could indicate that MCT possessed a mesoporous structure and these pores were from the dense accumulation of spherical particles, which accorded with the SEM image.35 Moreover, Table 1 shows the SBET of MCT was 14.25 m2 g−1, the Vp was 0.041 cm3 g−1, and the Dp was 11.55 nm, which were much higher than the values for chitosan (0.52 m2 g−1, 0.0058 cm3 g−1, and 44.93 nm). This inferred that the TiO2-modified chitosan significantly increased the number of cavities of the original chitosan.
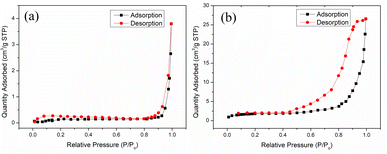 |
| | Fig. 4 N2 adsorption–desorption isotherms and pore-size distribution of (a) chitosan and (b) MCT. | |
Table 1 BET analysis parameters of chitosan and MCT
| Materials |
SBET (m2 g−1) |
Vp (cm3 g−1) |
Dp (nm) |
| Chitosan |
0.52 |
0.0058 |
44.93 |
| MCT |
14.25 |
0.041 |
11.55 |
Adsorption study
The solution pH in the range of 2–10 strongly affected the extent of vanadium adsorption onto the MCT composite (Fig. S1†). The adsorption capacity of vanadium increased in the pH range from 2.0 to 4.0. When the pH approached 2.0, the adsorption capacity was 53.4 mg g−1, because vanadium in the oxidation state occurred as VO2+, which showed a competitive adsorption effect to MCT.36 In the pH range of 2.5–0.0, vanadium(V) existed mainly as H3V2O7−, and as HVO24−, V3O93−, HVO42−, and HV2O73− for higher pH.37 At pH 4, the adsorption capacity of vanadium(V) was 105.3 mg g−1. The maximum adsorption due to the surface of MCT had a large number of Ti4+ ions, which via electrostatic attracted H3V2O7−. Afterwards, the adsorption capacity decreased slowly as the pH increased from 4 to 8, whereby the value decreased correspondingly from 105.3 to 96.7 mg g−1. Furthermore, the substantial decrease in adsorption of vanadium(V) at higher pH (8–10) values was due to these vanadium anions being affected by the adsorption capacity on MCT and the competitiveness from OH−.
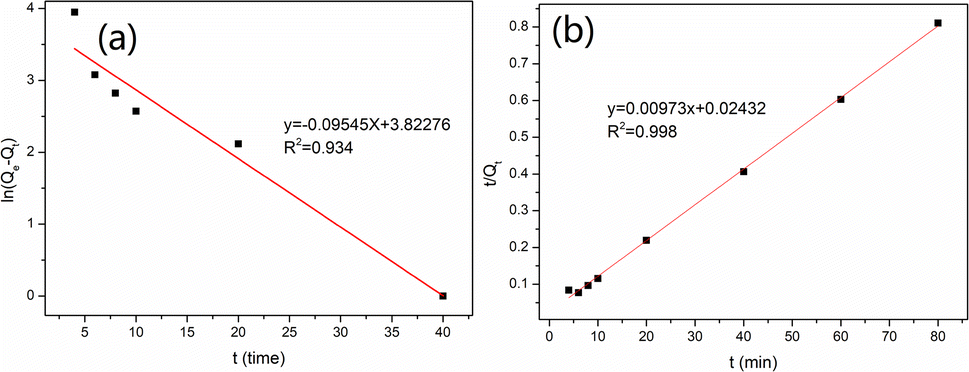
The adsorption kinetics of vanadium(V) onto MCT were also investigated, and the results are shown in Fig. S2.† It could be found the adsorption rate of MCT reached equilibrium in 40 min. Fig. 5(a) and (b) show that the pseudo-second-order kinetic model was more suitable for describing the MCT adsorption kinetic process. This indicated that MCT adsorption of vanadium(V) included not only physical diffusion but also chemical adsorption, with chemical adsorption the rate-limiting step in the adsorption of vanadium(V).
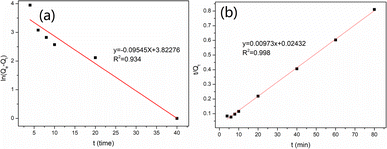 |
| | Fig. 5 (a) Pseudo-first-order kinetic curve and (b) pseudo-second-order kinetic curve of MCT for vanadium(V). | |
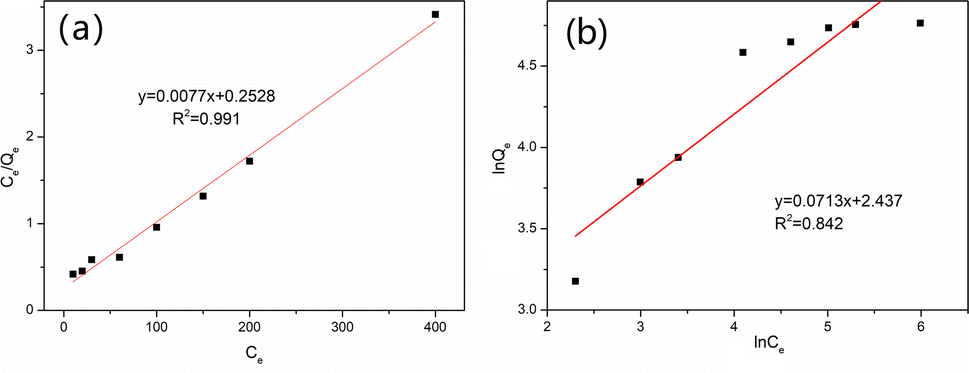
As shown in Fig. S3,† the uptake of vanadium(V) on MCT increased fast first and then slower. When the initial concentration increased up to 200 mg L−1, it reached equilibrium, and the maximum adsorption capacity was 117.1 mg g−1. To confirm the mechanism of vanadium(V) adsorption on MCT, the isotherm data were used for the Langmuir and Freundlich models. Fig. 6 shows the Langmuir isotherm was more suitable to describe the adsorption process (R2 = 0.991). Because the active sites on the adsorbent surface were homogeneous, the adsorption process was a chemical adsorption process.
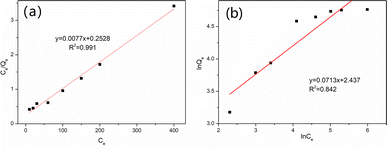 |
| | Fig. 6 (a) Langmuir isotherm and (b) Freundlich isotherm for vanadium(V) adsorption on MCT. | |
Repeatability study
In order to study the repeatability usage of MCT, cyclic adsorption and desorption experiments were used for vanadium(V) adsorption. Fig. S4† shows the maximum desorption rate was 87.6% under pH 13. The desorption experiments for MCT for vanadium(V) removal used 0.1 M sodium hydroxide solution. Fig. S5† shows that after 5 cycles, MCT still retained an adsorption capacity of 89.6 mg g−1 and desorption rate of 68.3%.
Reuse of the spent adsorbent study
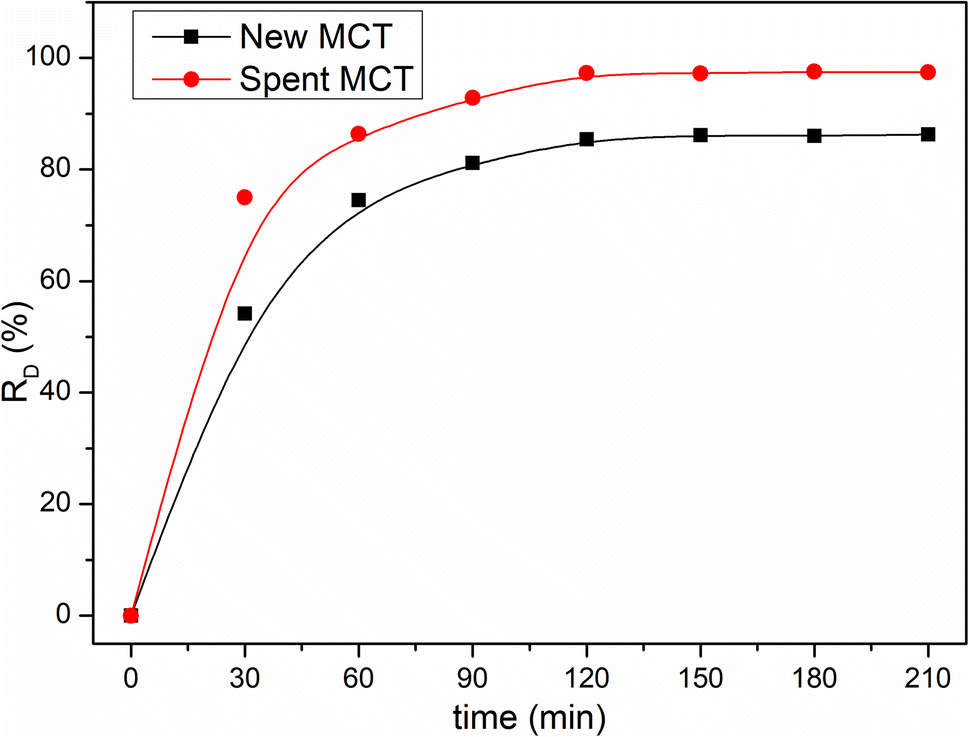
The reusability showed that MCT was a potential adsorbent for vanadium(V) adsorption. However, irrespective of the adsorbent, the declining desorption rate with the adsorbent's remaining metal ions inevitably limit the practical application. Recently, the recycling of heavy metal ions-loaded spent adsorbents as heterogeneous catalysts in organic synthesis has been considered an alternative option to potential solid wastes disposal. RhB as a dye is widely used in many industries, such as colored glass and special fireworks.38 However, RhB is poisonous and dangerous to human health, which could damage the lung, heart, and skin, even potentially leading to cancer.39 The treatment of industrial sewage containing RhB is a significant issue.
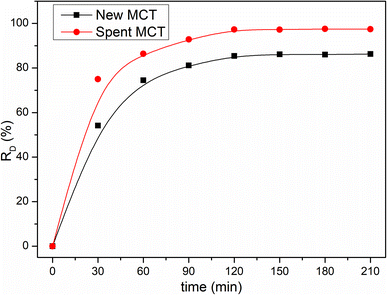
Many investigators have demonstrated that the photonic efficiency can be enhanced with e.g., Pt, Au, Ru, Ag, and Pd metal deposition onto TiO2, which could improve the photocatalytic activity.40–42 However, to the best of our knowledge, up to now, the application of ammonium metavanadate in the surface of TiO2 to enhance the photocatalytic activity has not been reported. Fig. 7 shows that the degradation performance of new MCT for RhB was unsatisfactory. The decolorization rate was only 85.4% for RhB in 120 min. Under the same conditions, the decolorization rate increased to 94.3% when using spent MCT. It could be seen that with the deposition of vanadium(V), the photocatalytic degradation performance and light stability performance were enhanced. Also noteworthy was the desorption of vanadium(V), which could pollute water. Hence, after the spent MCT was used for RhB degradation, the concentration of vanadium in the solution needed to be tested. Table 2 shows the discharge standard of vanadium(V) pollutants for a municipal wastewater treatment plant and the concentration of vanadium leakage.43 Clearly, it could be below the tighter vanadium(V) pollutants emissions standards.
 |
| | Fig. 7 Influence of the illumination time on the decolorization rate. | |
Table 2 Standard for the maximum allowable pollutant concentration from for a municipal wastewater treatment plant and the concentration of vanadium(V) leakage
| Vanadium(V) |
Maximum wastewater emission standard |
Vanadium(V) leakage |
| Concentration (mg L−1) |
2.0 |
0.34 |
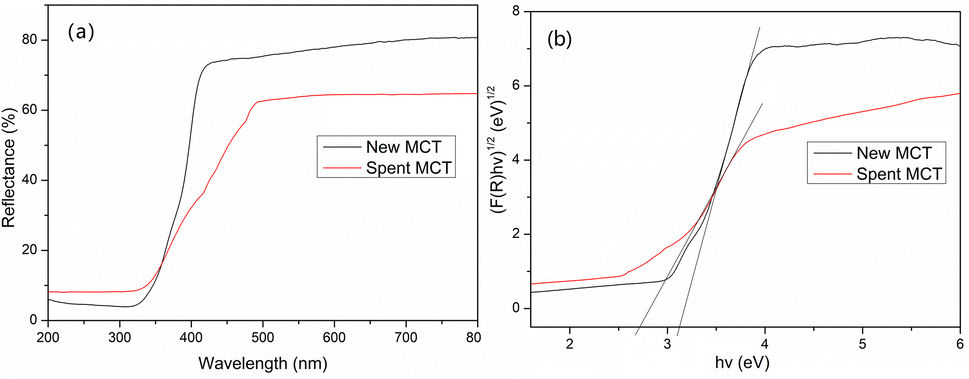
Fig. 8 shows the optical characteristics of these materials accordance to UV-vis diffuse reflectance spectroscopy. After the deposition of vanadium(V), the spent MCT presented a significant enhancement in the absorbance in the visible and ultraviolet bands. The new and spent MCT exhibited absorption bands at about 397 and 455 nm, respectively, indicating that the new MCT absorbed approximately in the purple light region, whereas spent MCT was red-shifted to the cyan light region. The forbidden bandwidth calculation method is described in the ESI.† The results indicated that the forbidden band widths of the new and spent MCT were about 3.12 and 2.72 eV, respectively.
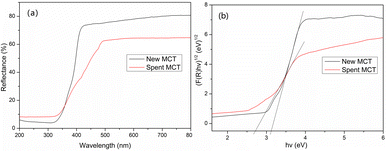 |
| | Fig. 8 (a) UV-DRS curves and (b) the corresponding band gaps of new and spent MCT. | |
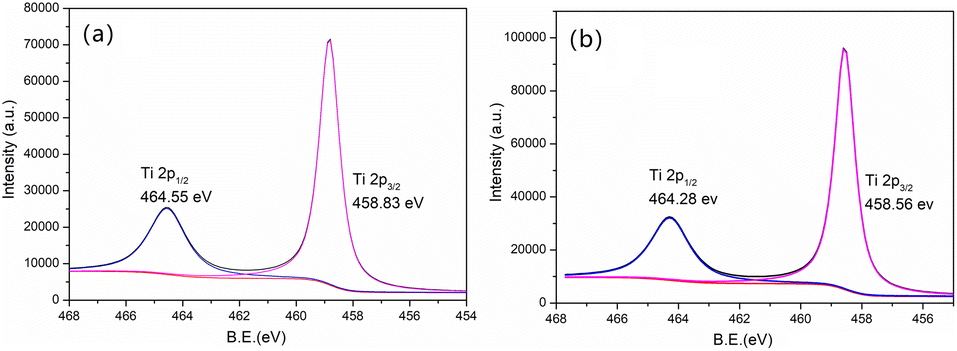
For the Ti 2p spectrum (Fig. 9) of new MCT, the Ti 2p1/2, Ti 2p3/2 peaks were at 464.55 and 458.83 eV, respectively, which indicated the Ti4+ stat.44 After the deposition of vanadium(V) of MCT, these two peaks decreased to 464.28 and 458.56 eV. The binding energy of Ti was thus decreased, which could indicate that the shielding effect was increased due to the valence electron density increasing, which inferred a strong interaction between vanadium(V) and TiO2.
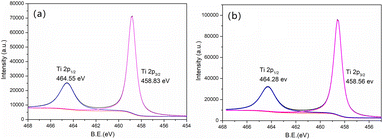 |
| | Fig. 9 XPS spectra of Ti 2p in the pristine (a) new and (b) spent MCT. | |
Scheme 1 shows the possible mechanism for the degradation reaction. First, spent MCT absorbed purple light of an energy greater than the band gap (2.72 eV, 455 nm) to generate hole (hvb+) and electron (ecb−) pairs.45,46 Then, path 1 showed that the holes were ultimately trapped with H2O on the spent MCT surface to generate OH˙ radicals and H+. In path 2, the electrons were captured by the photocatalyst and then reacted with oxygen to yield reactive oxygen species, such as O2˙−. At the same time, the O2˙− could also react with water to generate OH˙ (path 3). The involvement of these active species possibly served as oxidants in the photocatalyst-mediated photocatalytic oxidation of RhB.
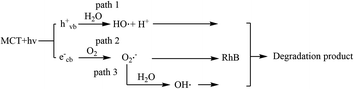 |
| | Scheme 1 Possible mechanism for the degradation reaction. | |
To identify the relative significance of the mechanism of the degradation reaction and also to confirm the nature of the oxidative species involved in the reaction, the photocatalytic oxidation of RhB was investigated by the use of additives (1 mmol) such as EDTA-2Na, BQ, IPA, or H2O2 and under a nitrogen or air atmosphere for 60 min. Fig. 10 shows the influence of the different conditions on the RD. The photocatalytic degradation of RhB was carried out in the presence of MCT by EDTA-2Na, a known hole scavenger.47 The presence of EDTA-2Na hindered the generation of holes to a certain extent, which led to hindering the formation of OH˙ radicals and the decrease of RD from 86.4% to 77.4% (path 1). BQ, an O2˙−-radicals scavenger, could block the formation of superoxide anion radicals.48 When BQ was added, the RD dropped to 33.2%. This inferred that the superoxide anion radicals played an important role in the photocatalytic degradation of RhB. As the O2˙− not only could degrade RhB directly, but could also form OH˙ radicals, identifying which oxidative species contributed more to the reaction was necessary. IPA, an excellent scavenger of OH˙, completely inhibited RhB transformation in the spent MCT system, indicating the degradation predominantly occurred by OH˙, and the RD was 12.6%.49 The degradation of RhB by O2˙− was estimated to be negligible. To test this, the photocatalytic degradation reaction was carried out in the presence of spent MCT by bubbling nitrogen in a closed reactor. The results indicated that the RD was 15.5%. The reaction without oxygen led to OH˙, which could not be generated by O2˙−; however, the hydroxyl radicals still could be formed by holes. Therefore, the RD rose slightly. H2O2, an electron scavenger, accepted an ecb− from the conduction band, thus preventing electron–hole recombination forming OH˙ radicals.50 Moreover, photons from the radiation sources facilitate the decomposition of H2O2 and forming OH˙.51 When in the presence of H2O2 and bubbling nitrogen in the conditions of the seal, the RD was raised from 86.4% to 88.5%. This allowed concluding that hydrogen peroxide increased the hydroxyl radical formation, thereby increasing the decolorization rate, and confirming the participation of hydroxyl radicals in the photocatalytic reaction. These experiments clearly demonstrated that the hydroxyl radicals as oxidants in the spent MCT mediated the photocatalytic degradation of RhB. In addition, the superoxide anion radicals forming hydroxyl radicals (path 3) was the primary reaction, while the holes generating hydroxyl radicals (path 1) was the subordinate reaction.
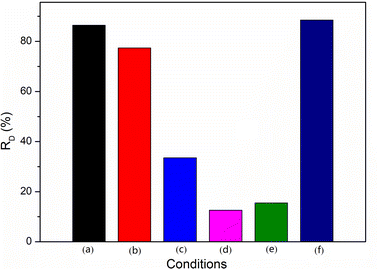 |
| | Fig. 10 Influence the different conditions on the RD: (a) no additives, (b) extra EDTA-2Na, (c) extra BQ, (d) extra IPA, (e) no additives and in N2 atmosphere, and (f) extra H2O2 and in N2 atmosphere. | |
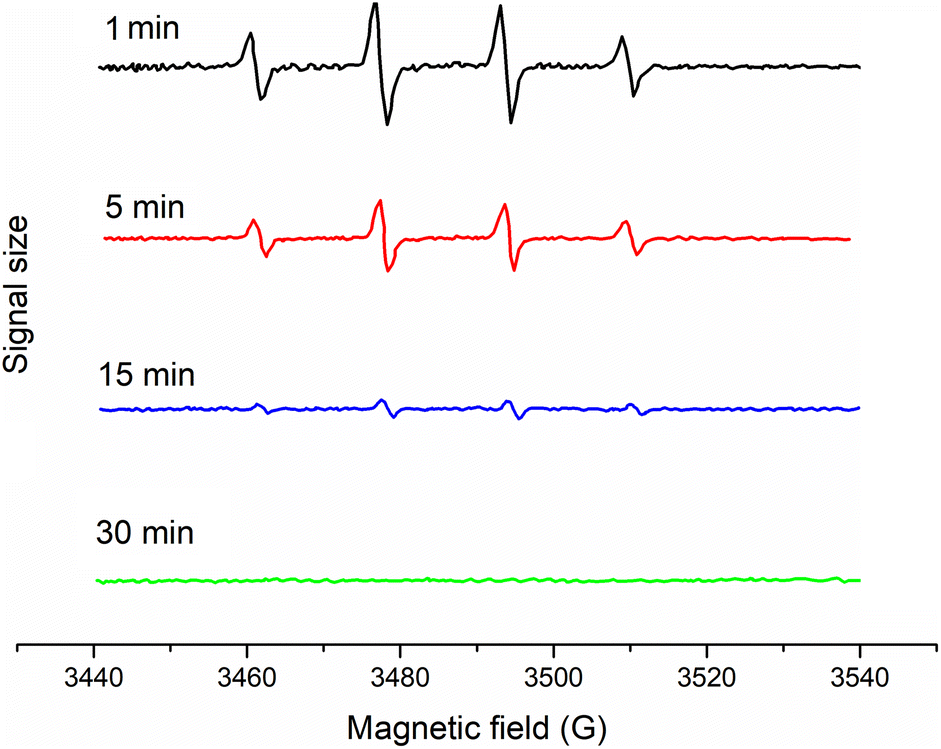
For further confirming the radicals, EPR spin-trapping techniques were used to study the generation of reactive paramagnetic intermediates upon irradiation. A spin-trapping agent DMPO was used in order to detect the reactive species. These results demonstrated that the EPR signal of the typical DMPO-OH˙ adducts could be clearly observed (Fig. 11). Also, given time, the intensity became lower. However, the DMPO-O2˙− adducts had not yet been found. The appearance of DMPO-OH˙ adducts instead of DMPO-O2˙−was because the DMPO2˙− adduct was a short-lived adduct and could be easily reduced to the DMPO-OH˙ adduct.52
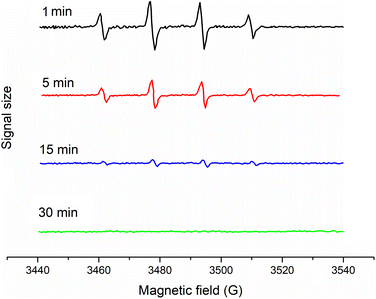 |
| | Fig. 11 EPR spectra for radicals determination with 5,5-dimethyl-L-pyrroline N-oxide (DMPO) used as a spin-trapper. | |
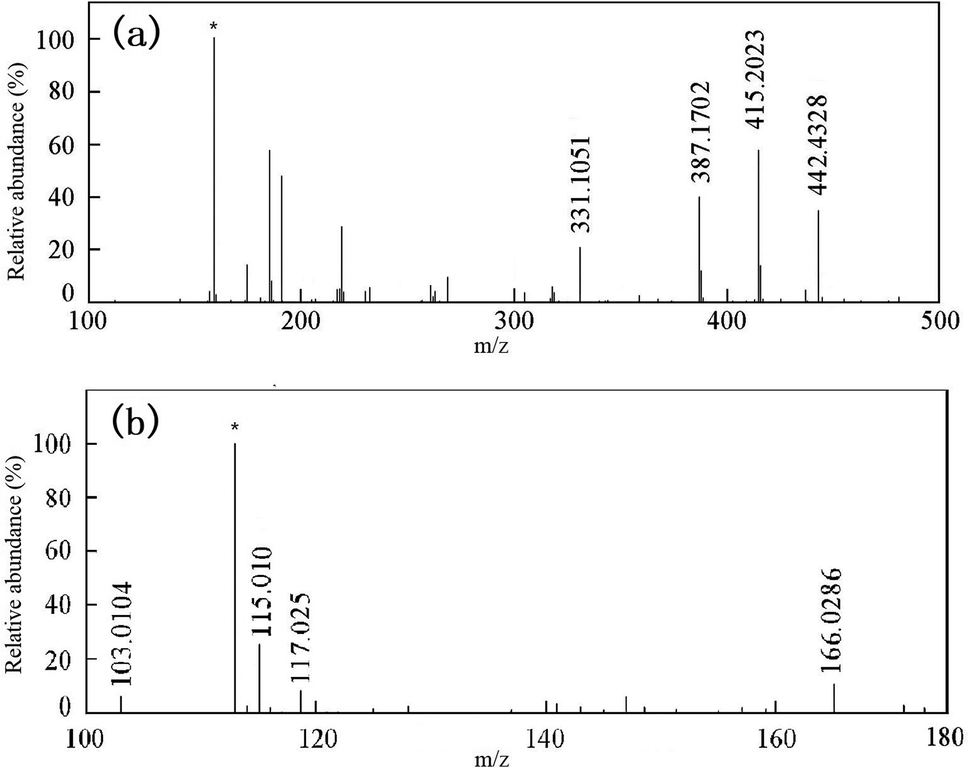
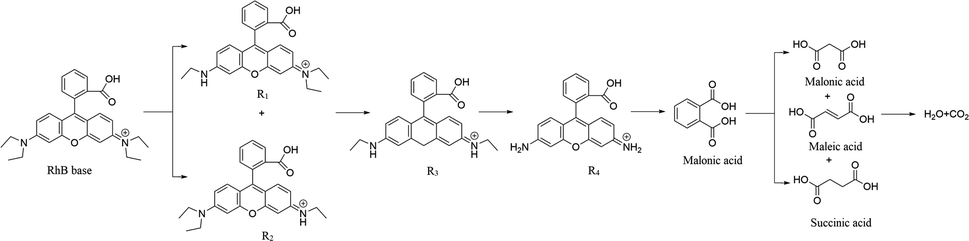
MS was used to analyze the mixed products after degradation. The compound was ionized by electrospray ionization (ESI). Fig. 12 and Table 3 show the results for the intermediate products of the degradation. Then, HPLC was used to further analyze the products after degradation.
 |
| | Fig. 12 ESI-MS spectra of RhB and intermediates: (a) ESI+ and (b) ESI−. * represents the background ions. | |
Table 3 Intermediate products from the photocatalytic reaction of rhodamine B
| Compound |
m/z |
| Calculated |
Experiment |
Molecular formula |
| RhB base |
442.5500 |
442.4328 |
C28H31O3N2 |
| R1/R2 |
415.2016 |
415.2023 |
C26H27O3N2 |
| R3 |
387.1703 |
387.1702 |
C24H23O3N2 |
| R4 |
331.1077 |
331.1051 |
C20H15O3N2 |
| Phthalic acid |
166.0263 |
166.0286 |
C8H6O4 |
| Succinic acid |
117.0261 |
117.0257 |
C4H6O4 |
| Maleic acid |
115.0104 |
115.0106 |
C4H4O4 |
| Malonic acid |
103.0104 |
103.0104 |
C3H4O4 |
The MS results showed that RhB dechloride ion was RhB base (m/z 442.4328). The intermediate products were detected in the positive ion detection mode, and were N,N-diethyl-N-ethylrhodamine (R1 and R2 were isomers, m/z = 415.2023), N-ethyl-N-ethylrhodamine (R3, m/z = 387.1702), and rhodamine (R4, m/z = 331.1051). These intermediates were all formed by de-ethylation. The intermediates were detected in the negative ion detection mode, and were malonic acid (m/z = 166.0286), succinic acid (m/z = 117.0257), maleic acid (m/z = 115.0106), and malonic acid (m/z = 103.0104). There intermediates were confirmed by HPLC identification (discussed below).
HPLC spectra of the RhB solutions and their photocatalytic degradation products at different irradiation intervals are shown in Fig. 13. Peak 1 was the initial RhB dye (peak 1), and peaks 2–5 were the N-de-ethylated intermediates. Peaks 6–8 were small molecule organic acids. Considering the polarity of RhB and its N-de-ethylated intermediates, peaks 1 (tR 10.66 min), 2 (tR 9.19 min), 3 (tR 7.55 min), and 4 (tR 5.92 min) were the initial RhB dye, N,N-diethyl-N′-ethylrhodamine (R1), N,N-diethylrhodamine (R2), N-ethylrhodamine (R3), and rhodamine (R4), respectively. Peaks 5 (tR 4.53 min), 6 (tR 2.82 min), 7 (tR 1.92 min), and 8 (tR 1.60 min) were phthalic acid, succinic acid, maleic acid, and malonic acid, respectively. Furthermore, Fig. S7† shows the variations of the intermediates from the degradation of RhB at different irradiation intervals measured by the HPLC peak area. The final products mainly were small molecule organic acids, which were most probably the small molecule acid intermediates resulting from the fission of the xanthene ring in RhB.
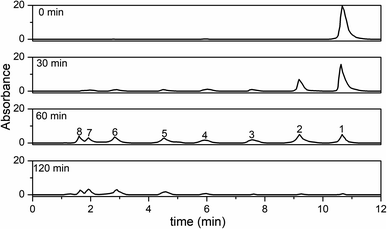 |
| | Fig. 13 HPLC chromatograms of the intermediates at different irradiation time intervals. | |
Scheme 2 shows the presumed degradation mechanism of RhB. A discovered intermediate product in the degradation process of RhB allowed this presumption of the reaction mechanism of RhB. The proposed generation pathway is that the RhB undergoes a N-de-ethylation, chromophore cleavage and opening-ring process to generate small molecule intermediates, which further react to generate H2O and CO2 by mineralization.
 |
| | Scheme 2 Speculated degradation mechanism of RhB. | |
Conclusions
In conclusion, MCT was successfully synthesized by a one-pot method using chitosan, TiO2, and Fe3O4. The absorption time of MCT was 40 min for absorbing vanadium(V). The optimal adsorption pH was 4 and the maximum adsorption capacity of vanadium(V) was 117.1 mg g−1. When the pH was 13, the desorption rate was 87.6%. After 5 adsorption/desorption cycles, the maximum adsorption capacity and desorption rate were shifted to 89.6 mg g−1 and 68.3%, respectively. The decolorization rates for the degradation of RhB by new and spent MCT were 85.4% and 94.3%, respectively. The new and spent MCT exhibited absorption bands at 397 and 455 nm, respectively, which showed that new MCT absorbed approximately in the purple light region, whereas spent MCT was red-shifted to the cyan light region. These results indicated that the forbidden band widths of the new and spent MCT were about 3.12 and 2.72 eV, respectively. The mechanism for the degradation reaction showed that the hydroxyl radicals as oxidants in the spent MCT mediated the photocatalytic degradation of RhB. In addition, the main reaction was the formation of hydroxyl radicals by superoxide anion radicals, while the holes generated hydroxyl radicals in the subordinate reaction. These radicals were confirmed by EPR analysis. The mixed products after degradation were analyzed by MS and HPLC, and mainly included N,N-diethyl-N-ethylrhodamine, N-ethyl-N-ethylrhodamine, rhodamine, malonic acid, succinic acid, maleic acid, and malonic acid. The photocatalytic degradation mechanism included N-de-ethylation, chromophore cleavage, opening-ring, and mineralization processes.
Author contributions
Jun Zhang: investigation, experiment and writing – original manuscript. Jun Zhang, Xuxu Wei, Zifan Zhang, and Caixia Yuan: funding acquisition, manuscript revision. Ting Huo and: formal analysis. Fangfang Niu, Xiaoyu Lin and Chun li Liu: writing–review and editing. Hui Li: methodology. Zhenbin Chen: supervision and experimental guidance.
Conflicts of interest
There are no conflicts to declare.
Acknowledgements
This work was supported by the National Natural Science Foundation, China (Grant: 51061009), Shenyang National Laboratory for Materials Science and State Key Laboratory of Advanced Processing and Recycling of Nonferrous Metals (18LHZD003 and 18LHPY004). Natural Science Foundation of Gansu Province, China (No: 22JR5RA227).
Notes and references
- A. Landa, P. Söderlind, I. I. Naumov, J. E. Klepeis and L. Vitos, Computation, 2018, 6, 29 CrossRef CAS.
- E. Ghasali, T. Ebadzadeh, M. Alizadeh and M. Razavi, Ceram. Int., 2018, 44, 10646–10656 CrossRef CAS.
- T. Muroga, J. M. Chen, V. M. Chernov, R. J. Kurtz and M. Le Flem, J. Nucl. Mater., 2014, 455, 263–268 CrossRef CAS.
- S. M. Han, T. Bozorg-Grayeli, J. R. Groves and W. D. Nix, Scr. Mater., 2010, 63, 1153–1156 CrossRef CAS.
- T. Nagasaka, T. Muroga, M. L. Grossbeck and T. Yamamoto, J. Nucl. Mater., 2002, 307, 1595–1599 CrossRef.
- R. R. Moskalyk and A. M. Alfantazi, Miner. Eng., 2003, 16, 793–805 CrossRef CAS.
- P. Tartaj, C. J. Serna and M. Ocaña, Polym. Int., 2010, 59, 1282–1288 CrossRef.
- V. S. de Souza, L. Sena Gomes Teixeira, J. Sthefane, S. O. Lima, U. M. Ferreira da Mata Cerqueira, O. M. Cordeiro de Oliveira, A. F. de Souza Queiroz and M. Almeida Bezerra, Appl. Spectrosc. Rev., 2020, 55, 128–157 CrossRef.
- P. Tartaj, C. J. Serna and M. Ocaña, J. Am. Ceram. Soc., 2010, 78, 1147–1152 CrossRef.
- J. Zhang, R. T. Wang, X. J. Ou, X. Y. Zhang, P. Liu, Z. C. Chen, B. Y. Zhang, C. L. Liu, S. Y. Zhao, Z. B. Chen, J. N. Zhu, S. J. Lu and P. Zhang, Sep. Purif. Technol., 2021, 59, 118165 CrossRef.
- J. Hu, X. Wang, L. Xiao, S. Song and B. Zhang, Hydrometallurgy, 2009, 95, 203–206 CrossRef CAS.
- J. Zhang, M. Wang, W. L. Peng, Z. C. Chen and Z. B. Chen, ACS Omega, 2020, 5, 13777–13784 CrossRef CAS PubMed.
- X. Y. Zhang, W. W. Jia, D. H. Li, C. L. Liu, R. T. Wang, K. Li, H. Li, Z. B. Chen, Y. Sun and Z. Liu, J. Polym. Res., 2020, 27, 201 CrossRef CAS.
- H. H. Kyaw, M. Myint, S. Al-Harthi and M. Al-Abri, J. Hazard. Mater., 2019, 385, 121565 CrossRef PubMed.
- T. N. Dong, N. T. Hai, R. S. Juang, N. D. Dat and H. P. Chao, J. Environ. Chem. Eng., 2020, 8, 104408 CrossRef.
- A. Dabizha and M. Kersten, Appl. Geochem., 2020, 123, 104785 CrossRef CAS.
- C. Wang, C. Xiong, Y. He, C. Yang and S. Wang, Chem. Eng. J., 2021, 415, 128923 CrossRef CAS.
- M. Açıkyıldız, A. Gürses and S. Karaca, Microporous Mesoporous Mater., 2014, 198, 45–49 CrossRef.
- N. M. Serour, A. H. ElShazly, D. A. El-Gayar and S. A. Nosier, Can. J. Chem. Eng., 2021, 1–15 Search PubMed.
- A. Mojumdar, A. K. Upadhyay, V. Raina and L. Ray, J. Microbiol. Methods, 2019, 158, 66–70 CrossRef CAS PubMed.
- Y. Ouyang, J. Deng, Z. Chen, L. Yang, S. Xiao, L. Wang and Y. L. Zhao, J. Radioanal. Nucl. Chem., 2020, 326, 1699–1708 CrossRef CAS.
- M. Xie, S. L. Luo, Y. Li, L. Lu, C. Deng and Y. Cheng, RSC Adv., 2019, 9, 12010–12019 RSC.
- E. Vunain, A. Mishra and B. Mamba, Int. J. Biol. Macromol., 2016, 86, 570–586 CrossRef CAS PubMed.
- R. S. Vieira and M. M. Beppu, Water Res., 2006, 40, 1726–1734 CrossRef CAS PubMed.
- R. Das, S. Giri, A. M. Muliwa and A. Maity, ACS Sustainable Chem. Eng., 2017, 5, 7524–7536 CrossRef CAS.
- P. Fang, W. Z. Xia, Y. Q. Zhou, Z. Y. Ai, W. Y. Yin, M. G. Xia, J. X. Yu, R. Chi and Q. Y. Yue, Chem. Eng. J., 2020, 385, 123847 CrossRef CAS.
- X. Y. Zhang, X. J. Ou, J. Zhang, Z. C. Chen, C. L. Liu, H. Li, X. M. Li, Y. Sun, Z. B. Chen, J. N. Zhu, S. J. Lu and P. Zhang, J. Hazard. Mater., 2021, 417, 126072 CrossRef CAS PubMed.
- A. E. Morales, E. S. Mora and U. Pal, Rev. Mex. Fis., 2007, 53, 18–22 CAS.
- M. R. Dolgos, A. M. Paraskos, M. W. Stoltzfus, S. C. Yarnell and P. M. Woodward, J. Solid State Chem., 2009, 182, 1964–1971 CrossRef CAS.
- G. Y. Li, Y. R. Jiang, K. L. Huang, D. Ping and C. Jie, J. Alloys Compd., 2008, 466, 451–456 CrossRef CAS.
- A. El-Reash and A. Gaber, J. Environ. Chem. Eng., 2016, 4, 3835–3847 CrossRef.
- N. Yang, Y. Liu, H. Wen, Z. Tang, H. Zhao, Y. Li and D. Wang, ACS Nano, 2013, 7, 1504–1512 CrossRef CAS PubMed.
- G. Liu, T. Li and X. Yang, Carbohydr. Polym., 2016, 137, 75–81 CrossRef CAS PubMed.
- M. Khalfaoui, S. Knani, M. A. Hachicha and A. B. Lamine, J. Colloid Interface Sci., 2003, 263, 350–356 CrossRef CAS PubMed.
- N. S. C. Zulkifli, I. Ab Rahman, D. Mohamad and A. Husein, Ceram. Int., 2013, 39, 4559–4567 CrossRef CAS.
- M. T. Wright, K. G. Stollenwerk and K. Belitz, Appl. Geochem., 2014, 48, 41–52 CrossRef CAS.
- X. P. Liao, W. Tang, R. Q. Zhou and B. Shi, Adsorption, 2008, 14, 55–64 CrossRef CAS.
- Z. Sun, X. Duan, C. Srinivasakannan and J. S. Liang, RSC Adv., 2018, 8, 7873–7882 RSC.
- X. Zhu, G. Wu, C. Wang, D. Zhang and X. Yuan, Measuremen, 2018, 120, 206–212 Search PubMed.
- E. Bae and W. Choi, Environ. Sci. Technol., 2003, 37, 147–152 CrossRef CAS PubMed.
- S. Sakthivel, M. V. Shankar, M. Palanichamy, B. Arabindoo, D. W. Bahnemann and V. Murugesan, Water Res., 2004, 38, 3001–3008 CrossRef CAS PubMed.
- K. Alamelu and B. M. J. Ali, Appl. Surf. Sci., 2020, 512, 145629 CrossRef CAS.
- Ministry of eclogy and environment of the People's Republic of China, GB 18918-2002, Discharge standard of pollutants for
municipal wastewater treatment plant, Standards Press of China, Beijing, 2002 Search PubMed.
- L. Fu, N. Li, Y. Liu, W. Wang, Y. Zhu and Y. Wu, Chin. J. Chem., 2017, 35, 13–20 CrossRef CAS.
- F. Chen, W. Yu, Y. Qie, L. Zhao, H. Zhang and L. H. Guo, Chem. Eng. J., 2019, 373, 58–67 CrossRef CAS.
- Q. Guo, C. Zhou, Z. Ma and X. Yang, Adv. Mater., 2019, 31, 1901997 CrossRef CAS PubMed.
- X. M. Cheng, L. H. Zu, Y. Jiang, D. L. Shi, X. M. Cai, Y. H. Ni, S. J. Lin and Y. Qin, Chem. Commun., 2018, 54, 11622–11625 RSC.
- E. E. El-Katori, M. A. Ahmed, A. A. El-Bindary and A. M. Oraby, J. Photochem. Photobiol., A, 2020, 392, 112403 CrossRef CAS.
- S. Hwang, S. G. Huling and S. Ko, Chemosphere, 2010, 78, 563–568 CrossRef CAS PubMed.
- M. R. Hoffmann, S. T. Martin, W. Choi and D. W. Bahnemann, Chem. Rev., 1995, 95, 69–96 CrossRef CAS.
- A. Fujishima, X. Zhang and D. A. Tryk, Surf. Sci. Rep., 2008, 63, 515–582 CrossRef CAS.
- G. R. Buettner and L. W. Oberley, FEBS Lett., 1980, 121, 161–164 CrossRef CAS PubMed.
|
| This journal is © The Royal Society of Chemistry 2023 |
Click here to see how this site uses Cookies. View our privacy policy here. 
 Open Access Article
 This Open Access Article is licensed under a Creative Commons Attribution-Non Commercial 3.0 Unported Licence
 *ab
*ab