 Open Access Article
Sr doped TiO2 photocatalyst for the removal of Janus Green B dye under visible light
SP. Keerthanaa,
R. Yuvakkumar *a,
G. Raviab,
M. Thambidurai
 c,
Hung D. Nguyenc and
Dhayalan Velauthapillai
 d
d
aDepartment of Physics, Alagappa University, Karaikudi 630 003, Tamil Nadu, India. E-mail: yuvakkumarr@alagappauniversity.ac.in
bDepartment of Physics, Chandigarh University, Mohali 140 413, Punjab, India
cSchool of Electrical and Electronic Engineering, Nanyang Technological University, 50 Nanyang Avenue, 639798, Singapore
dFaculty of Engineering and Science, Western Norway University of Applied Sciences, Bergen 5063, Norway
First published on 21st June 2023
Abstract
Hydrothermal synthesis of pristine and Sr doped TiO2 is proposed. The synthesized products were studied for their physiochemical properties. 3% Sr-TiO2 showed a narrow bandgap, which facilitate an increase in oxygen vacancies. The agglomerated morphology was tuned to a nanoball structure after doping with Sr ions. Surface area was increased for the Sr doped TiO2. The samples were used to reduce Janus Green B (JG) dye as a model pollutant. The pure TiO2 showed poor efficiency, while the prepared Sr-TiO2 photocatalyst showed enhanced efficiency with a corresponding increase in the rate constant values of the samples. Tuning of the bandgap, an improvement in the morphology and an increase in the surface area were the major positives of the Sr doped TiO2 samples compared to pure TiO2, 3% Sr-TiO2 is emerging as the best photocatalyst in reducing toxic pollutants. The 3% Sr-TiO2 is a promising candidate for water remediation in the future.
1. Introduction
Owing to the rapid industrial revolution, the level of pollution has also increased at a high rate. With the increase in the population and production, the industries were developed to meet the demand of the growing population. The growth of industries has resulted in an increase in the pollution. Without proper discharge of effluents, industries end up dumping organic matter into the environment.1 The large-scale pollutants are released by textile industries. The unused dyes containing inorganic substances that are highly carcinogenic and teratogenic to living beings are directly discharged into nearby water resources.The dyes are comprised of aromatic chain compounds that are mutagenic in nature. Reducing the colour by the biodegradation of these compounds is a good approach for wastewater management.2 India is the second largest producer and exporter of textile fabrics in the world. There is the greatest scare for water source in India. The real time removal of dyes from wastewater is difficult as industries do not share their original ingredients.3 Many processes, such as electrofiltration,4 nanofiltration,5 electrocoagulation,6 Fenton reaction,7 ozonation,8 and reduction,9 are available for the removal of organic compounds from water. Advanced oxidation processes (AOPs) are fascinating invention for reducing pollutants from wastewater.10 Photocatalysis is a potential process for water remediation. The eco-friendly nature of photocatalysts is an added advantage to heterogeneous photocatalysis. The bandgap and morphology of the photocatalyst must be modified for a high potency in absorbing sunlight, which will be cost-effective and result in a greater reduction of dye molecules.11 Janus Green B dye is an organic compound that has wide application in industries and research. However, the dye consists of chemicals that cause unwanted effects on the environment.12 The toxicity produced by this dye has been a great challenge to the environment, thus it was chosen as the model pollutant for the degradation study using Sr-TiO2.
TiO2 is considered an inherent photocatalyst and has been extensively studied for the degradation of dyes and the reduction of organic compounds. TiO2 is already in use in photocatalysis as it is the first material to be identified as a photocatalyst. TiO2 has excellent chemical and physical properties, which are suitable for mineralizing dyes at improved reaction rates. Due to the wide bandgap of TiO2, some chemical modifications like doping and the addition of carbon-based materials have been studied to reduce the bandgap and to make it work efficiently under visible light.13 The doping of transition and alkaline earth metals into TiO2 particularly amends the electronic structure and reduces the bandgap of TiO2, which then alters the rate of recombination on photoexcitation. It also enhances the photo absorbing property of TiO2.14 Strontium is used as the dopant to alter the inherent properties of TiO2. TiO2 can be produced by employing co-precipitation, sol–gel, hydrothermal, organometallic route, green production, hydrolysis, and microwave assisted routes. Hydrothermal route, which has been reported as a better approach, was followed in this study. The optimal conditions of the synthesis route result in an improved morphology and a higher surface area.15
Bingbing Quan et al. produced Ni-TiO2 through a green hydrothermal route, which reduced methylene blue (MB) dye with 93% efficiency under solar light irradiation for 60 min.16 Divyalakshmi et al. fabricated Ni and S co-doped TiO2 and degraded Bismarck brown red with 96% efficiency under visible light irradiation for 110 min.17 Shafei et al. prepared Cu doped TiO2 by a ball milling method and investigated the reduction of MB dye and achieved 66% efficiency under visible light irradiation for 120 min.18 Anju Rani et al. produced Sr2+ doped TiO2 via the hydrothermal route and used 0.2 mol% Sr-TiO2 for the reduction of Congo red dye with 64% efficiency.19 The concept of the doped catalyst has been studied extensively over the years, and Sr2+ doped TiO2 was produced to effectively reduce Congo red dye. Mohd Shkir et al. produced Sr-ZnO nanoparticles by a one-pot flash combustion technique and reduced MB dye completely using black light.20
In this study, we report the synthesis of Sr-TiO2 via hydrothermal method. The synthesized nanoparticles were studied using XRD, UV-vis spectroscopy, Raman spectroscopy, FTIR spectroscopy, SEM, and BET analyses for the characterization of the structure, vibrational modes, optical properties, morphology, and surface area of the pristine and doped samples. The photocatalytic properties of the samples in the removal of toxic pollutants were investigated. Janus Green B dye was used as the model pollutant and was degraded under visible light. By comparing the results with previous literature reports on reducing Janus Green B dye, it was found that the photocatalyst in this study was more efficient and reached maxima in 2 h; further, the kinetics of the reaction were examined.
2. Experimental
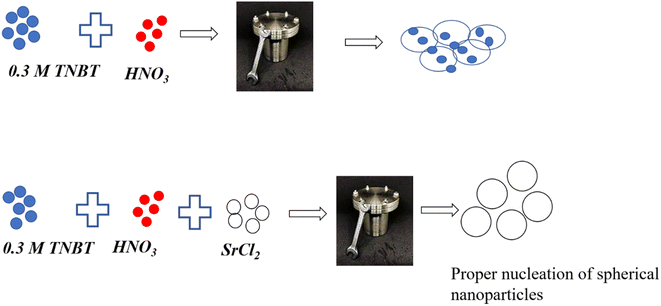
Tetra-n-butyl orthotitanate (TNBT), strontium chloride hexahydrate, and Janus Green B dye were purchased from Sigma-Aldrich. Acetone and methanol were procured from Thermo Fisher Scientific Pvt. Ltd. Nitric acid was purchased from Nice chemicals. Distilled water and Whatman filter paper of laboratory grade were used in this synthesis. Fig. 1 shows the scheme of nanoparticle synthesis. 0.3 M TNBT was dissolved in 60 mL DI water and stirred for 15 min to get a homogenous solution. After this, 1 mL HNO3 98% concentration was added slowly to the above-mentioned solution. The mixture was stirred using a magnetic stirrer for 1 h. The resultant white solution was moved to a 100 mL Teflon lined autoclave and kept inside a furnace at 180 °C for 12 h. The 0.01 M and 0.03 M Sr doped TiO2 was synthesized by the inclusion of 0.01 M and 0.03 M of SrCl2 suspended in 10 mL DI water separately and added to TiO2 solution separately and kept it for hydrothermal action. The obtained precipitate was filtered and washed with DI water, acetone, methanol, and ethanol 3 times to remove the impurities. The filtered products were dried at 80 °C for 12 h. The samples were ground using a mortar and pestle and annealed at 600 °C for 6 h. The white samples were further characterised for the analysis of their physio-chemical properties.2.1. Characterisation techniques
The structural information was collected using a PANalytical/X Pert powder X-ray diffractometer. The vibrational modes were examined using a Thermo Nicolet 380 FTIR spectrophotometer. The optical properties were analyzed using an Ocean optics HR2000 spectrometer. The morphology of the samples was characterized using a Carl Zeiss EVO-18 scanning electron microscope. The surface area was analyzed using a Quantachrome Nova 2200e surface area and pore size analyzer.2.2. Photocatalytic activity
The obtained products were tested using Janus Green B (JG) dye as a model pollutant. To prepare the stock solution, 0.01 mole dye was dissolved in 100 mL DI water and stirred in the dark for 3 h to reach maximum adsorption and desorption. Pure dye sample was prepared by adding 2 mL stock solution to 48 mL DI water and stirred in the dark for 30 min. For the catalyst appended dye sample, 0.1 g of catalyst was first added to DI water and sonicated for 15 min. Then, 2 mL of the dye solution was added and stirred in the dark. The solutions were transferred to glass tubes and placed vertically to 300 W tungsten visible lamps. Water was circulated continuously to reduce the heat liberated by the light. The temperature was maintained at 24 °C. The photocatalytic action of the obtained product was performed in an annular photoreactor. The distance from the light to the sample was 12 cm. A visible light source was used 2 mL aliquots of the samples were collected at 15 min intervals and were examined by UV-vis spectroscopy.3. Results and discussion
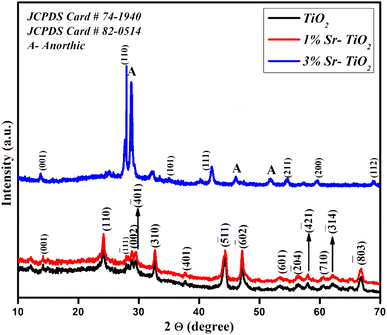
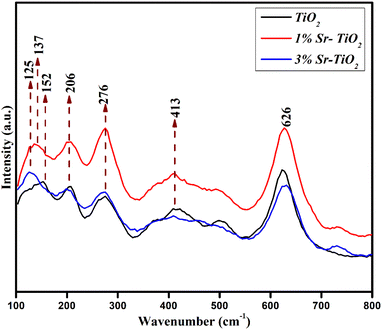
The structure of the pristine, 1% Sr-, and 3% Sr-TiO2 were investigated by XRD studies (Fig. 2). The patterns were well matched with standard JCPDS card # 74-1940 and 82-0514 refers to the TiO2 with a tetragonal primitive lattice, and an anorthic crystal structure was also identified as the minor phase.21,22 The crystallite size was estimated from the Debye–Scherrer equation and the obtained values were 32 nm, 24 nm, and 18 nm for the pristine TiO2, 1% Sr-TiO2, and 3% Sr-TiO2, respectively. The crystallite size reduced with the addition of the dopant and it further reduced with the increase in the dopant percentage. On incorporating the dopant Sr into the TiO2 lattice, the lattice strain and crystal size decreased. The doped Sr ions reduced the size of the crystals, which was also confirmed from literature.23 For the metal ion doped catalyst, the oxide corresponding to the metal ions should not be detected in the doped catalyst, and the metal ions should immerse into the lattice of the original catalyst to change its crystal structure. Once the metal oxide is detected by XRD or other characterization techniques, the composite catalyst can be called a heterojunction, such as the as-prepared 3% Sr-TiO2.The Raman spectra of the samples demonstrate seven characteristic Raman modes identified at 125, 137, 152, 206, 276, 413, and 626 cm−1 (Fig. 3). The bands at 125 and 137 cm−1 were due to strong Ti–Ti interactions.24 The peak at 152 cm−1 was attributed to the anatase phase of TiO2. The bands at 206 and 276 cm−1 were assigned to the Eg and B1g modes of anatase TiO2, respectively.25,26 The wide band at 413 cm−1 and sharp band at 626 cm−1 were attributed to the B1g mode of anatase TiO2 and Eg of rutile TiO2.27
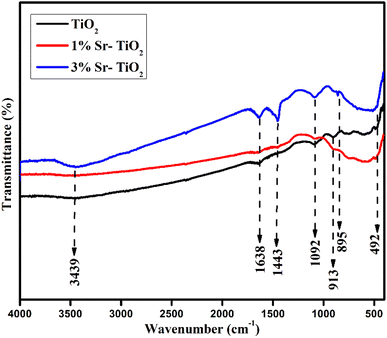
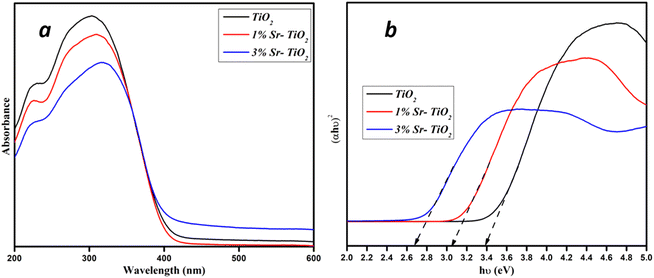
The infrared spectra of pristine and Sr-TiO2 samples showed the stretching vibrations of Ti–O (∼492 cm−1), Ti–O–Ti bonds (∼895 cm−1), carbonate (∼1443 cm−1), and O–H bonds (∼1638 cm−1), which corresponded to the adsorbed water during synthesis (Fig. 4).28 The peaks at 1092 and 3439 cm−1 were due to the stretching vibrations of C–O and O–H bonds. The peak at 913 cm−1 revealed a Ti–O bond.24,29 The absorption spectra and the bandgap of pristine and Sr doped TiO2 were analysed by UV-vis spectra, as shown in Fig. 5(a) and (b). The broad absorption from 350 to 400 nm showed a high activity of the photocatalyst, which correlates with the previous literature.30 The bandgap was estimated using Tauc plot. The pristine TiO2 showed a bandgap value of 3.4 eV, as reported in literature.31 For the 1% Sr-TiO2 and 3% Sr-TiO2 photocatalysts, the calculated bandgap values were 3.05 eV and 2.68 eV, respectively. The reduction in the bandgap after doping with Sr was due to the charge transfer from the TiO2 valence band to the Sr conduction band, creating active defective sites, which enhanced the light absorption efficiency of TiO2.32
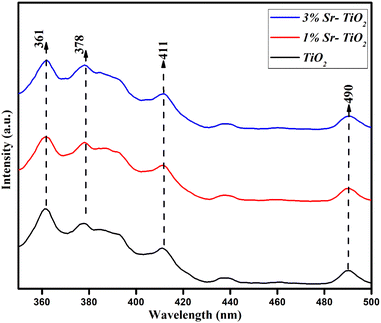
The semiconducting property of the pristine and Sr doped TiO2 samples was confirmed by PL spectra, as shown in Fig. 6. The bands in the range of 320 to 400 nm showed a combination of electrons and holes in the conduction and valence bands.33 The peak at 411 nm confirmed oxygen vacancies and that at 490 nm was due to the charge transfer of Ti to oxygen.34
The morphology of the obtained products was examined by SEM (Fig. 7a–f) in 2 μm and 200 nm. The morphology of the pristine TiO2 indicated agglomerated nanoparticle growth with improper arrangement. There was no uniformity in the growth of the nanoparticles. The particles were agglomerated and had a rough surface. The agglomeration in 1% Sr-TiO2 reduced due to the addition of strontium ions. As seen from Fig. 7(b) and (e), 1% Sr-TiO2 has nanoparticles with spherical shape and defined boundaries compared to pure TiO2 (Fig. 5a and d). The spherical shaped nanoparticles were formed at the initial stage. The small amount of dopant only initiated the formation of the spherical structure and less agglomeration. Among all the three samples, 3% Sr-TiO2 showed a clear growth of spherical morphology with a clear surface and no agglomeration was identified. By comparing Fig. 7(a) and (c), it can be seen that there was a clear growth of nanoparticles in 3% Sr-TiO2. As seen in Fig. 7(f), the shape of the nanoparticles was clearly defined and there was no improper growth on the surface of the nanoparticles. This was purely attributed to the inclusion of Sr ions as dopant.35
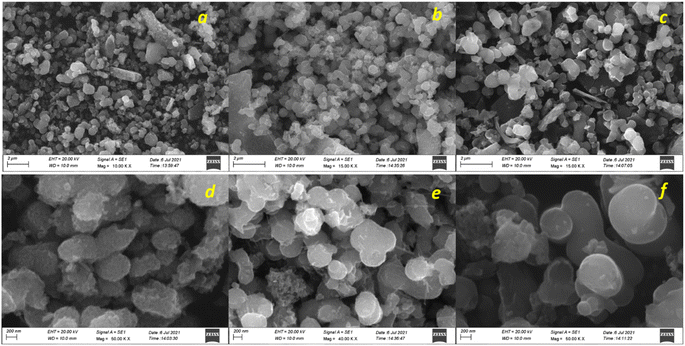 | ||
| Fig. 7 SEM images of (a) TiO2 @ 2 μm, (b) 1% Sr-TiO2 @ 2 μm, (c) 3% Sr-TiO2 @ 2 μm, (d) TiO2 @ 200 nm, (e) 1% Sr-TiO2 @ 200 nm, and (f) 3% Sr-TiO2 @ 200 nm. | ||
The surface area was analysed using BET surface area analysis. Fig. 8(a)–(c) shows N2 isotherm and the pore volume plot of pure and Sr doped TiO2 photocatalysts. The surface area obtained were 8.9 m2 g−1, 11.4 m2 g−1, and 12.8 m2 g−1 for TiO2, 1% Sr-TiO2, and 3% Sr-TiO2, respectively. The surface area was higher for 3% Sr-TiO2 than TiO2. A higher the surface area facilitates greater photocatalytic activity. The BJH plot exhibits a type IV hysteresis loop and the pore volume plot shows the mesoporous nature of the photocatalysts.
3.1. Photocatalytic activities
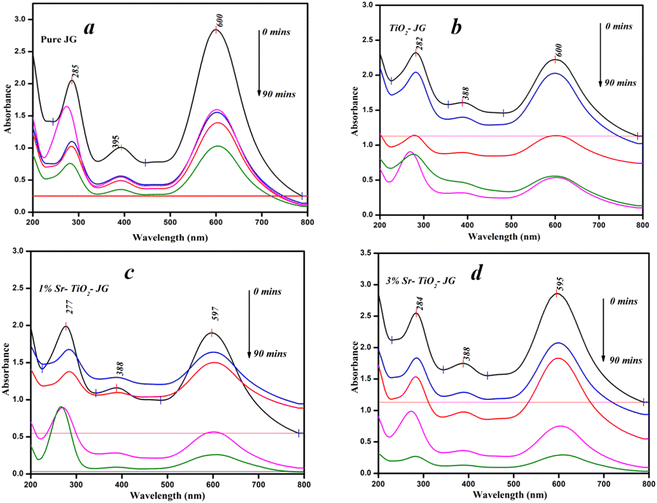
For the photocatalytic process, the separation of photo-generated electrons and holes is the key to determine the performance of photocatalysts. The photocatalysts were used to degrade JG dye as a model pollutant under visible light. The liquid samples were investigated with UV-vis absorption for t = 0, 15, 30, 60, and 90 min. The UV-vis absorption spectra of the prepared products are shown in Fig. 9(a)–(d). The characteristic absorption peak showed a decrease in the intensity after the irradiation of light. The efficiency was determined by , where Ai and Af are the initial and final absorbance, respectively. It also appears that the absorbance curve at 0 min in Fig. 9c (red trace) was lower than that initially observed at longer times. The efficiencies obtained for pure JG, TiO2-JG, 1% Sr-TiO2-JG, and 3% Sr-TiO2-JG were 54%, 76%, 86%, and 92%, respectively. The pure JG sample showed poor efficiency as it showed the water cannot be reused. In the TiO2 assisted sample, the efficiency was improved, and a considerable reduction in pollutants was observed. In the doped samples, the efficiencies were much higher and exhibited better remediation in water treatment.
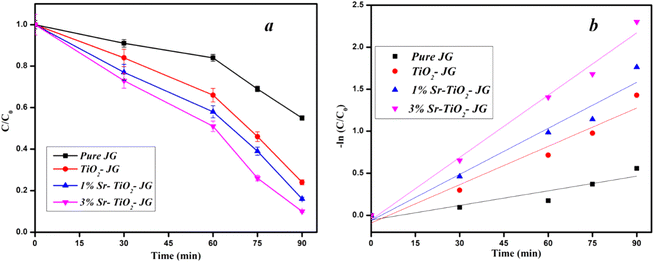
The C/C0 plot and kinetics plot were derived from the UV-vis absorption data, and the resultant plots are shown in Fig. 10(a) and (b). The C/C0 value was calculated by dividing the concentration of the dye after every fifteen min to the initial concentration. The C/C0 plot of the pure JG dye demonstrates a high value and the plot was almost a straight line because of the high C/C0 values, revealing the poor activity as expected. The catalyst assisted samples showed steep lines with better degradation values. The 3% Sr-TiO2-JG sample showed the best catalytic performance as the dopant induced the host material with numerous active sites. The dopant Sr improved the oxygen vacancies that help the radicals to recombine at a good rate.36 There is no separation of SrO2 phase in the doped photocatalyst. The efficiency improved with the increase in the Sr dopant level.37 The major photocatalytic action was because of TiO2. The rate constant value was approximately calculated by
| −ln(C/C0) = kt |
| k = −ln(C/C0)/t |
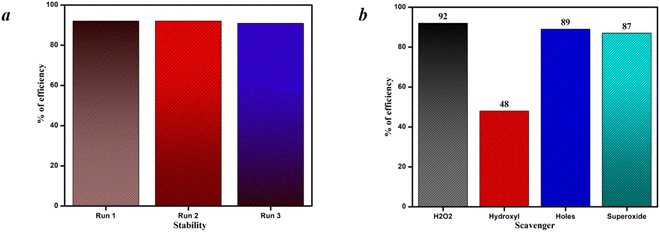
The reusability test and scavenger test are shown in Fig. 11(a) and (b). The stability of the material was tested and 3% Sr-TiO2 exhibited almost the same efficiency in all the three cycles. This sturdy nature of the photocatalyst shows that the material is stable and can be used for industrial applications with larger cycles. The active species responsible for the higher performance of the photocatalyst was identified by the scavenger test. In this study, H2O2, IPA (hydroxyl), EDTA (holes), and benzoquinone (superoxide) were used as the scavenging agents. Meanwhile, on adding H2O2, the efficiency was almost similar to the efficiency of the photocatalyst. Then, on the addition of EDTA and benzoquinone, the efficiency was slightly reduced and there was no drastic deduction of variance in efficiency, which indicates the lower presence of holes and superoxide radicals. In the case of IPA, the efficiency was greatly suppressed, which confirmed that the rich presence of hydroxyl radicals is highly responsible for the photocatalyst in achieving a good efficiency.
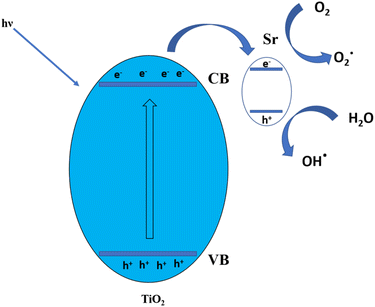
The 3% Sr-TiO2 photocatalyst with the appropriate dopant level endowed the TiO2 photocatalyst with a narrow bandgap and better surface area, facilitating the improved recombination of electrons and holes from the valence band to the conduction band; the bond between the dye molecules and water molecules is broken down to a greater extent, and the water can be reused for domestic purposes. The dye molecules were decomposed and the stronger bonds between dye molecules were broken down. Fig. 12 shows the mechanism of the photocatalysis. When the light was irradiated, the electrons moved to the conduction band and created holes in the valence band. These created electron and hole couples recombined and degraded the dye molecules. Sr inhibits the electron hole recombination by trapping the electrons and controlling the recombination in the appropriate manner.38
In literature, JG dye has not been used as a model pollutant to degrade with TiO2 as photocatalyst. Hence, JG was chosen as a model pollutant. The efficiency reached substantially and the pollutant was reduced. It can be concluded that Sr-TiO2 is a potential candidate for water treatment process. With Sr doping, the peaks of SrO2 were observed at low levels, while a composite material was formed when the dopant was increased; hence 3% Sr was chosen as the optimum dopant level.
4. Conclusion
In this study, we report the facile synthesis of pure and Sr doped TiO2 photocatalysts via the hydrothermal route. The photocatalysts were characterised using XRD, Raman spectroscopy, FTIR spectroscopy, UV-vis spectroscopy, SEM, and BET analyses to study their structural, vibrational, morphological properties and surface area. 3% Sr-TiO2 possessed a narrow bandgap that improves the activity of TiO2 under visible light. The morphology of the best sample exhibited nanoball with no agglomeration and a high surface area that enhanced the photocatalytic activity. JG dye was used to examine the photocatalytic performance of the prepared samples as it has not been used in previous studies. The efficiency of 3% Sr-TiO2 was higher and almost 100% and the kinetics value was also compared to pure TiO2. 3% Sr-TiO2 achieved 92% efficiency under visible light within 2 h. As there was no other literature reported on JG dye degradation, we selected this dye and reduced the dye with higher efficiency. 3% Sr tuned the characteristic behaviour of TiO2 that inherently achieved competent efficiency. 3% Sr-TiO2 is proved to be a potential candidate for water remediation.Conflicts of interest
The authors declare that they have no known competing financial interests or personal relationships that could have appeared to influence the work reported in this paper.Acknowledgements
This work was supported by MHRD RUSA–Phase 2, UGC-SAP, DST-FIST, and PURSE grants.References
- H. Duan, S. Gao, X. Li, N. H. Ab Hamid, G. Jiang, M. Zheng, X. Bai, P. L. Bond, X. Lu, M. M. Chislett and S. Hu, Improving wastewater management using free nitrous acid (FNA), Water Res., 2020, 171, 115382 CrossRef CAS PubMed.
- K. Sarayu and S. Sandhya, Current technologies for biological treatment of textile wastewater – a review, Appl. Biochem. Biotechnol., 2012, 167(3), 645–661 CrossRef CAS PubMed.
- U. Sathya, M. Nithya and N. Balasubramanian, Evaluation of advanced oxidation processes (AOPs) integrated membrane bioreactor (MBR) for the real textile wastewater treatment, J. Environ. Manage., 2019, 246, 768–775 CrossRef CAS PubMed.
- W. Meertens, Wastewater treatment using a novel combined electro-oxidation, electro-coagulation, and electro-fpiltration process, Doctoral dissertation, Concordia University, 2020.
- A. Y. Zahrim, C. Tizaoui and N. Hilal, Coagulation with polymers for nanofiltration pre-treatment of highly concentrated dyes: a review, Desalination, 2011, 266(1–3), 1–16 CrossRef CAS.
- M. Eyvaz, M. Kirlaroglu, T. S. Aktas and E. Yuksel, The effects of alternating current electrocoagulation on dye removal from aqueous solutions, Chem. Eng. J., 2009, 153(1–3), 16–22 CrossRef CAS.
- M. G. Tavares, D. H. Santos, M. G. Tavares, J. L. Duarte, L. Meili, W. R. Pimentel, J. Tonholo and C. L. Zanta, Removal of reactive dyes from aqueous solution by Fenton reaction: kinetic study and phytotoxicity tests, Water, Air, Soil Pollut., 2020, 231(2), 1–15 CrossRef.
- K. El Hassani, D. Kalnina, M. Turks, B. H. Beakou and A. Anouar, Enhanced degradation of an azo dye by catalytic ozonation over Ni-containing layered double hydroxide nanocatalyst, Sep. Purif. Technol., 2019, 210, 764–774 CrossRef CAS.
- K. Naseem, Z. H. Farooqi, R. Begum and A. Irfan, Removal of Congo red dye from aqueous medium by its catalytic reduction using sodium borohydride in the presence of various inorganic nano-catalysts: a review, J. Cleaner Prod., 2018, 187, 296–307 CrossRef CAS.
- J. Wang, B. Xiong, L. Miao, S. Wang, P. Xie, Z. Wang and J. Ma, Applying a novel advanced oxidation process of activated peracetic acid by CoFe2O4 to efficiently degrade sulfamethoxazole, Appl. Catal., B, 2021, 280, 119422 CrossRef CAS.
- A. Mudhoo, S. Paliya, P. Goswami, M. Singh, G. Lofrano, M. Carotenuto, F. Carraturo, G. Libralato, M. Guida, M. Usman and S. Kumar, Fabrication, functionalization and performance of doped photocatalysts for dye degradation and mineralization: a review, Environ. Chem. Lett., 2020, 18(6), 1825–1903 CrossRef CAS.
- T. Madrakian, A. Afkhami, M. Ahmadi and H. Bagheri, Removal of some cationic dyes from aqueous solutions using magnetic-modified multi-walled carbon nanotubes, J. Hazard. Mater., 2011, 196, 109–114 CrossRef CAS PubMed.
- U. Riaz, S. M. Ashraf and J. Kashyap, Role of conducting polymers in enhancing TiO2-based photocatalytic dye degradation: a short review, Polym.-Plast. Technol. Eng., 2015, 54(17), 1850–1870 CrossRef CAS.
- T. Nguyen Thi Thu, N. Nguyen Thi, V. Tran Quang, K. Nguyen Hong, T. Nguyen Minh and N. Le ThiHoai, Synthesis, characterisation, and effect of pH on degradation of dyes of copper-doped TiO2, J. Exp. Nanosci., 2016, 11(3), 226–238 CrossRef CAS.
- M. C. Hidalgo, M. Aguilar, M. Maicu, J. A. Navío and G. Colón, Hydrothermal preparation of highly photoactive TiO2 nanoparticles, Catal. Today, 2007, 129(1–2), 50–58 CrossRef CAS.
- B. Guan, J. Yu, S. Guo, S. Yu and S. Han, Porous nickel doped titanium dioxide nanoparticles with improved visible light photocatalytic activity, Nanoscale Adv., 2020, 2(3), 1352–1357 RSC.
- K. D. Lakshmi, T. S. Rao, J. S. Padmaja, I. M. Raju and M. R. Kumar, Structure, photocatalytic and antibacterial activity study of Meso porous Ni and S co-doped TiO2 nano material under visible light irradiation, Chin. J. Chem. Eng., 2019, 27(7), 1630–1641 CrossRef CAS.
- A. Shafei, M. E. Salarpour and S. Sheibani, Effect of intermediate ball milling on the synthesis of Cu-doped TiO2 nano-photocatalyst by sol–gel method, J. Sol-Gel Sci. Technol., 2019, 92(1), 173–185 CrossRef CAS.
- A. Rani, R. L. Dhiman, V. Singh, S. Kumar and S. Kumar, Structural, optical and photocatalytic study of Sr2+ doped TiO2 nanoparticles, in AIP Conference Proceedings, AIP Publishing LLC, 2021, vol. 2352, 1, p. 040021 Search PubMed.
- M. Shkir, B. M. Al-Shehri, M. P. Pachamuthu, A. Khan, K. V. Chandekar, S. AlFaify and M. S. Hamdy, A remarkable improvement in photocatalytic activity of ZnO nanoparticles through Sr doping synthesized by one pot flash combustion technique for water treatments, Colloids Surf., A, 2020, 587, 124340 CrossRef CAS.
- Y. Zhang, Y. Meng, K. Zhu, H. Qiu, Y. Ju, Y. Gao, F. Du, B. Zou, G. Chen and Y. Wei, Copper-doped titanium dioxide bronze nanowires with superior high rate capability for lithium ion batteries, ACS Appl. Mater. Interfaces, 2016, 8(12), 7957–7965 CrossRef CAS PubMed.
- I. Chauhan, S. Chattopadhyay and P. Mohanty, Fabrication of titania nanowires incorporated paper sheets and study of their optical properties, Mater. Express, 2013, 3(4), 343–349 CrossRef CAS.
- R. Yousefi, F. Jamali-Sheini, M. Cheraghizade, S. Khosravi-Gandomani, A. Sáaedi, N. M. Huang, W. J. Basirun and M. Azarang, Enhanced visible-light photocatalytic activity of strontium-doped zinc oxide nanoparticles, Mater. Sci. Semicond. Process., 2015, 32, 152–159 CrossRef CAS.
- T. Kalaivani and P. Anilkumar, Role of temperature on the phase modification of TiO2 nanoparticles synthesized by the precipitation method, Silicon, 2018, 10(4), 1679–1686 CrossRef CAS.
- R. A. Solano, A. P. Herrera, D. Maestre and A. Cremades, Fe–TiO2 nanoparticles synthesized by green chemistry for potential application in waste water photocatalytic treatment, J. Nanotechnol., 2019, 4571848 CAS.
- T. Athar, Synthesis and characterization of strontium oxide nanoparticles via wet process, Mater. Focus, 2013, 2(6), 450–453 CrossRef CAS.
- M. Scarisoreanu, A. Ilie, E. Dutu, A. Badoi, F. Dumitrache, E. Tanasa, C. N. Mihailescu and I. Mihailescu, Direct nanocrystallite size investigation in microstrained mixed phase TiO2 nanoparticles by PCA of Raman spectra, Appl. Surf. Sci., 2019, 470, 507–519 CrossRef CAS.
- A. B. Pambudi, R. Kurniawati, A. Iryani and D. Hartanto, Effect of calcination temperature in the synthesis of carbon doped TiO2 without external carbon source, in AIP Conference Proceedings, AIP Publishing LLC, 2018, vol. 2049, 1, p. 020074 Search PubMed.
- R. Aswini, S. Murugesan and K. Kannan, Bio-engineered TiO2 nanoparticles using Ledebouria revoluta extract: larvicidal, histopathological, antibacterial and anticancer activity, Int. J. Environ. Anal. Chem., 2021, 101(15), 2926–2936 CrossRef CAS.
- Q. Li, T. Zhao, M. Li, W. Li, B. Yang, D. Qin, K. Lv, X. Wang, L. Wu, X. Wu and J. Sun, One-step construction of Pickering emulsion via commercial TiO2 nanoparticles for photocatalytic dye degradation, Appl. Catal., B, 2019, 249, 1–8 CrossRef CAS.
- H. T. T. Thuong, C. T. T. Kim, L. N. Quang and H. Kosslick, Highly active brookite TiO2-assisted photocatalytic degradation of dyes under the simulated solar-UVA radiation, Prog. Nat. Sci.: Mater. Int., 2019, 29(6), 641–647 CrossRef.
- S. Selvaraj, B. Palanivel, S. Patrick, M. Krishna Mohan, M. Navaneethan, S. Ponnusamy and C. Muthamizhchelvan, Effect of Sr doping in ZnO microspheres for solar light-driven photodegradation of organic pollutants, J. Mater. Sci.: Mater. Electron., 2022, 33(11), 8777–8788 CrossRef CAS.
- R. Vijayalakshmi and V. Rajendran, Synthesis and characterization of nano-TiO2 via different methods, Arch. Appl. Sci. Res., 2012, 4(2), 1183–1190 CAS.
- S. P. Keerthana, R. Yuvakkumar, G. Ravi, S. I. Hong, A. G. Al-Sehemi and D. Velauthapillai, Fabrication of Ce doped TiO2 for efficient organic pollutants removal from wastewater, Chemosphere, 2022, 293, 133540 CrossRef CAS PubMed.
- S. L. Perumal, P. Hemalatha, M. Alagara and K. N. Pandiyaraj, Investigation of structural, optical and photocatalytic properties of Sr doped ZnO nanoparticles, Int. J. Phys. Sci., 2015, 4, 1–13 Search PubMed.
- K. Zhang, D. Jing, Q. Chen and L. Guo, Influence of Sr-doping on the photocatalytic activities of CdS–ZnS solid solution photocatalysts, Int. J. Hydrogen Energy, 2010, 35(5), 2048–2057 CrossRef CAS.
- A. Ahmed, M. N. Siddique, U. Alam, T. Ali and P. Tripathi, Improved photocatalytic activity of Sr doped SnO2 nanoparticles: a role of oxygen vacancy, Appl. Surf. Sci., 2019, 463, 976–985 CrossRef CAS.
- S. Sood, A. Umar, S. K. Mehta, A. S. K. Sinha and S. K. Kansal, Efficient photocatalytic degradation of brilliant green using Sr-doped TiO2 nanoparticles, Ceram. Int., 2015, 41(3), 3533–3540 CrossRef CAS.
| This journal is © The Royal Society of Chemistry 2023 |

