 Open Access Article
Flexible TPU inverse opal fabrics for colorimetric detecting of VOCs†
Xinbo Gonga,
Chengyi Hou *a,
Qinghong Zhang
 b,
Yaogang Li*b and
Hongzhi Wanga
aState Key Laboratory for Modification of Chemical Fibers and Polymer Materials, International Joint Laboratory for Advanced Fiber and Low-dimension Materials, College of Materials Science and Engineering, Donghua University, Shanghai, 201600, China. E-mail: hcy@dhu.edu.cn
bEngineering Research Center of Advanced Glasses Manufacturing Technology, College of Materials Science and Engineering, Donghua University, 201600, China. E-mail: yaogang_li@dhu.edu.cn
First published on 22nd March 2023
Abstract
Recently, responsive structure color fibers and fabrics have been designed and prepared for colorimetric detecting of volatile organic compounds (VOCs). Fabric substrates can offer greater flexibility and portability than flat and hard substrates such as glass, silicon wafers, etc. At present, one-dimensional photonic crystal (multilayer films) and three-dimensional dense photonic crystal layers are mainly constructed on fabrics to achieve the response to VOCs. However, the binding force between these structural color coatings and the fabrics was poor, and the dense structures inevitably hindered the diffusion of VOCs. Here, thermoplastic polyurethane (TPU) inverse opal (IOs) fabrics were prepared by sacrificing the SiO2 photonic crystal templates to achieve colorimetric detecting of VOCs. The IOs layer of TPU was cured directly on the fabric surface, TPU infiltrated into the fabric yarns, and bonded the fabrics and IOs layer into a whole, which greatly improved the binding force, and the porous structure and large specific surface area of IOs were conducive to the diffusion of VOCs. The results showed that the TPU IOs fabrics have large reflection peak shifts to DMF, THF, toluene and chloroform vapors, and its concentration has a good linear relationship with the maximum reflection peak value of TPU IOs fabrics. The theoretical detection limits are 1.72, 0.89, 0.78 and 1.64 g m−3, respectively. The response times are 105, 62, 75 and 66 seconds, with good stability. Finally, it was calculated that the discoloration of the TPU IOs fabrics in VOCs was due to the joint-effects of lattice spacing and effective refractive index increase.
1 Introduction
VOCs are organic compounds with high vapor pressure at room temperature.1,2 Common VOCs include ethanol, acetone, toluene, chloroform, ether, cyclohexane, tetrahydrofuran (THF) and N,N-dimethylformamide (DMF) etc.3,4 VOCs exist in both indoor and outdoor environments. The common sources of VOCs outdoors are automobile exhaust emissions, petroleum by-products and incomplete combustion, as well as the emission of some special vegetation,5–7 while indoors, sources such as floor adhesives, decoration paint, incomplete combustion of coal and natural gas will release VOCs.8–11 VOCs can be ingested by human skin or through the respiratory system,12 which is extremely harmful. For example: contact with benzene and other aromatic vapors will affect the normal function of the nerve center, liver and kidney, and even cause cell cancer;13–17 inhaling acetone can cause headaches, dizziness and dermatitis; exposure to cyclohexane can irritate the respiratory tract.18 So detection of VOCs in the environment is critical. At present, the methods used for VOCs detecting include surface acoustic wave,19 quartz microbalance,20 gravity type vapor sensors,21 metal semiconductor sensors,22 non-dispersive infrared vapor sensors23 and ultraviolet spectrophotometry vapor sensors.24Recently, as a colorimetric sensing material, structural color were widely used in the detection of VOCs.25,26 Compared with the above methods, its detection limits and sensitivities are not high, but due to its advantages such as no energy supply, no signal output equipment and low cost, it can provide preliminary warning of VOCs leakage through color change which can be observed by naked eyes.27 Now with the development of smart clothing, researchers begin to combine structural color with fibers or fabrics to realize real-time colorimetric detecting of solvents or vapors, compared with flat substrates such as glass and silicon wafers, fibers and fabrics are more flexible and portable. Currently, the structural color coatings on fibers and fabrics that respond to solvent and vapor are mostly one-dimensional photonic crystals (multilayer films) or dense three-dimensional photonic crystal structures. For example: Yuan28 deposited PNIPAM microspheres onto the surface of carbon fibers by electrophoretic deposition to construct three-dimensional photonic crystal structures, which could achieve discoloration in solvents such as ethanol and acetone. Xu29 deposited graphene oxide (GO) onto the surface of carbon fibers by vacuum filtration method to construct one-dimensional photonic crystals. GO nanosheets were not tightly combined but filled with gaps; the entry of vapor would change the effective refraction index (neff) of the photonic crystals, therefore GO structure color carbon fibers change their color correspondingly. Although the above structural color fibers and fabrics can achieve solvent and vapor response, the structural color coatings have poor binding force with the fibers and fabrics, the coatings were easy to be destroyed in practical application. In addition, its relatively dense structure prevented vapor from diffusing as well. In contrast, the inverse opal structure (IOs) with three-dimensional porous structure can be directly polymerized on the fiber or fabrics with strong bonding force. Moreover, benefit from porous structure and large specific surface area of IOs, it is more conducive to the diffusion and removal of vapors, thus improving the detection limits and sensitivities.30–32
In this paper, thermoplastic polyurethane (TPU) inverse opal fabrics were prepared to achieve the real-time detecting for VOCs. Firstly, photonic crystal template fabrics with appropriate thickness, uniform color were obtained by adjusting the assemble temperature and concentration of SiO2 dispersion. Then, TPU inverse opal fabrics were obtained by sacrificing SiO2 photonic crystal templates. The reflection peak value of fabrics was shifted when in common VOCs. In particular, DMF, THF, toluene and chloroform, which have good swelling effects to TPU at room temperature, showed more than 175, 128, 109 and 88 nm peak shifts. The color of TPU inverse opal fabrics and the concentration of VOCs showed a good linear relationship, therefore quantitative detecting can be achieved. The detection limits of DMF, THF, toluene and chloroform were 1.72, 0.89, 0.78 and 1.64 g m−3, respectively. The response times were 105, 62, 75 and 66 seconds, respectively. Besides, the TPU inverse opal fabrics showed good response stability when exposed alternately to VOCs and air.
2 Experimental
2.1 Materials
Tetraethyl orthosilicate (TEOS, analytically pure), ammonia (25–28%), trichloromethane (CHCl3), toluene (C7H8), N,N-dimethylformamide (DMF), tetrahydrofuran (THF), hydrofluoric acid (48%) and other reagents were purchased from Sinopharm Chemical Reagent Co., Ltd. Thermoplastic polyurethane (TPU) is purchased from BASF China Co., Ltd., and polyester fabric (thickness 1 mm) is purchased from Suzhou Sanchuan Textile Fabric Co., Ltd. All reagents do not require further purification before use.2.2 Synthesis of monodisperse SiO2 nanospheres
The monodispersed SiO2 nanospheres with different sizes were prepared by Stober method. The typical experimental process was as follows: 72 mL ethanol, 9 mL ultrapure water and 3.5 mL ammonia were added to a 250 mL flask and stirred at 400 rpm for 20 min, then 7 mL tetraethyl orthosilicate and 28 mL ethanol were mixed and added to the reaction system. The resulting milky dispersion was stirred for 2 hours at room temperature and centrifuged for 3 times by water and ethanol. The monodispersed SiO2 nanospheres were obtained by drying in a 60 °C vacuum oven. The particle size of SiO2 nanoparticles was adjusted by adjusting the amount of ammonia and tetraethyl orthosilicate.2.3 Fabrication of SiO2 photonic crystal template on fabrics
The polyester fabrics were cut into small round pieces with a diameter of 3 cm and placed in plasma for surface hydrophilic treatment (300 W 30 s). The obtained polyester fabrics were spread in a round Petri dish for use. The monodisperse SiO2 nanospheres obtained above were dispersed in ultrapure water with a certain mass fraction, and 2 mL dispersion were added to the Petri dish. Then, the Petri dish was placed in a constant temperature and humidity chamber at 30 °C and 60% humidity until all the solvent evaporated, and the photonic crystal template polyester fabrics were obtained.2.4 Preparation of TPU inverse opal fabrics
The thermoplastic polyurethane (TPU) were dissolved in N,N-dimethylformamide (DMF) with 20% mass fraction at 60 °C, and 1 mL of the above solution was uniformly dropped on the surface of the photonic crystal template fabrics. After the color of the photonic crystal fabric disappeared, it was placed in the oven at 60 °C for 4 hours, and after the TPU was solidified, the obtained TPU embedded SiO2 composite photonic crystal polyester fabric was placed in 5% HF for 10 minutes, and then washed by ultrapure water for 3 times to obtain the TPU inverse opal polyester fabrics.2.5 The response of TPU inverse opal fabric to VOCs
A certain amount of VOCs was placed in a closed cavity. After it was completely volatilizied, the TPU opal fabric was placed in it. The optical fiber spectrometer reached into the cavity through the hole above the cavity to measure the reflection spectrums of the TPU opal fabric in real time. Digital photos were taken using a NiKon camera directly.2.6 Characterization
The particle size of SiO2 colloidal microspheres was obtained through Particle Size & Zeta Potential Analyzer (Particle Size & Zeta Potential Analyzer, Malvern, Nano ZS). The surface morphology was obtained by transmission electron microscopy (TEM, Hitachi, JEM-2100F). The contact angle of polyester fabric was obtained by contact angle measuring instrument (Dataphysics, OCA40Micro). The morphologies of photonic crystal template fabrics and TPU inverse opal fabrics were obtained by field emission scanning electron microscope (FESEM, Hitachi, S-4800), the composition information of the sample was obtained by infrared spectrometer (FTIR spectrometer, NETZSCH, Nicolet 8700) and X-ray photoelectron spectrometer (XPS, ThermoFisher, Escalab 250). All digital photos of the sample were obtained by Nikon digital camera (D7000). The visible reflection spectrums of the fabric was obtained with Fiber visual spectrophotometer, (FuXiang, PG2000 Pro).3 Results and discussion
3.1 Particle size and morphology of monodispersed SiO2 nanospheres
SiO2 nanospheres prepared by Stober method have good size control and monodispersion. As shown in Fig. S1(a) and (b),† SiO2 nanoparticles at 357 nm and 258 nm were obtained by adjusting the ratio of ammonia (NH3) and tetraethyl orthosilicate (TEOS) in the reaction process, with PDI less than 0.05, which can be considered as monodisperse (<0.08). Fig. S1(c) and (d)† showed the morphologies of SiO2 nanospheres. It can be seen that the particle sizes of SiO2 nanospheres were uniform and the morphologies were regular and circular. These two kinds of SiO2 nanospheres were used to prepare the following red and green photonic crystal templates, respectively.3.2 Morphology of SiO2 photonic crystal template fabrics
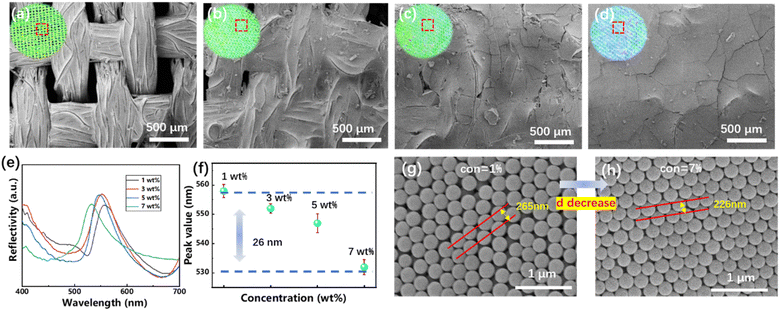
SiO2 photonic crystal template fabrics were prepared by vertical deposition, and by controlling the influencing factors of fabric substrates and vertical deposition process, the optimum conditions for template construction were determined. Usually, the heat treatment (300–600 °C) process was required to construct SiO2 photonic crystal template on glass or silicon wafer, which makes the SiO2 more closely arranged and enhances its binding force with the substrate. This is obviously not appropriate for fabrics. By grafting hydroxyl group on the surface of polyester fabric by oxygen plasma treatment, its surface hydrophilicity was greatly improved. As shown in Fig. S2,† the contact angle of the fabrics before plasma treatment was 113.9°, while that after treatment was only 24.3°. The surface of SiO2 nanospheres prepared by Stober method was also rich in hydroxyl groups. It can form hydrogen bonds with the hydroxyl groups on the fabric surface, thus increasing the interface binding force between the photonic crystal templates and the fabrics.In order to prepare inverse opal on fabrics, the photonic crystal templates on the fabric surface needs to have a certain thickness to prevent the leakage of TPU prepolymer from the holes in fabrics. The quality of the photonic crystals prepared by vertical deposition depends on the dispersion concentration and assembly temperature. In order to evaluate the influence of dispersion concentration, 2 mL SiO2 nanospheres aqueous dispersion with concentration of 1, 3, 5 and 7 wt% were added to the Petri dish with circular polyester fabric at the bottom. The photonic crystal polyester fabrics were obtained at 30 °C for 2 days. The digital photos and SEM images of the obtained SiO2 photonic crystal polyester fabrics were shown in Fig. 1(a)–(d). It can be seen that when the concentration of SiO2 is 1 wt%, the holes of the polyester fabrics will hardly be blocked, and the photonic crystals were mainly assembled on yarns. So the TPU prepolymer will be lost from the holes in the subsequent process. When the concentration of SiO2 is 3 wt%, the holes of polyester fabrics were mostly blocked, but still showed the shape of fabrics. However, when the concentration continues to increase, the polyester fabrics were completely covered by SiO2 photonic crystals, and the thick photonic crystal layer will also make it difficult for the high viscosity TPU prepolymer to penetrate. In addition, with the increase of dispersion concentration, SiO2 photonic crystal template fabrics changes from green to cyan, as shown in Fig. 1(e) and (f), the peak value blue shifted about 26 nm. Fig. 1(g) and (h) shows the SEM images of photonic crystal structure when dispersion concentration is 1 wt% and 7 wt%, respectively. It can be seen that the arrangements of SiO2 nanospheres was relatively loose at low concentration, with lattice spacing of about 265 nm, while the arrangement was relatively tight at high concentration, with lattice spacing reduced to 226 nm. According to the modified Bragg diffraction equation, the maximum reflection peak of photonic crystal structure is proportional to lattice spacing, therefore, the color of the photonic crystal template fabrics blue shifted with the concentration increase.
In order to determine the appropriate assembly temperature, the assembly was carried out at 10, 30, 50, 70 and 100 °C at a constant 3 wt% SiO2 concentration. The digital photos and SEM images of the photonic crystal polyester fabrics were obtained, as shown in Fig. 2(a)–(c). It can be seen that the photonic crystals showed good close-packing structure at 10 °C. When the temperature rised to 50 °C, the disorder of the photonic crystal increases rapidly, when the temperature was 100 °C, the ordered arrangements of SiO2 nanospheres almost disappeared. Accordingly, with the disappearance of the ordered arrangement structure, the color of SiO2 photonic crystal fabrics gradually disappeared, which can be seen in the insets of Fig. 2(a)–(c). Fig. 2(d) and (e) showed the reflection spectrums and the intensity change when assembled at different temperatures, it can be seen that the peak value hardly changed while the intensity decreased rapidly, which cause the decrease of color saturation.
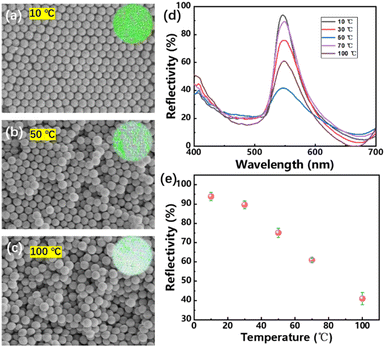 | ||
| Fig. 2 SEM images and digital photos of PCs templates assembled by SiO2 nanospheres at (a) 10, (b) 50, (c) 100 °C, corresponding (d) reflection spectrums and (e) change of peak intensity. | ||
Through the above experiments, it is determined that the optimum assembly conditions for SiO2 photonic crystal templates were 30 °C and 3 wt%. Fig. 3(a) showed the digital photos of the photonic crystal fabrics assembled by SiO2 with 258 and 357 nm. It can be seen that the color distribution of the polyester fabric was uniform, and the color blue shifted about 100 nm (Fig. 3(b) and (c)) gradually with the decrease of the viewing angles from 90° to 45°. The uniformity and angle dependence of the color indicated that the assembled photonic crystals have a regular hexagonal close-packing structure as well.
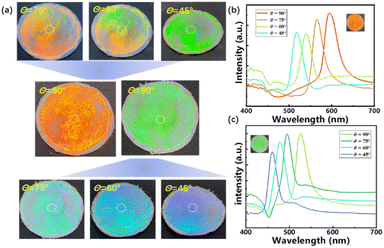 | ||
| Fig. 3 Digital photos of SiO2 PCs polyester fabrics with different particle sizes of (a) 357 nm and 258 nm and (b) and (c) changes in reflected peaks at different viewing angles from 90° to 45°. | ||
3.3 Morphology and composition analysis of TPU inverse opal fabric
Thermoplastic polyurethane (TPU) inverse opal fabrics was prepared by sacrificing SiO2 photonic crystal templates. As shown in Fig. 4, the photonic crystal polyester fabrics with appropriate thickness and uniform color obtained in the above experiments is placed on the wire mesh, and then 20 wt% TPU DMF solution is rapidly added to the surface of the photonic crystal template. Since the TPU DMF dispersion will quickly become sticky at room temperature, which can prevent TPU from penetrating into the photonic crystals. Therefore, the transfer process was all completed at 60 °C within 1 minute. When the TPU infiltrated into the gaps of photonic crystals, the color showed a large degree of redshift, then the solution continues to stand at 60 °C for 2 hours, TPU/SiO2 composite photonic crystal fabrics were obtained successfully after the solvent completely volatilized. It is then etched in 5% HF for 10 minutes to remove the SiO2 to obtain TPU inverse opal fabrics. The obtained TPU inverse opal fabrics can swell in some VOCs such as DMF, THF, toluene and chloroform at room temperature, so causing the volume of TPU inverse opal to increase, the lattice spacing increased correspondingly. In addition, the air in the opal holes will inevitably be occupied by a part of the VOCs, thus increasing its effective refractive index. Both of these effects can cause the redshifts of the reflection peak of TPU inverse opal fabrics when in VOCs vapor.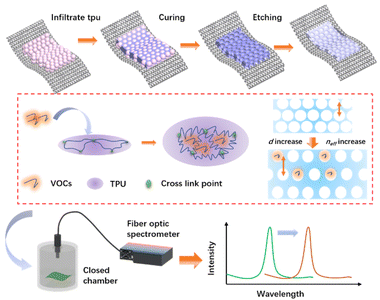 | ||
| Fig. 4 Schematic diagram of the preparation process and VOCs response mechanism of TPU inverse opal fabric. | ||
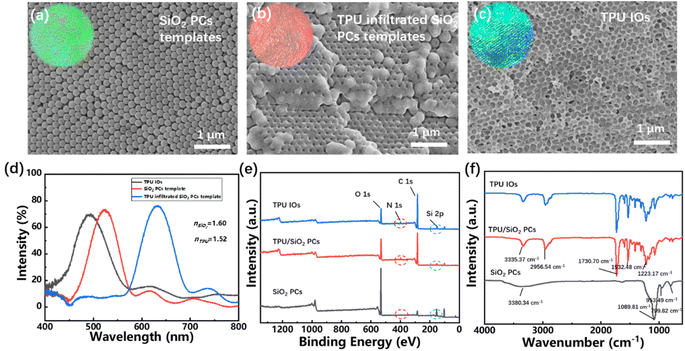
Fig. 5(a)–(c) showed the digital photos and SEM images of SiO2 PCs, TPU/SiO2 composite PCs and TPU IOs. It can be seen that the TPU have infiltrated into the gaps of SiO2 PCs, and after the SiO2 template removed, the porous inverse opal structure was obtained. In addition, it can be seen from Fig. 5(d) that the reflection peak of SiO2 PCs was about 531 nm, then increased to 639 nm after TPU infiltration. This is because the TPU (n ≈ 1.52) replaced the air (n = 1) in the SiO2 PCs gaps, which increased the effective refractive index, caused the reflection peak red shifted. When the SiO2 templates were removed, the holes of TPU inverse opal will be filled with air again, and the effective refraction index decreased correspondingly, resulting in blue shift of the reflection peak. Besides, the refraction index of TPU (n ≈ 1.5) is smaller than that of SiO2 (n ≈ 1.6), and the volume fraction of TPU in inverse opal (≈26%) is much smaller than that of SiO2 in PCs (≈74%), so the reflection peak value of TPU is about 35 nm smaller than that of SiO2 PCs.
The composition of TPU inverse opal fabrics was characterized by FTIR and XPS. It can be seen from Fig. 5(e) that the fabrics has a peak of N element after TPU infiltration, and the Si element content drops sharply, which indicated that the TPU prepolymer has successfully infiltrated into the gap of the SiO2 PCs template. Compared with the TPU/SiO2 composite PCs, there are little change of peak position and peak strength of the TPU inverse opal fabrics. In addition, the successful preparation of TPU inverse opal fabrics was also confirmed by FTIR (Fig. 5(f)). The anti-symmetric stretching vibration peak of Si–O–Si at 1089.81 cm−1, the symmetric stretching vibration peak of Si–O at 799.82 cm−1 and the bending vibration peak of Si–OH at 953.49 cm−1 all disappeared after infiltration by TPU. Moreover, the infrared spectrums of TPU/SiO2 composite PCs were basically consistent with the TPU inverse opal fabrics.
The morphology of TPU inverse opal fabric were characterized by further SEM images. As shown in Fig. 6(a)–(c). The top layer of the TPU IOs fabric is pure TPU with an inverse opal layer in the middle, and the thickness is about 200 μm, depending on the thickness of the SIO2 PCs templates. Fig. 6(d) showed the enlarged view of TPU IOs. The arrangements of holes presented a hexagonal close-packing structure and provide large specific surface area for the subsequent detection of VOCs.
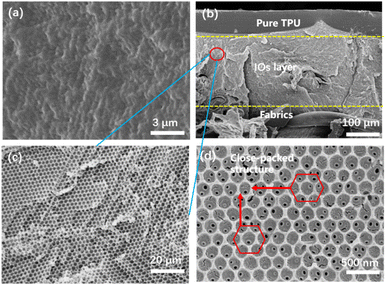 | ||
| Fig. 6 (a) Surface, (b) cross-section and (c) enlargement SEM images of the TPU IOs fabrics, (d) hexagonal close-packed structure of TPU IOs. | ||
3.4 Discoloration properties of TPU inverse opal fabrics in response to VOCs
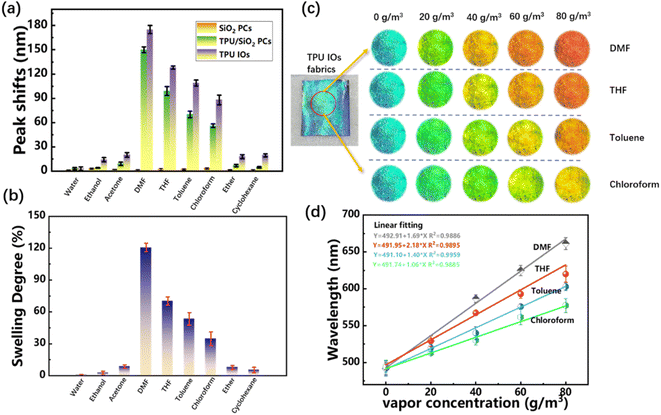
The response performance test of TPU inverse opal fabrics to VOCs was carried out in a closed chamber of 10 × 10 × 10 cm3. The same vapor concentration (80 g m−3) of water, ethanol, acetone, DMF, THF, toluene, chloroform, ether and cyclohexane were placed in the chamber, then the samples were quickly placed in the chamber after vapor have been completely volatilized. A fiber optic spectrometer that inserted vertically into the top of the cavity was used to collect the reflection spectrum of the fabric and digital photos were vertically taken by the camera.As can be seen from Fig. 7(a), TPU inverse opal fabrics were responsive to most VOCs, but the peak shift values were relatively high when in DMF, THF, toluene and chloroform vapor, which were 175, 128, 109 and 88 nm, respectively. This may be related to the swelling degree of TPU in different VOCs at room temperature, as shown in Fig. 7(b), the swelling degree of TPU film in DMF, THF, toluene and chloroform was approximate 120%, 72%, 51% and 37% respectively, which was consistent with the change trend of reflection peak shift. Therefore, it can be considered that the change of lattice spacing caused by TPU swelling was one of the main reasons for discoloration, and the detailed mechanism will be discussed later.
In addition, the TPU inverse opal fabrics were obtained by etching SiO2 of TPU/SiO2 composite PCs fabrics, so the TPU contents of these two are the same, but the peak shift values of the TPU inverse opal fabrics were greater than that of the TPU/SiO2 composite PCs fabrics, the difference between the two may be due to VOCs infiltrating into the holes in the TPU inverse opal, increasing the effective refraction index, as a result, the difference of reflection peak shifts depended on the refractive index of vapor. For acetone (n ≈ 1.35), ethanol (n ≈ 1.36) and ether (n ≈ 1.35), the difference was about 10 nm. For DMF (n ≈ 1.39), chloroform (n ≈ 1.44) and toluene (n ≈ 1.49), the difference was approximate 25, 32 and 39 nm, respectively, which indicated that the vapor with high refractive index entered the TPU inverse opal can cause a large change in reflection peak value.
The TPU Inverse opal fabrics were then placed in varying concentrations (from 0 to 80 g m−3) of DMF, THF, toluene, and chloroform vapor. Fig. S3(a)–(d)† showed the reflection spectrums of TPU inverse opal fabrics, even at low concentration (20 g m−3), the reflection peak shifts of DMF, THF, toluene and chloroform vapor were 39, 36, 35 and 28 nm, respectively. It is generally believed that the reflection peak shifts larger than 10 nm will be easy to be observed by the naked eyes. In addition, there are little difference in the reflection peak shifts of TPU inverse opal fabrics in these four vapors with low concentration, which may be due to the small swelling effects of TPU caused by VOCs with low concentration, in this case, the increase of effective refractive index caused by vapor infiltration may be the main factor of reflection peak shifts. With the increase of DMF, THF, toluene and chloroform vapor concentration, the lattice spacing caused by TPU swelling gradually became the main factor of reflection peak shifts, were 175, 128, 109 and 88 nm, respectively, and the difference increased significantly.
Fig. 7(c) showed digital photos of the discoloration of the TPU inverse opal fabrics in DMF, THF, toluene and chloroform vapor at concentrations of 0, 20, 40, 60 and 80 g m−3. The initial TPU inverse opal fabrics of the TPU appeared blue. With the concentration increased to 80 g m−3, the color shifted to red gradually, even at low concentration of 20 g m−3, the color change can be obviously observed by the naked eyes. Fig. 7(d) showed the fitting curve of the reflection peaks of TPU inverse opal fabrics in four VOCs with their concentrations, it can be seen the two showed a good linear relationship. The theoretical detection limits for DMF, THF, toluene and chloroform vapor were 1.72, 0.89, 0.78 and 1.64 g m−3, respectively.
3.5 Response speed and stability of TPU inverse opal fabrics to VOCs
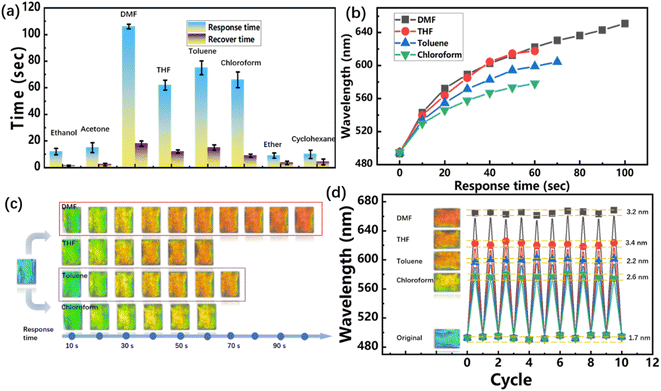
Rapid response is essential for real-time colorimetric detecting of TPU inverse opal fabrics to VOCs. Fig. 8(a) showed the response time and recovery time of ethanol, acetone, DMF, THF, toluene, chloroform, ether and cyclohexane at the same concentration (80 g m−3) of TPU inverse opal fabrics. The response time of TPU inverse opal fabrics in ethanol, acetone, ether and cyclohexane was about 10 s. As can be seen from Fig. 7(b), TPU almost does not swell in ethanol, acetone, ether and cyclohexane vapor, therefore, it can be considered that the infiltration of these vapor lead to the increase of effective refraction index. Besides, the infiltration rate of vapor into the inverse opal holes is much faster than the rate of swelling equilibrium of TPU, so the discoloration can be completed within 10 s. In contrast, the response time of TPU inverse opal fabrics to DMF, THF, toluene and chloroform is 105, 62, 75 and 66 seconds, respectively, these vapors can cause obvious swelling of the TPU inverse opal, and lead to the increase of lattice spacing, thus caused larger reflection peak shifts.Fig. 8(c) and S4† showed the digital photos and corresponding reflection spectrums every 10 s in the response process. It can be seen that in the first 10 seconds, the reflection peak shifts for DMF, THF, toluene and chloroform all exceeded 35 nm, and with the increase of exposure time in VOCs, the growth rate of peak reflection gradually decreased. In addition, in the first 10 seconds, the reflection peak values of TPU inverse opal fabrics in DMF, THF, toluene and chloroform were almost the same, and then the difference becomes larger and larger. This may be because the effect of swelling is small in the first 10 seconds, and the color changes were mainly relied on the refractive index, which is similar for the four VOCs.
The discoloration stability was verified by placing the TPU inverse opal fabrics alternately in the VOCs and air for 10 times, and measured its reflection spectrums each time. As shown in Fig. 8(d), the errors between the reflection spectrums in response and recover states were within 5 nm in 10 cycles, which proved that TPU inverse opal fabrics have good response stability.
3.6 Response mechanism of TPU inverse opal fabrics to VOCs
The maximum reflection peak of photonic crystal structure can be estimated by the modified Bragg diffraction equation, and the inverse opal structure is a special form of photonic crystal structure, which can also estimate by eqn (1):| λmax = 1.63neffDn | (1) |
 | (2) |
In the previous discussion, it is inferred that the response of TPU inverse opal fabrics to VOCs is the combined effect of lattice spacing and effective refraction index variation. Here, the theoretical reflection peak value is calculated by Bragg diffraction equation and compared with the actual reflection peak value to prove the correctness of this conclusion. Taking the reflection peak shift of TPU inverse opal in DMF as an example, the measured TPU reflection peak under saturated DMF vapor was 666 nm, and the initial reflection peak is 492 nm. The swelling degree of TPU in saturated DMF vapor can be approximately regarded as the swelling degree in DMF solvent (≈120%), and the change of swelling degree can be defined as the changes in the three-dimensional direction, while the lattice spacing (d0) is only a one-way upward change. Therefore, the corresponding lattice spacing (d1) after swelling is about 1.3 × d0, which can be substituted into formula (1) to obtain the theoretical reflection peak value of TPU inverse opal fabrics after swelling was 639 nm. It is smaller than the measured peak value in saturated DMF vapor (666 nm), but close to the measured value of TPU/SiO2 composite PCs, since there are no holes or gaps in composite PCs, discoloration of TPU/SiO2 composite PCs only relied on the lattice spacing increase caused by TPU swelling. In summary, it can be concluded that the reflection peak shifts of TPU inverse opal fabrics in DMF, THF, toluene and chloroform vapor are joint effects of increasing refraction index and TPU swelling effect, and the swelling effect is dominant in discoloration process.
4 Conclusion
SiO2 photonic crystal templates were prepared by vertical deposition method on fabrics. By adjusting the assembly temperatures and SiO2 dispersion concentrations, high quality photonic crystal templates with appropriate thickness, uniform color were successfully prepared. Then thermoplastic polyurethane (TPU) inverse opal (IOs) fabrics were prepared by sacrificing SiO2 photonic crystal templates. The results showed that it can respond to most VOCs, among them, the TPU inverse opal fabrics have larger response to DMF, THF, toluene and chloroform vapor, furthermore, reflection peak value of TPU inverse opal fabrics and VOCs concentration showed a good linear relationship. The theoretical minimum detection limits were 1.72, 0.89, 0.78 and 1.64 g m−3, respectively. The response time of TPU inverse opal fabrics to DMF, THF, toluene and chloroform vapor are 105, 62, 75 and 66 seconds, respectively, and the response stability is good. Finally, it is calculated that the discoloration of TPU inverse opal fabrics in VOCs is the joint effects of lattice spacing and effective refractive index increase.Author contributions
Xinbo Gong: designing experiment, investigation, formal analysis, methodology, writing – original draft, data curation. Chengyi Hou: resources, supervision, writing – review & editing. Qinghong Zhang: software, conceptualization. Yaogang Li: project administration, supervision. Hongzhi Wang: supervision.Conflicts of interest
There are no conflicts to declare.Acknowledgements
This work was supported by the National Natural Science Foundation of China (No. 51873033), DHU Distinguished Young Professor Program (LZB2019002), Shanghai Rising-Star Program (20QA1400300), and the Fundamental Research Funds for the Central Universities and Graduate Student Innovation Fund of Donghua University (CUSF-DH-D-2020042).Notes and references
- W. Hailin, N. Lie, L. Jing, W. Yufei, W. Gang, W. Junhui and H. Zhengping, Characterization and assessment of volatile organic compounds (VOCs) emissions from typical industries, Chin. Sci. Bull., 2013, 58, 724–730 CrossRef.
- P. Kumar, A. Deep, K.-H. Kim and R. J. C. Brown, Coordination polymers: Opportunities and challenges for monitoring volatile organic compounds, Prog. Polym. Sci., 2015, 45, 102–118 CrossRef CAS.
- J. Bartzis, P. Wolkoff, M. Stranger, G. Efthimiou, E. Tolis, F. Maes, A. Nørgaard, G. Ventura, K. Kalimeri and E. Goelen, On organic emissions testing from indoor consumer products' use, J. Hazard. Mater., 2015, 285, 37–45 CrossRef CAS PubMed.
- F. I. Khan and A. Kr. Ghoshal, Removal of Volatile Organic Compounds from polluted air, J. Loss Prev. Process Ind., 2000, 13, 527–545 CrossRef.
- E. Gallego, F. X. Roca, X. Guardino and M. G. Rosell, Indoor and outdoor BTX levels in Barcelona City metropolitan area and Catalan rural areas, J. Environ. Sci., 2008, 20, 1063–1069 CrossRef CAS PubMed.
- G. A. Pilidis, S. P. Karakitsios and P. A. Kassomenos, BTX measurements in a medium-sized European city, Atmos. Environ., 2005, 39, 6051–6065 CrossRef CAS.
- X. Zhang, B. Gao, A. E. Creamer, C. Cao and Y. Li, Adsorption of VOCs onto engineered carbon materials: A review, J. Hazard. Mater., 2017, 338, 102–123 CrossRef CAS PubMed.
- P. Schneider, Indoor and outdoor BTX levels in German cities, Sci. Total Environ., 2001, 267, 41–51 CrossRef CAS PubMed.
- L. A. Wallace, Major sources of benzene exposure, Environ. Health Perspect., 1989, 82, 165–169 CrossRef CAS PubMed.
- E. Ilgen, Aromatic hydrocarbons in the atmospheric environment: part I. Indoor versus outdoor sources, the influence of traffic, Atmos. Environ., 2001, 35, 1235–1252 CrossRef CAS.
- G. A. Ayoko, Volatile organic compounds in indoor environments, Environ. Chem., 2004, 4, 1–35 CAS.
- K. S. N. Yamazoe, New perspectives of gas sensor technology, Sens. Actuators, B, 2009, 138, 100–107 CrossRef.
- P. K. Sekhar and K. Subramaniyam, Detection of harmful benzene, toluene, ethylbenzene, xylenes (BTEX) vapors using electrochemical gas sensors, ECS Electrochem. Lett., 2014, 3, 1–4 Search PubMed.
- D. Kou, W. Ma, S. Zhang, R. Li and Y. Zhang, BTEX Vapor Detection with a Flexible MOF and Functional Polymer by Means of a Composite Photonic Crystal, ACS Appl. Mater. Interfaces, 2020, 12, 11955–11964 CrossRef CAS PubMed.
- A. Allouch, S. Le Calvé and C. A. Serra, Portable, miniature, fast and high sensitive real-time analyzers: BTEX detection, Sens. Actuators, B, 2013, 182, 446–452 CrossRef CAS.
- D. Pyatt and S. Hays, A review of the potential association between childhood leukemia and benzene, Chem.-Biol. Interact., 2010, 184, 151–164 CrossRef CAS PubMed.
- R. Kandyala, S. P. Raghavendra and S. Rajasekharan, Xylene: An overview of its health hazards and preventive measures, J. Oral Maxillofac. Pathol., 2010, 14, 1–5 CrossRef PubMed.
- W. J. Kim, N. Terada, T. Nomura, R. Takahash, S. D. Lee, J. H. Park and A. Konno, Effect of formaldehyde on the expression of adhesion molecules in nasal microvascular endothelial cells: the role of formaldehyde in the pathogenesis of sick building syndrome, Clin. Exp. Allergy, 2002, 32, 287–295 CrossRef CAS PubMed.
- H. Zhu, R. Nidetz, M. Zhou, J. Lee, S. Buggaveeti, K. Kurabay and X. Fan, Flow-through microfluidic photoionization detectors for rapid and highly sensitive vapor detection, Lab Chip, 2015, 15, 3021–3029 RSC.
- A. Kumar, J. Brunet, C. Varenne, A. Ndiaye and A. Pauly, Phthalocyanines based QCM sensors for aromatic hydrocarbons monitoring: Role of metal atoms and substituents on response to toluene, Sens. Actuators, B, 2016, 230, 320–329 CrossRef CAS.
- S. Fanget, S. Hentz, P. Puget, J. Arcamone, M. Matheron, E. Colinet, P. Andreucci, L. Durafourg, E. Myers and M. L. Roukes, Gas sensors based on gravimetric detection - A review, Sens. Actuators, B, 2011, 160, 804–821 CrossRef CAS.
- A. Mirzaei, J. H. Kim, H. W. Kim and S. S. Kim, Resistive-based gas sensors for detection of benzene, toluene and xylene (BTX) gases: a review, R. Soc. Chem., 2018, 6, 4342–4370 CAS.
- C. Chen, K. D. Campbell, I. Negi, R. A. Iglesias, P. Owens, N. Tao, F. Tsow and E. S. Forzani, A new sensor for the assessment of personal exposure to volatile organic compounds, Atmos. Environ., 2012, 54, 679–687 CrossRef CAS PubMed.
- A. Allouch, S. Le Calvé and C. A. Serra, Portable, miniature, fast and high sensitive real-time analyzers: BTEX detection, Sens. Actuators, B, 2013, 182, 446–452 CrossRef CAS.
- Z. Wang, J. Zhang, J. Li, J. Xie, Y. Li, S. Liang, Z. Tian, C. Li, Z. Wang, T. Wang, H. Zhang and B. Yang, Colorful detection of organic solvents based on responsive organic/inorganic hybrid one-dimensional photonic crystals, J. Mater. Chem., 2011, 21, 1264–1270 RSC.
- Z. Cai, A. Sasmal, X. Liu and S. A. Asher, Responsive photonic crystal carbohydrate hydrogel sensor materials for selective and sensitive Lectin protein detection, ACS Sens., 2017, 2, 1474–1481 CrossRef CAS PubMed.
- P. Lova, C. Bastianini, P. Giusto, M. Patrini, P. Rizzo, G. Guerra, M. Iodice, C. Soci and D. Comoretto, Label-Free Vapor Selectivity in Poly (p-Phenylene Oxide) Photonic Crystal Sensors, ACS Appl. Mater. Interfaces, 2016, 8, 31941–31950 CrossRef CAS PubMed.
- X. F. Yuan, Z. F. Liu, S. L. Shang, H. Z. Wang, Q. H. Zhang, Y. G. Li and W. S. Jin, Visibly vapor-responsive structurally colored carbon fibers prepared by an electrophoretic deposition method, RSC Adv., 2016, 6, 16319–16322 RSC.
- P. J. Xu, J. Hou, J. Q. Cheng, X. M. Chen, J. Zhang, W. L. Zhang, P. Li and S. L. Gao, Color carbon fiber and its discoloration response, Carbon, 2022, 199, 42–50 CrossRef CAS.
- Y. Zhang, J. Qiu, R. Hu, P. Li, L. J. Gao, L. P. Heng, B. Z. Tang and L. Jiang, A visual and organic vapor sensitive photonic crystal sensor consisting of polymer-infiltrated SiO2 inverse opal, Phys. Chem. Chem. Phys., 2015, 17, 9651–9658 RSC.
- M. L. Zhang, F. Jin, M. L. Zheng and X. M. Duan, Inverse opal hydrogel sensor for the detection of pH and mercury ions, RSC Adv., 2014, 4, 20567–20572 RSC.
- Y. Fang, Y. Ni, B. Choi, S. Leo, J. Gao, B. Ge, C. Taylor, V. Basile and P. Jiang, Chromogenic photonic crystals enabled by novel vapor-responsive shape-memory polymers, Adv. Mater., 2015, 27, 3696–3704 CrossRef CAS PubMed.
Footnote |
| † Electronic supplementary information (ESI) available. See DOI: https://doi.org/10.1039/d3ra01009k |
| This journal is © The Royal Society of Chemistry 2023 |

