 Open Access Article
Facile electrochemical affinity measurements of small and large molecules†
Pouya Zareea,
Ilhan Tomrisa,
Sander D. de Vos b,
Roosmarijn van der Woude
 a,
Frits M. Flesch
 a,
Robertus J. M. Klein Gebbink
 b,
Robert P. de Vries
 a and
Roland J. Pieters
 *a
*a
aDepartment of Chemical Biology & Drug Discovery, Utrecht Institute for Pharmaceutical Sciences, Utrecht University, P. O. Box 80082, NL-3508 TB Utrecht, The Netherlands. E-mail: R.J.Pieters@uu.nl
bInstitute for Sustainable and Circular Chemistry, Debye Institute for Nanomaterials Science, Utrecht University, Universiteitsweg 99, 3584 CG Utrecht, The Netherlands
First published on 27th March 2023
Abstract
A novel miniaturized sensor for electrochemical detection that contains graphene- and gold nanoparticles was functionalized with proteins. Using cyclic voltammetry (CV) and differential pulse voltammetry (DPV) it was possible to observe and quantify interactions of molecules with these proteins. The protein binders included carbohydrate ligands as small as carbohydrates up to COVID-19 spike protein variants engaged in protein–protein interactions. The system uses off-the-shelf sensors combined with an affordable potentiostat and yet is sensitive enough for small ligand binding.
Introduction
Developing compounds as drugs or biological tools requires them to have high affinities and specificities. To measure this, over the years numerous techniques have been and are still being developed.1–4 Some of these techniques require relatively large quantities of protein targets and small molecules while others can be run in high throughput settings. Deciphering affinities quickly, accurately and affordably, greatly facilitates the development of bioactive compounds. Among the commonly used techniques, ITC stands out as it provides thermodynamic parameters and requires no immobilization and labelling, yet it requires relatively large amounts of often precious protein targets. Other techniques include stability shift assays, mobility shift assays or spectroscopic ones.5 Among these BLI and SPR are established label-free techniques that can easily detect a large molecule binding to a functionalized surface,6,7 but detecting the binding of small molecules is more challenging and requires advanced and costly instruments,8,9 clearly indicating the need for more straightforward affordable techniques. Among the assay methods in drug discovery, electrochemical methods are not usually mentioned. At the same time, the development of biosensors is a very active field, and many biosensors utilize electrochemistry.10 With the advent of screen-printed electrodes and the availability of carbon materials including graphene11 and gold nanoparticles, new components are available for the sensitive electrochemical detection of molecular binding events.12 Screen-printing technology used for microelectronics has a significant utilization for fabricating electrodes for disposable electrochemical sensors and biosensors.13,14 In fact, a screen printed electrode (SPE) enjoys simplified operation, versatility, a lower price, portability, reliability, smaller size options, and can be mass produced. Hence, it has wide application in the field of electroanalytical chemistry and label free detection.15 Graphene provides a large surface area, high conductivity, good biocompatibility, stability, strength, and is affordable.16 Gold nanoparticles, besides separating the graphene layers, provide their own opportunities such as easy functionalization by the assembly of sulfur-containing compounds.17,18We here report on the use of binding affinity determinations with the use of commercial screen-printed electrodes linked to a potentiostat. Small molecule binding was exemplified by the binding of small carbohydrates to lectins. Subsequently the method was applied to quantify protein–protein interactions, often used in drug discovery studies. To this end the SARS-CoV-2 spike protein binding to its receptor: angiotensin converting enzyme type 2 (ACE2) was studied.
Results
The sensor was prepared using commercial screen-printed carbon electrodes modified with graphene–gold nanoparticles according to Fig. 1. The gold nanoparticles were further modified by the addition of 11-mercapto-1-undecanoic acid (MUA) and dithiothreitol (DTT). After activating the carboxyl group of MUA the protein of study was immobilized by conjugation via its surface exposed lysines. BSA was subsequently used for blocking. Cyclic voltammetry (CV) and differential pulse voltammetry (DPV) were utilized to characterize the result of the above steps, using the ferro/ferricyanide redox couple. The peak current decreased with each functionalization step due to the barriers created on the electrode surface by each successive step, thus obstructing the diffusion of [Fe(CN)6]3−/4− toward the electrode surface. The addition of ligand was detectable as another current decrease that could be fit to a binding isotherm.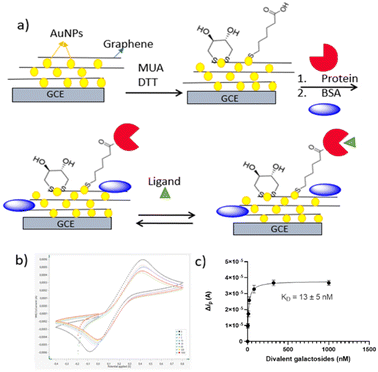 | ||
| Fig. 1 (a) Biosensor fabrication scheme with MUA and DTT attachment to the gold nanoparticles which are electrodeposited on the glassy carbon electrode (GCE); MUA carboxyl activation and linkage to lectin followed by blocking with BSA; subsequent ligand titration following by (b) electrochemical read out of LecA + (2) in Table 1 by CV and (c) its binding evaluation. | ||
The first protein that was immobilized was the Pseudomonas aeruginosa lectin LecA (Fig. 2) with binding sites for galactose separated by 26 Å. For this lectin we have previously developed low nanomolar divalent ligands that can be compared to the micromolar galactose ligand and whose binding we previously analyzed by ITC, BLI, native MS and CE.19,20
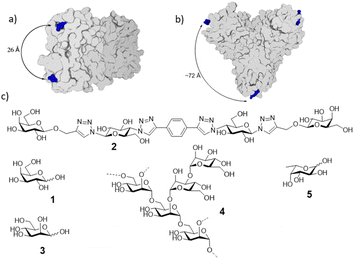 | ||
| Fig. 2 Structures of the lectins and carbohydrate ligands. (a) Pseudomonas aeruginosa galactose-specific lectin LecA; (b) jack fruit mannose-specific lectin ConA (c) galactose (1), divalent lecA ligand (2),19 mannose (3), mannan (4), exemplary substructure shown, fucose (5). | ||
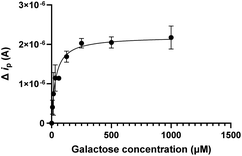
Similarly, the lectin ConA from the Jack fruit, was immobilized and incubated with the monovalent mannose ligand as well as the mannose polymer mannan.24 Performing a titration of the divalent LecA ligand 2 lead to successive current changes in the transmitted current (Fig. 1b). The CV data were fit to a binding curve (Fig. 1c) and the same was done for the DPV data. Both methods gave similar low nanomolar dissociation constants (Fig. S1, S2,† and Table 1).
| Analyte for lectin binding | Kd from CV | Kd from DPV | Reported Kd |
|---|---|---|---|
| a n.b. = no binding. | |||
| LecA + galactose (1) | 67 ± 26 μM | 52 ± 10 μM | 87.5 μM (ref. 21) |
| LecA + (2) | 13 ± 5 nM | 16 ± 3 nM | 16 nM (ref. 20) |
| LecA + mannose (3) | n.b. | n.b. | n.b. |
| LecA + mannan (4) | n.b. | n.b. | n.b. |
| ConA + mannose (3) | 38 ± 11 μM | 30 ± 12 μM | 57 μM (ref. 22) |
| ConA + mannan (4) | 10 ± 5 μM | 3 ± 1 μM | 3 μM (ref. 23) |
| ConA + fucose (5) | n.b. | n.b. | n.b. |
| ConA + galactose (1) | n.b. | n.b. | n.b. |
The data were in excellent agreement with prior studies. Subsequent experiments indicated that even the galactose monosaccharide (1) binding induced enough structural change to enable electrochemical detection. Furthermore, the potency differences between the nanomolar divalent LecA binder 2 and the micromolar galactose 1, due to a divalent binding mode of 2,19,25 were clearly detected. ConA and LecA selectivities were observed as expected (Fig. 3).
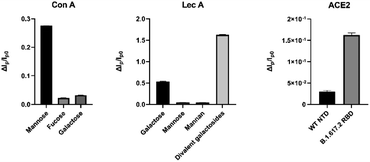 | ||
| Fig. 3 The selectivity of protein-based biosensor response against 10 μM of divalent galactosides, 100 μM mannose, mannan, galactose, and fucose, and 300 nM of spike proteins. N = 3. | ||
A sensor regeneration protocol was identified with 10 mM glycin/HCl at pH 2 for 30 minutes. Fig. 4 shows the simultaneous fit of three consecutive binding experiments between galactose and immobilized LecA. The current response gradually decreased after 3 regenerations.
To explore another application of the sensors, we choose the spike protein of SARS-CoV-2 RBD variants with respect to their binding affinity for their ACE2 target. Similar to the above experiments with the lectins, the electrochemical ACE2-functionalized biosensor exhibited a sensitive response to the presence of SARS-CoV-2 spike proteins, where the peak current proportionally changed with concentrations of SARS-CoV-2-SP. (Fig. S1 and S2†) and exhibited binding saturation. The determined dissociation constants were within the range of previously determined data (Table 2). Furthermore, no binding was observed with WT-NTD (Fig. 4), which is a consistent negative control.
| Analyte for SARS-CoV-2 RBD variants | Kd from CV | Kd from DPV | Reported Kd |
|---|---|---|---|
| CoV 1 | 26 ± 8 nM | 58 ± 19 nM | 185 nM (ref. 26) |
| CoV 2 | 37 ± 9 nM | 47 ± 17 nM | 44 nM (ref. 26) |
| 21.3 nM (ref. 27) | |||
| 20.5 nM (ref. 28) | |||
| 27.5 ± 4.8 nM (ref. 29) | |||
| B.1.351 (beta) | 31 ± 9 nM | 28 ± 10 nM | 23.1 ± 2.4 nM (ref. 29) |
| 5.8 ± 0.8 nM (ref. 30) | |||
| 19.7 nM (ref. 27) | |||
| 9.9 nM (ref. 27) | |||
| B.1.1.7 (alpha) | 19 ± 4 nM | 17 ± 5 nM | 11.8 ± 0.8 nM (ref. 29) |
| 2.4 ± 0.4 nM (ref. 30) | |||
| 6.2 nM (ref. 28) | |||
| B.1.617.2 (delta) | 6 ± 2 nM | 12 ± 3 nM | 21.5 ± 2.9 nM (ref. 29) |
| 4.6 nM (ref. 27) |
Conclusion
We have demonstrated the use of screen-printed electrodes for the binding detection and quantification of protein binding by proteins, and most notably, small molecules. The sensing scheme relies on the disruption of the redox conversion ([Fe (CN)6]3−/4−) triggered by complex formation between inhibitors with the immobilized proteins. With other label-free analytical system like SPR and BLI, typically the small molecule needs to be immobilized to detect binding, unless a higher end instrument is used. Interesting positive aspects of the method include the price as it only requires a potentiostat combined with off the shelf sensors. Furthermore, the speed of the measurements (ca. 70 seconds) and the low solvent volume required (currently 100 μL), are attractive as well as the portability and the sensitive detection. This work illustrates the potential of electrochemical sensors becoming affordable and enabling a whole host of possible applications in drug discovery and chemical biology.Experimental details
Chemicals and instruments
Graphene-gold nanoparticles modified Screen Printed Carbon Electrodes (DRP-110GPH-GNP) were purchased from Metrohm Autolab, the Netherlands. Concanavalin A (ConA) from Canavalia ensiformis type IV (104 kDa) and Lectin LecA from Pseudomonas aeruginosa (≥70%) were obtained from Sigma-Aldrich (Steinheim, Germany), 11-mercapto-1-undecanoic acid (MUA), dithiothreitol (DTT), glucose, mannose, mannan (from alkaline extraction; 48 kDa on average according to the supplier), galactose, N-(3-dimethyl aminopropyl)-N-ethyl carbodiimide hydrochloride (EDC), N-hydroxysuccinimide (NHS) and were supplied from Sigma-Aldrich (St. Louis, USA). Potassium ferricyanide (K3[Fe(CN)6]), potassium ferrocyanide (K4[Fe(CN)6]), MnCl2, CaCl2 and potassium chloride (KCl), were obtained from Sinopharm Chemical Reagent Co. Ltd (Shanghai, China). Bovine serum albumin (BSA) was purchased from Shanghai Sangon Biological Engineering Technology (China). Studied divalent galactosides were synthesized and purified in our laboratories.19 All reagents were used as supplied without further purification.Recombinant SARS-CoV-2 envelope proteins and their subunits were cloned using Gibson assembly from cDNAs encoding codon-optimized open reading frames of full-length SARS-CoV-2, B.1.1.7 and B.1.351 spikes (a kind gift of Rogier Sanders, Amsterdam Medical Centre, The Netherlands). The pCD5 expression vector as described previously was adapted to clone the SARS-2 (GenBank: MN908947.3), ectodomains (SARS-2 15-1213), N-terminal S1 (SARS-2 15–318) and RBDs (SARS-2 319–541) sequences coding for a secretion signal sequence, a GCN4 trimerization domain (RMKQIEDKIEEIESKQKKIENEIARIKK) followed by a seven amino acid cleavage recognition sequence (ENLYFQG) of tobacco etch virus (TEV), a super folder GFP and the Twin-Strep (WSHPQFEKGGGSGGGSWSHPQ FEK); IBA, Germany. SARS-CoV-2 RBD was mutated to B.1.617.2 (L452R and T478K) with PCR mutagenesis and was expressed in HEK293T as described previously. ACE2 (dimeric) was purchased from Addgene (#164222) and expressed in HEK293T cells as described previously.31
Phosphate buffer saline (PBS, 10 mM, pH 7.4) was used as a lectin immobilization buffer and washing buffer. PBS (10 mM) containing CaCl2 (1 mM) and MnCl2 (1 mM) were used as a binding buffer. All carbohydrate solutions were prepared with the binding buffer.
Tris HCl (0.1 M), 150 μM NaCl and 1 mM EDTA was used as SARS-CoV spike protein binding buffer and phosphate buffer saline (PBS, 10 mM, pH 7.4) was used as immobilization buffer and washing buffer. Ultra-pure water (18.2 MΩ cm) was used in all experiments.
Electrochemical measurements were conducted on a potentiostat (PGSTAT30 model, Metrohm Autolab, the Netherlands). As the electrode specification, the screen-printed electrode was used which contains a 4 mm width working electrode with a gold nanoparticles and graphene/carbon, auxiliary carbon electrode and silver reference electrode.
Fabrication of the electrochemical graphene-based biosensor
A 10 μL mixture of 1 μM MUA and 10 μM DTT was dropped onto the AuNPs/G/GCE surface of the electrode and placed in a refrigerator (4 °C) for 14 h to obtain the MUA/AuNPs/GGCE. The as-prepared electrode was activated in 100 μL of a freshly prepared solution containing 2 g L−1 EDC and 0.5 g L−1 NHS for 30 min to activate the carboxylic groups on MUA. Then, the activated electrode was immersed in 100 μL of lectin (10 μM) or ACE2 (100 nM) solution for 1 h. The lectin or ACE2 protein /MUA/AuNPs/G/GCE was immersed in 100 μL of 1% BSA for 30 min to inhibit nonspecific interactions and then the electrode was rinsed thoroughly to remove any adsorbed components. The lectin-based biosensor (lectin or ACE2 /AuNPs/G /GCE) was obtained and stored at 4 °C in PBS (pH 7.4).Electrochemical measurements
Electrochemical measurements were performed in 100 μL of analyte which includes 10 mM PBS containing 25 mM [Fe(CN)6]3−/4− and KCl (0.2 M). Cyclic voltammetry (CV) was used to monitor the fabrication process of the biosensor. All the CV voltammograms were recorded from −0.2 V to 0.8 V (vs. Ag/AgCl) at a scan rate of 0.05 V s−1. Differential pulse voltammetry (DPV) was used as the validation method. All DPV voltammograms were recorded −0.2 V to 0.5 V (vs. Ag/AgCl) at a modulation time 0.05 s, modulation amplitude 0.1 V and interval time 0.5 s. All electrochemical experiments were performed at room temperature (25 ± 1 °C).Binding studies
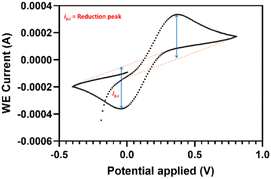
For Kd determination, running buffers containing increasing concentrations of inhibitors were used and for each studied concentration. Subsequently, the reduction peak current was measured with or without the dissolved binder present and the difference between these was determined (Δip). The obtained values were plotted versus the analyte concentrations.Two approaches for signal integration in cyclic voltammetry were performed. In first approach we used the signal integration within the Nova 2.1.5 software (Metrohm Autolab, the Netherlands). In this case the measured peak height is drawn perpendicular to the X-axis (lower blue line Fig. 5).
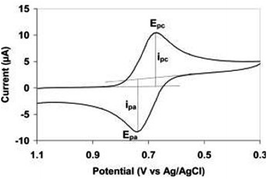
The second approach was based on Bard and Faulkner,32 in which case the peak height is perpendicular to the extrapolated base line (lower blue line Fig. 6).
The data were fitted within Graphpad 9.3.1. using the one-site specific binding model while the errors are based on the symmetric standard deviation option for the Kd. As can be seen in Fig. 7, a very small difference in Kd values is observed (12 vs. 13 nM) between Nova integration and Bard and Faulkner integration for inhibition of LecA with divalent galactosides in cyclic voltammetry so for convenience all binding experiments were reported based on the Nova integration.
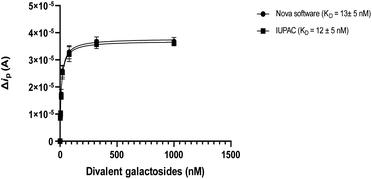 | ||
| Fig. 7 The comparison between two integration methods for the affinity study of Lec A and divalent galactosides. | ||
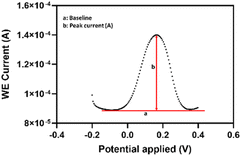
The DPV (Fig. 8) data were also reported and integrated based on the the Nova 2.1.5 software (Metrohm Autolab, the Netherlands).
Conflicts of interest
There are no conflicts to declare.Acknowledgements
We thank professor R. Sanders, (Amsterdam Medical Center), for making cDNAs encoding codon-optimized open reading frames of full-length SARS-CoV-2, B.1.1.7 and B.1.351 spikes available.References
- M. R. Volz and B. Moosmann, Anal. Chim. Acta, 2022, 1219, 339978 CrossRef CAS PubMed.
- Y. Wan, J. Zhao, J. He and X. Lou, Analyst, 2020, 145, 4276–4282 RSC.
- B. Cai and C. J. Krusemark, Angew. Chem., Int. Ed., 2022, 61, e202113515 CAS.
- R. Thevendran and M. Citartan, Talanta, 2022, 238, 122971 CrossRef CAS PubMed.
- V. Kairys, L. Baranauskiene, M. Kazlauskiene, D. Matulis and E. Kazlauskas, Expert Opin. Drug Discovery, 2019, 14, 755–768 CrossRef CAS PubMed.
- E. A. Smith, W. D. Thomas, L. L. Kiessling and R. M. Corn, J. Am. Chem. Soc., 2003, 125, 6140–6148 CrossRef CAS PubMed.
- H. Guo, H. Rabouw, A. Slomp, M. Dai, F. van der Vegt, J. W. M. van Lent, R. McBride, J. C. Paulson, R. J. de Groot, J. M. van Kuppeveld, F. E. de Vries and C. A. M. de Haan, PLoS Pathog., 2018, 14, e1007233 CrossRef PubMed.
- Y. Cao, B. Griffith, P. Bhomkar, D. S. Wishart and M. T. McDermott, Analyst, 2018, 143, 289–296 RSC.
- W. Li, C. Wang, H. Li, Z. Chen and M. Yan, Anal. Sci., 2021, 37, 1289–1294 CrossRef CAS PubMed.
- P. Bollella and E. Katz, Sensors, 2020, 20, 1–5 Search PubMed.
- D. F. Báez, T. P. Brito, L. C. Espinoza, A. M. Méndez-Torres, R. Sierpe, P. Sierra-Rosales, C. J. Venegas, C. Yáñez and S. Bollo, Microchem. J., 2021, 167, 106303 CrossRef.
- J. Qin, H. Hao, C. Yao, T. Jin and H. Yang, Int. J. Electrochem. Sci., 2020, 15, 639–650 CrossRef CAS.
- T. Tangkuaram, C. Ponchio, T. Kangkasomboon, P. Katikawong and W. Veerasai, Biosens. Bioelectron., 2007, 22, 2071–2078 CrossRef CAS PubMed.
- A. Gevaerd, C. E. Banks, M. F. Bergamini and L. H. Marcolino-Junior, Sens. Actuators, B, 2020, 307, 1–7 CrossRef.
- P. Nicholas, R. Pittson and J. P. Hart, Food Chem., 2018, 241, 122–126 CrossRef CAS PubMed.
- S. Sang, Y. Wang, Q. Feng, Y. Wei, J. Ji and W. Zhang, Crit. Rev. Biotechnol., 2015, 36, 1–17 CrossRef PubMed.
- M. Pumera, S. Sánchez, I. Ichinose and J. Tang, Sens. Actuators, B, 2007, 123, 1195–1205 CrossRef CAS.
- R. D’aurelio, I. E. Tothill, M. Salbini, F. Calò, E. Mazzotta, C. Malitesta and I. Chianella, Nanomaterials, 2021, 11, 3360 CrossRef PubMed.
- G. Yu, A. C. Vicini and R. J. Pieters, J. Org. Chem., 2019, 84, 2470–2488 CrossRef CAS PubMed.
- P. Zaree, J. Sastre Torano, C. A. M. de Haan, R. A. Scheltema, A. Barendregt, V. Thijssen, G. Yu, F. Flesch and R. J. Pieters, Glycobiology, 2021, 31, 1490–1499 CrossRef CAS PubMed.
- R. U. Kadam, M. Bergmann, M. Hurley, D. Garg, M. Cacciarini, M. A. Swiderska, C. Nativi, M. Sattler, A. R. Smyth, P. Williams, M. Camara, A. Stocker, T. Darbre and J.-L. Reymond, Angew. Chem., Int. Ed. Engl., 2011, 50, 10631–10635 CrossRef CAS PubMed.
- I. Ven Chang, H. Tsutsumi and H. Mihara, Mol. BioSyst., 2017, 13, 2222–2225 RSC.
- F. S. Coulibaly and B. B. C. Youan, Biosens. Bioelectron., 2014, 59, 404–411 CrossRef CAS PubMed.
- S. R. Sá, A. G. Silva Junior, R. G. Lima-Neto, C. A. S. Andrade and M. D. L. Oliveira, Talanta, 2020, 220, 121375 CrossRef PubMed.
- R. Visini, X. Jin, M. Bergmann, G. Michaud, F. Pertici, O. Fu, A. Pukin, T. R. Branson, D. M. E. Thies-Weesie, J. Kemmink, E. Gillon, A. Imberty, A. Stocker, T. Darbre, R. J. Pieters and J.-L. Reymond, ACS Chem. Biol., 2015, 10, 2455–2462 CrossRef CAS PubMed.
- J. Shang, G. Ye, K. Shi, Y. Wan, C. Luo, H. Aihara, Q. Geng, A. Auerbach and F. Li, Nature, 2020, 581, 221–224 CrossRef CAS PubMed.
- G. Augusto, M. O. Mohsen, S. Zinkhan, X. Liu, M. Vogel and M. F. Bachmann, Allergy: Eur. J. Allergy Clin. Immunol., 2022, 77, 111–117 CrossRef CAS PubMed.
- M. Vogel, G. Augusto, X. Chang, X. Liu, D. Speiser, M. O. Mohsen and M. F. Bachmann, Allergy: Eur. J. Allergy Clin. Immunol., 2022, 77, 143–149 CrossRef CAS PubMed.
- S. Kim, Y. Liu, M. Ziarnik, Y. Cao, X. F. Zhang and W. Im, bioRxiv, preprint, DOI:10.1101/2022.01.24.477633.
- C. Laffeber, K. de Koning, R. Kanaar and J. H. G. Lebbink, J. Mol. Biol., 2021, 433, 167058 CrossRef CAS PubMed.
- K. M. Bouwman, I. Tomris, H. L. Turner, R. van der Woude, T. M. Shamorkina, G. P. Bosman, B. Rockx, S. Herfst, J. Snijder, B. L. Haagmans, A. B. Ward, G. J. Boons and R. P. de Vries, PLoS Pathog., 2021, 17, e1009282 CrossRef CAS PubMed.
- A. J. Bard and L. R. Faulkner, Electrochemical Methods: Fundamentals and Applications, Wiley, New York, 2nd edn, 2001 Search PubMed.
Footnote |
| † Electronic supplementary information (ESI) available: Protein production, sensor fabrication, electrochemical measurements, binding data. See DOI: https://doi.org/10.1039/d3ra01029e |
| This journal is © The Royal Society of Chemistry 2023 |

