 Open Access Article
Stretching breakup of a conical liquid bridge with a moving contact line
Xiao-yu Xu,
Zheng Xu *,
Li-ding Wang,
Xiao-dong Wang,
Zhong-ping Sun and
Yu Yu
School of Mechanical Engineering, Dalian University of Technology, Dalian 116085, China. E-mail: xuzheng@dlut.edu.cn
First published on 2nd May 2023
Abstract
The stretching breakup of a conical liquid bridge is the core process of micro-dispensing. To precisely control the droplet loading and improve the dispensing resolution, a detailed study of bridge breakup with a moving contact line is required. A conical liquid bridge is established by an electric field and stretching breakup is investigated here. The effect of contact line state is investigated by examining the pressure at the symmetry axis. Compared to the pinned case, the moving contact line causes a shift of the pressure maximum from the bridge neck to top, and it facilitates the evacuation of the bridge top. For the moving case, factors affecting the contact line motion are then considered. The results show that the increase of the stretching velocity U and the decrease of the initial top radius Rtop accelerate the contact line motion. And the amount of contact line movement is basically constant. To analyze the influence of the moving contact line on bridge breakup, neck evolution is tracked under different U. An increase of U decreases the breakup time and increases the breakup position. Based on the breakup position and the remnant radius, the influences of U and Rtop on remnant volume Vd are examined. It is found that Vd decreases with an increase of U and increases with an increase of Rtop. Accordingly, different sizes of remnant volume can be obtained by adjusting U and Rtop. This is helpful for the optimization of liquid loading for transfer printing.
1 Introduction
A liquid bridge generally refers to a certain volume of liquid that is formed between two solid surfaces, and its stretching breakup is widely used in micro- and nanotechnology applications. For example, quantum dots can be carried by liquid bridges and selectively deposited on the top of sub-micrometer antennas by dip-pen nanolithography.1,2 Nanoliter bioreagents can be dispensed by the formation and breaking of liquid bridges for ultrasensitive biomolecule detection.3 Microdroplets dispensed by high-viscosity liquid bridges can also be applied in the selective imprinting of MOEMS devices4 and in the bonding process of micro parts.5 All these applications require precise control of transfer volume, so the study of stretching breakup of liquid bridges is of great importance.Generally, a liquid bridge is assumed to be cylindrical. However, the liquid bridge is more like a liquid cone in the dipping process since it is formed between the probe and the reservoir. In terms of liquid cone, there are two types of forming process. One is to dip the probe directly into the reservoir, whereby the liquid climbs along the sidewall of the probe, forming a conical liquid bridge as it is withdrawn. The other is based on our previously proposed electrically induced liquid loading method,6 where electrostatic force drives the liquid upward to form a conical liquid bridge. Compared to dipping, the liquid actively wets the probe and the bridge top is independent of probe size. For hydrophilic liquids, the wettability difference between the bridge ends is small and the bridge top is usually pinned during stretching.7 And for less hydrophilic liquids, the top contact line tends to de-pin and the moving contact line must be considered.
The moving contact line has an important effect on the breakup dynamics and liquid transfer of liquid bridges.8 With consideration of moving contact lines, a series of factors affecting bridge breakup, such as liquid properties, stretching velocity and boundary wettability, were investigated.9–12 It is found that the contact line movement is related to the competition between surface tension and viscous force.13 A high viscous force allows a greater interface deformation at the contact line, which delays its movement and affects the bridge volume transfer. The effect of stretching velocity on both contact line velocity and drop size was investigated.14 It is shown that the effect of stretching velocity on the moving contact line is negligible in the slowly receding stage. And in the rapid pinch-off stage, the critical radius before bridge breakup increases slightly with stretching velocity. Moreover, the influence of the wettability difference between the two bridge ends on contact line motion and transfer ratio has been investigated.15 Results show that the contact line at a less hydrophilic surface moves more and gains less liquid at lower stretching velocity. And at higher stretching velocity, this tendency weakens and the liquid bridge breaks symmetrically.
The above studies mainly concentrated on cylindrical or quasi-cylindrical liquid bridges. For a conical liquid bridge that forms by dipping, the moving contact line is usually not considered since the liquid is confined by the probe geometry.16–18 With the assumption of the bridge top attached to the edge of the probe, it was concluded that the remnant droplet first increases and then decreases with stretching velocity.19 Nevertheless, receding of the contact line was observed in dipping experiments and the results showed that the remnant volume remains constant at a high stretching velocity.20 As a result, the contact line state has an important effect on the volume transfer of a conical liquid bridge. However, less attention has been paid to the stretching dynamics of conical liquid bridges with a moving contact line.
Herein, the stretching breakup of a conical liquid bridge with a moving contact line is investigated. Based on the electrostatic loading method, a conical liquid bridge with a free-moving top is built and then stretched to breakup. To understand the effect of contact line state, the stretching process of the conical liquid bridge is analysed by examining the pressure distribution at the symmetry axis. In terms of a free-moving top, factors that affect the evolution of the top contact line are investigated. Furthermore, to explore the influence of a moving contact line on bridge breakup, neck evolution under different stretching velocities is analysed subsequently. Accordingly, the breakup position and remnant droplet radius are determined and the effect of stretching velocity and initial bridge top on the remnant droplet volume is examined.
2 Methods
2.1 Governing equations and simulation
A schematic of the initial conical liquid bridge is shown in Fig. 1. With the help of an external electric field between the probe and reservoir, an axisymmetric conical liquid bridge is formed by electrostatic force, as shown in Fig. 1a. The electric field is then removed after the bridge is built up. Herein the problem is the stretching breakup of the conical liquid bridge with a constant stretching velocity U, as shown in Fig. 1b.The liquid is assumed as incompressible with density ρ, viscosity μ, and surface tension coefficient γ. The initial top radius of the liquid bridge, denoted by Rtop, can be adjusted during the bridge-forming process. The bridge length is represented by L(t), and it is a function of time t during stretching breakup. The bridge top wets the probe with contact angle θ and its base joins the reservoir. Since the bridge top is not geometrically constrained, the contact line is allowed to move during the stretching breakup of the conical liquid bridge.
A 2D-axisymmetric numerical simulation based on the phase-field method is performed to characterize the stretching of the conical liquid bridge. The two-phase flow is described by Navier–Stokes equations:
 | (1) |
| ∇·u = 0 | (2) |
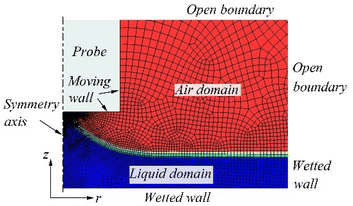
According to the experimental configuration, the probe is simplified to a semicylindrical shape with a radius of 200 μm with a distance of 140 μm from the initial air–liquid surface. And the lateral dimension of the geometry domain is set to ten times the radius of the probe to save computational efforts. Fig. 2 shows the geometry, boundary conditions, and the meshing of the 2D-axisymmetric simulation. The initial air–liquid interface is extracted from the experimental photo at the time that the established liquid bridge is stable.
For the boundary conditions, the bottom and side walls of the liquid domain are set as wetted walls with no-slip conditions. The side walls of the air domain are set as open boundaries and the probe walls are set as moving walls.
In addition, to model the moving contact line at the probe, Navier slip condition is used accompanied with a constant contact angle:21
 | (3) |
 | (4) |
 | (5) |
| ψ = −∇·ε2∇ϕ + (ϕ2 − 1)ϕ | (6) |
As the probe has an upward velocity U during the stretching process, the moving wall condition is applied to the probe wall:
| nwall·u = U | (7) |
Free quadrilateral elements with linear elements for pressure and quadratic elements for velocity are used to discretize the flow domain. The red mesh represents the air domain, the blue mesh represents the liquid domain, and the other colours represent the transition of air–liquid interface. To precisely describe the breakup of the conical liquid bridge, the air-liquid interface is tracked with refined mesh elements with a minimum mesh size of 0.5 μm.
A moving mesh interface is added to simulate the elevation of the probe. The meshes in both air and liquid domains are free to deform. For the probe bottom, the mesh velocity along the z direction is specified as the probe velocity (0.12–0.6 mm s−1). The symmetry axis, probe walls, and the right-hand boundaries are not allowed to move in the r direction. And the top and bottom boundaries of the geometry domain are not allowed to move in either r or z direction.
The 2D-axisymmetric model was solved by COMSOL and the velocity and pressure distributions are recorded at each time step.
2.2 Experiment setup
The liquid bridge is built up by an electric field between the probe of 200 μm radius and a high-viscosity liquid film. The probe is made of 304 stainless steel and used as a positive electrode. With a typical electric parameter of the voltage applied Up = 600 V, and the distance between the probe and the initial liquid interface dg = 140 μm, a conical liquid bridge is built. Once the liquid bridge with an initial top radius Rtop is acquired, the voltage is removed, and the probe is held for 2 seconds to form a stable conical liquid bridge. Then the probe is lifted, and the bridge is stretched at a constant velocity U. Due to the wide use of epoxy in the microelectromechanical systems industry, epoxy-based adhesives are chosen for the study. The main properties are listed in Table 1. The density is measured by weighing and the viscosity is measured by a viscosity meter (AR2000ex, TA Instruments, USA). The surface tension coefficient and contact angle are measured by a drop shape analyzer (DSA100, Kruss, Germany).| Density, ρ (g cm−3) | Viscosity, μ (Pa s) | Surface tension, γ (mN m−1) | Contact angle (°) | |
|---|---|---|---|---|
| Epoxy1 | 1.617 | 75 | 36.88 | 25.37 |
| Epoxy2 | 1.703 | 116 | 38.00 | 46.53 |
| Epoxy3 | 1.835 | 289 | 36.96 | 73.54 |
The receding of the top contact line is observed for both epoxy2 and epoxy3 during bridge stretching. However, the top contact line is pinned for the case of epoxy1 due to the small contact angle. So, epoxy2 and epoxy3 are chosen to study the stretching breakup of the conical liquid bridge with a moving contact line.
The simulation results and experimental photos of the stretching process of epoxy3 are shown in Fig. 3. In simulation, the contour of phase field equal to 0.5 is defined as the air-liquid interface. And the volume of remnant droplet is obtained by integrating πr2 along the axial direction, where r is the radial dimension of the air–liquid interface. Similarly, the remnant droplet in the experiment is divided into multiple cylinders in the axial direction. And the remnant volume is calculated by summing the volumes of the cylinders. More details can be found in our previous work.22,23
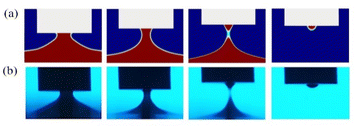 | ||
| Fig. 3 Stretching breakup of the conical liquid bridge. (a) Simulation and (b) experiment.6 | ||
3 Results and discussion
3.1 Effect of contact line state on bridge stretching
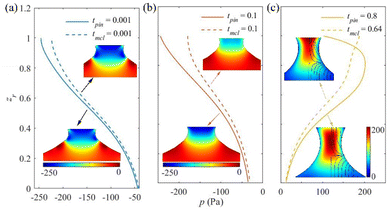
Different from the pinned contact line, the moving case can lead to a change of breakup profile and transfer ratio. To understand the influence of contact line motion, we examine the pressure distribution inside the bridge during stretching. Fig. 4 shows the pressure variation at the symmetry axis of the conical liquid bridge. For convenience, the relative pressure is used here, the reference pressure being 1 atm. To compare the pressure at different times, the nondimensional axial height zr is derived from the actual height z versus the instantaneous length of the conical liquid bridge L(t).At the very beginning of stretching (t = 0.001 s), the pressure inside the bridge is negative, and the bridge top has a minimum pressure of −246 Pa and −223 Pa for the pinned case and the moving case, respectively, as shown in Fig. 4a (the hydrostatic pressure caused by gravity is about 0 to −2 Pa). The insets give the corresponding pressure distribution inside the bridge. It can be seen that there is a pressure gradient at the top contact line that pumps the liquid moving inside. With the stretching of the liquid bridge, the pressure minimum in both cases remains at the bridge top at t = 0.1 s. In Fig. 4b, the pressure at the bridge top increases slightly from −246 to −243 Pa for the pinned case. For the moving case, the pressure at the bridge top increases to −178 Pa and it can be seen from the inset that the pressure gradient is mainly in the radial direction, leading to a further decrease of the bridge top.
Fig. 4c shows the pressure at the time that flow separation occurs inside the conical liquid bridge. Streamlines are plotted at the right-hand side of the conical liquid bridge in the insets. Flow separation occurs at t = 0.8 s and t = 0.64 s for the pinned and the moving cases, respectively. In the pinned case, the maximum pressure rises from bridge bottom to about 80% of bridge length with a value of 201 Pa. From the inset, it can be seen that the pressure maximum is around the bridge neck. For the moving case, the maximum pressure rises from bridge bottom to bridge top, with a value of 187 Pa.
From the above analysis, the pressure maximum shifts from bridge neck (the pinned case) to bridge top due to the rapid decrease of bridge top radius for the moving case. It accelerates the evacuation of liquid from the upper part of the bridge and it is beneficial for reducing the remnant droplet volume. To gain more insight into stretching breakup with the moving contact line, factors affecting the contact line evolution are considered below.
3.2 Factors affecting contact line evolution
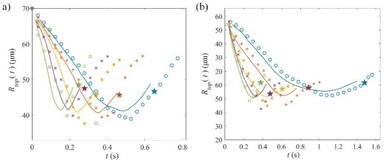
As the stretching velocity increases, the contact line velocity increases accordingly. Fig. 5a and b show the effect of stretching velocity U (ranges from 0.12 to 0.6 mm s−1) on the evolution of top contact line for epoxy2 and epoxy3, respectively. Solid lines represent simulation results, scatter points represent experimental results, and the pinch-off time is marked by pentagrams. It can be seen that the 2D simulation can predict this trend well and give quantitative predictions of contact line motion. In Fig. 5a, it can be seen that the top contact line radius decreases rapidly in the early stage and increases at a later time. This may be caused by the high pressure at the symmetry axis when flow separation occurs. Fig. 4c shows that there exists a pressure gradient that drives the liquid toward the contact line. Therefore, the contact line radius increases before the pinch off of the conical liquid bridge. The velocity of contact line increases greatly with an increase of U. Nevertheless, the final radius of the bridge top is basically unchanged since the breakup time decreases accordingly. In addition, the evolution of the contact line tends to overlap at higher stretching velocity, especially at the beginning of stretching. Since the initial contact line motion largely sets the overall bridge shape and the transfer volume,21 it is suggested that the variation of remnant volume decreases at higher U. Fig. 5b shows that the top contact radius of epoxy3 evolves with the same trend as epoxy2. And due to the higher viscosity of epoxy3, its pinch-off times are larger than those of epoxy2.In addition to the stretching velocity, the initial top radius also affects the contact line movement. The evolution of top contact radius at U = 0.12 mm s−1 for different initial Rtop is given in Fig. 6. Fig. 6a and b give the experimental and numerical results of epoxy2 and epoxy3, respectively. Different initial Rtop sets were chosen due to the different properties of epoxy2 and epoxy3. To compare the evolution of contact radius, Rtop(t) is dimensionless with different initial Rtop. And the pinch-off time is marked by pentagrams. As shown in Fig. 6, the evolution trend of contact radius is the same as in Fig. 5. In addition, it can be seen that the receding velocity of contact radius decreases slightly as Rtop increases. This may be caused by the fact that the increased contact area between the bridge and the probe drives more liquid upward at the beginning, slowing down the deformation of the bridge top and the movement of the contact line.
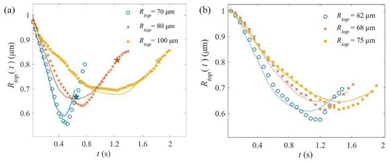 | ||
| Fig. 6 Effect of bridge initial top radius Rtop on the evolution of contact line radius for (a) epoxy2 and (b) epoxy3. | ||
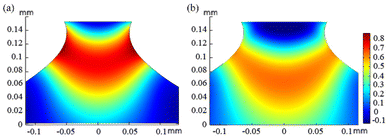
Fig. 7 shows the vertical velocity gradient inside the liquid bridge of epoxy3 with Rtop = 62 and 75 μm. Comparing Fig. 7a with 7b, it can be seen that small initial Rtop leads to a large neck curvature, and it increases the vertical velocity gradient near the bridge neck. As a result, the air–liquid interface and top contact line contract rapidly. It is also noted that in Fig. 7b, the vertical velocity gradient near the top contact line is mainly distributed in the radial direction. This means that the momentum transfer at the contact line is slow compared to the inside of liquid bridge. And it is suggested that the bridge with large initial Rtop is more likely to de-pin during stretching. Nevertheless, the vertical velocity gradient changes slowly in the axial direction, so the contact line velocity is slower than that for a small initial Rtop.
3.3 Neck evolution of a conical liquid bridge with a moving contact line
Since the evolution of the bridge neck is crucial for the breakup behaviour, the neck evolution process is examined numerically. The bridge neck is defined at the position with the minimum radius of the air–liquid interface. The simulation results of bridge neck evolution during breakup are shown in Fig. 8. Fig. 8a gives the radial evolution of bridge neck rneck at different U. It can be seen that rneck contracts at a relatively constant velocity during the early breakup, and it decreases rapidly when the bridge is close to breakup. The dashed line in Fig. 8a represents rneck evolution for the case of the pinned contact line at U = 0.12 mm s−1. It can be seen that rneck contracts at a slower rate compared to the case of a moving contact line, leading to a longer breakup time and breakup length. Moreover, rneck contracts at a higher rate with an increase of stretching velocity U. Corresponding to Fig. 5, it indicates that the increase of contact line velocity accelerates the contraction of the bridge neck, thus reducing the breakup time.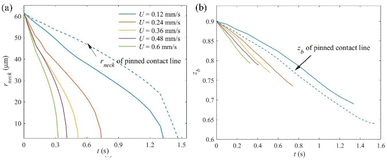 | ||
| Fig. 8 Bridge neck evolution during breakup: (a) neck radius rneck and (b) relative neck position zb. | ||
Fig. 8b shows the evolution of relative neck position zb (the axial position of bridge neck versus the instant bridge length L(t)). The zb decreases with the stretching of the conical liquid bridge. This means that the bridge neck cannot catch up with the bridge top and gradually falls down during stretching. The dashed line in Fig. 8b shows the evolution of zb for the case of pinned contact line at a stretching velocity of 0.12 mm s−1. Compared with the moving contact line, zb decreases at a higher rate with a longer bridge breakup time tb. As a result, the moving contact line in stretching breakup leads to a higher breakup position, which is beneficial for acquiring a smaller remnant droplet. Moreover, the decrease rate of zb increases with an increase of U. However, the breakup position tends to increase with U due to the decrease of tb.
3.4 Influence of U and Rtop on remnant droplet volume
The breakup position directly affects the height of the remnant droplet and determines the droplet volume together with the remnant radius. For the stretching process shown in Fig. 3, the upper part of the bridge is similar to an inverted liquid cone at the time that the bridge is close to breakup. And the remnant droplet volume should be equal to the volume of the inverted liquid cone. Fig. 9a shows the influence of stretching velocity U on the size of the inverted cone of epoxy2 when the bridge is close to breakup. It can be seen that the remnant radius Rd varies slightly with the increase of U. And the length Ld of the inverted cone derived from the relative position of bridge neck zb and the breakup length Lb (Ld = Lb × (1 − zb)) decreases with the increase of U. Therefore, the remnant volume decreases with the increase of U. In Fig. 9b, Rd and Ld both increase with the increase of Rtop. Therefore, the remnant volume Vd increases rapidly with Rtop. Fig. 10 gives the influence of U and initial Rtop on the size of the inverted cone of epoxy3. The trend of experiment results is the same as that of epoxy2. The stretching velocity U and initial Rtop have a negligible influence on the amount of variation in the top contact radius. And Ld decreases with an increase of U and a decrease of Rtop.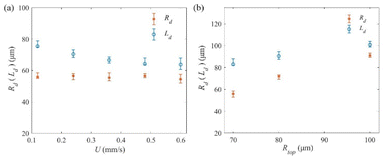 | ||
| Fig. 9 Influence of (a) stretching velocity U and (b) initial top radius Rtop on remnant droplet radius Rd and length Ld of epoxy2. | ||
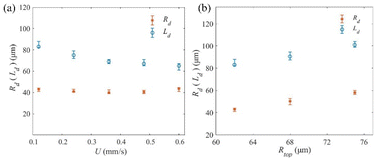 | ||
| Fig. 10 Influence of (a) stretching velocity U and (b) initial top radius Rtop on remnant droplet radius Rd and length Ld of epoxy3. | ||
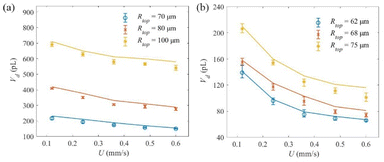
Fig. 11 shows the dependence of Vd on U for epoxy2 and epoxy3. It can be seen that the remnant volume Vd decreases with an increase of stretching velocity U, and this trend slows down at higher velocity, as discussed in section 3.2. Also, a change of Rtop does not change the dependence of Vd on U, but the remnant volume Vd increases with the increase of Rtop. Accordingly, different sizes of remnant volume can be obtained by adjusting the stretching velocity U and initial top radius Rtop. In addition, the 2D simulation can predict the droplet volume quantitatively and can be used to understand the breakup process for conical liquid bridges. And it is helpful for the optimization of liquid loading for transfer printing.
4 Conclusions
The stretching breakup of a conical liquid bridge with a moving contact line is investigated in detail. The key findings of this work are as follows:(1) The effect of contact line state on the stretching liquid bridge is analysed. Compared to the pinned case, the moving contact line causes a shift of pressure maximum from bridge neck to bridge top. As a result, the lower part of the bridge barely pumps liquid upward and it is beneficial for reducing the remnant droplet volume.
(2) An increase in stretching velocity U accelerates the movement of the contact line, and an increase in initial top radius Rtop slows down the movement of the contact line. Nevertheless, the amount of contact line movement remains basically constant due to the changes in breakup time.
(3) For stretching breakup of a conical liquid bridge with a moving contact line, an increase in U leads to a decrease of remnant volume Vd, and an increase in Rtop increases Vd. Therefore, remnant droplets of different volume can be obtained by regulating U and Rtop. This is helpful in achieving a quantitative droplet loading for the optimization of transfer printing.
Author contributions
Xiao-yu Xu: writing – original draft, Investigation. Zheng Xu: writing – review & editing, conceptualization, funding acquisition. Li-ding Wang: supervision. Xiao-dong Wang: resources. Zhong-ping Sun: data curation. Yu Yu: data curation.Conflicts of interest
There are no conflicts to declare.Acknowledgements
The authors wish to acknowledge the National Natural Science Foundation of China (No. 51975102), LiaoNing Revitalization Talents Program (XLYC2002020), and Dalian Science & Technology Innovation Fund (2020JJ25CY018).References
- N. Farmakidis and K. A. Brown, Quantifying Liquid Transport and Patterning Using Atomic Force Microscopy, Langmuir, 2017, 33, 5173–5178 CrossRef CAS PubMed.
- F. Dawood, J. Wang, P. A. Schulze, C. J. Sheehan, M. R. Buck, A. M. Dennis, S. Majumder, S. Krishnamurthy, M. Ticknor, I. Staude, I. Brener, P. M. Goodwin, N. A. Amro and J. A. Hollingsworth, The Role of Liquid Ink Transport in the Direct Placement of Quantum Dot Emitters onto Sub-Micrometer Antennas by Dip-Pen Nanolithography, Small, 2018, 1801503, 1–10 Search PubMed.
- X. Chen, Y. Liu, Q. Xu, J. Zhu, S. F. Poget and A. M. Lyons, High-Precision Dispensing of Nanoliter Biofluids on Glass Pedestal Arrays for Ultrasensitive Biomolecule Detection, ACS Appl. Mater. Interfaces, 2016, 8, 10788–10799 CrossRef CAS PubMed.
- J. Pribosek, M. Zauner, J. Bardong, A. Binder, P. Maierhofer, A. Bergmann and G. Rohrer, Vacuum-Assisted Selective Adhesive Imprinting for Photonic Packaging of Complex MOEMS Devices: Assembly of Miniaturized Particle Sensor, IEEE Sens. J, 2020, 20, 15053–15060 CAS.
- P. Peng, W. Zhou, H. Yu, Q. Hao, B. Peng and X. He, A study of partial layout of adhesive on the thermal drift of MEMS capacitive accelerometers, Int. J. Mod. Phys. B, 2017, 31, 1–8 Search PubMed.
- X. Y. Xu, Z. Xu, X. D. Wang, S. C. Qin, Y. W. Qian, L. D. Wang and J. S. Liu, Loading a High-Viscous Droplet via the Cone-Shaped Liquid Bridge Induced by an Electrostatic Force, Langmuir, 2021, 37, 2334–2340 CrossRef CAS PubMed.
- X. Y. Xu, Z. Xu, X. D. Wang, L. D. Wang, S. C. Qin, J. S. Liu and Y. Yu, Breakup mechanism of the electrically induced conical liquid bridge, Phys. Fluids, 2022, 34, 52118 CrossRef CAS.
- S. Kumar, Liquid Transfer in Printing Processes: Liquid Bridges with Moving Contact Lines, Annu. Rev. Fluid. Mech., 2015, 47, 67–94 CrossRef.
- C. Gupta, G. A. Mensing, M. A. Shannon and P. J. A. Kenis, Double transfer printing of small volumes of liquids, Langmuir, 2007, 23, 2906–2914 CrossRef CAS PubMed.
- Y. Tourtit, T. Gilet and P. Lambert, Rupture of a Liquid Bridge between a Cone and a Plane, Langmuir, 2019, 35, 11979–11985 CrossRef CAS PubMed.
- H. Chen, T. Tang, H. Zhao, K. Y. Law and A. Amirfazli, How pinning and contact angle hysteresis govern quasi-static liquid drop transfer, Soft Matter, 2016, 12, 1998–2008 RSC.
- A. Amirfazli, T. Tian and H. Chen, Mechanism of liquid transfer between two surfaces and the role of contact angles, Soft Matter, 2014, 10, 2503–2507 RSC.
- S. Dodds, M. da Silveira Carvalho and S. Kumar, Stretching and slipping of liquid bridges near plates and cavities, Phys. Fluids, 2009, 21(9), 092103 CrossRef.
- B. Qian and K. S. Breuer, The motion, stability and breakup of a stretching liquid bridge with a receding contact line, J. Fluid Mech., 2011, 666, 554–572 CrossRef.
- H. Chen, T. Tang and A. Amirfazli, Effects of surface wettability on fast liquid transfer, Phys. Fluids, 2015, 27(11), 112102 CrossRef.
- P. Marmottant and E. Villermaux, Fragmentaion of stretched liquid ligaments, Phys. Fluids, 2004, 16, 2732–2741 CrossRef CAS.
- E. S. Benilov and A. Oron, The height of a static liquid column pulled out of an infinite pool, Phys. Fluids, 2010, 22(10), 102101 CrossRef.
- T. Ward, Evaporation driven detachment of a liquid bridge from a syringe needle in repose, Phys. Fluids, 2020, 32(8), 084105 CrossRef CAS.
- X. Wei, J. Rivero-Rodríguez, J. Zou and B. Scheid, Statics and dynamics of a viscous ligament drawn out of a pure-liquid bath, J. Fluid Mech., 2021, 922, 1–30 Search PubMed.
- Y. H. Jang, K. Lee and Y. K. Kim, Controlled volume transfer and lens shape formation by liquid bridge disconnection, Appl. Phys. Lett., 2012, 100, 1–4 Search PubMed.
- C. H. Huang, M. S. Carvalho and S. Kumar, Stretching liquid bridges with moving contact lines: Comparison of liquid-transfer predictions and experiments, Soft Matter, 2016, 12, 7457–7469 RSC.
- P. Zhu, Z. Xu, X. Wang, Y. Zheng, X. Xu and L. Wang, Influence of initial distance between needle tip and substrate on contact dispensing of high-viscosity adhesive, Int. J. Adhes. Adhes., 2018, 85, 23–28 CrossRef CAS.
- P. Zhu, Z. Xu, X. Xu, D. Wang, X. Wang, Y. Yan and L. Wang, Squeezing dynamic mechanism of high-viscosity droplet and its application for adhesive dispensing in sub-nanoliter resolution, Micromachines, 2019, 10(11), 728 CrossRef PubMed.
| This journal is © The Royal Society of Chemistry 2023 |


