 Open Access Article
Research on the optimum carbonization process of walnut shell based on dynamic analysis
Yang Liu ,
Yungang Wang*,
Li Zou,
Yanyuan Bai and
Haoran Xiu
Key Laboratory of Thermo-Fluid Science and Engineering (Ministry of Education), Xi'an Jiaotong University, Xi'an 710049, Shaanxi, China. E-mail: ygwang1986@xjtu.edu.cn
First published on 2nd May 2023
Abstract
Walnut shell is characterized by high yield, high fixed carbon content, and low ash content. In this paper, the thermodynamic parameters for walnut shell during the carbonization process is investigated, and its carbonization and mechanism are discussed. Then, the optimal carbonization process of walnut shell is proposed. Results demonstrated that the comprehensive characteristic index of pyrolysis first increases and then decreases with the increase of heating rate and reaches the peak at about 10 °C min−1. Note that the carbonization reaction intensifies at this heating rate. The carbonization process of walnut shell is a complex reaction involving multiple steps. It decomposes hemicellulose, cellulose, and lignin in stages, and the activation energy of this process gradually increases. The simulation and experimental analyses showed that the optimal process presents a heating time of 14.8 min, final temperature of 324.7 °C, holding time of 55.5 min, particle size of material of about 2 mm, and optimum carbonization rate of 69.4%.
1 Introduction
Carbonization is an effective and simple process for producing high-quality carbon from raw materials with high carbon content.1 Researchers have started using low-cost waste, mainly agricultural by-products, as precursors to produce biomass carbon because of the high cost of producing commercial carbon from coal and wood.2 Walnut shell is a representative of fruit shell and excellent raw material for making carbon materials because of its high fixed carbon content, high economic value, and low ash contents. Therefore, walnut shell is a good carbonization materials, and it is meaningful to research the carbonization mechanism and optimal process.3 Carbonization kinetics is analyzed in this paper to explain the carbonization process from the mechanism level and explore the optimal carbonization process.Many researchers have used thermal analysis methods to explore the thermodynamic behavior of biomass carbonization and pyrolysis in recent years. The properties of different carbon and carbonization rate under the same carbonization conditions are obviously different.4 Biochar retains some physical and chemical characteristics of the raw material. And the biomass with high lignin content has a higher carbonization rate under the same carbonization process.5,6 Wu et al. carried out stepwise pyrolysis experiments on biomass and indicated that the chemical composition and pyrolysis temperature range of biomass exert important effects on pyrolysis liquid products.7 There are little ash and tar during the wood materials carbonization process, so they are a carbonization material with high carbonization rate.8 However, due to the extensive use of wood materials, a large number of trees will felled, which is not conducive to environmental protection.9 While herbal and straw materials generate higher tar content, more ash, and lower carbonization rate, so it's not suitable for use as carbonization materials.10,11 Pham et al. used wheat straw particles for oxidative pyrolysis and showed that coke accounts for 39.56% of the total energy of straw and its carbonization rate in straw is 28.6%.12 Among the carbonization materials, walnut shell is slightly inferior to wood materials and far superior to agricultural and forestry wastes. It is significant to research the carbonization process of walnut shell. According to previous studies, the main factors affecting the carbonization process include: carbonization temperature, carbonization heating rate, carbonization holding time, carbonization atmosphere, water content of materials, etc. It is found that the carbonization temperature increase, the carbonization rate gradually decreased. Meanwhile, the density of biomass carbon increased, and the hydrophobicity of biomass carbon improved.13 We can be seen that the quality and energy loss during the carbonization process increase with the initial biomass water content, and the calorific value of biomass materials is significantly improved. As the holding time increases, the decomposition amount of biomass components gradually increases, and the carbonization rate decreases.14–16 The heating rate also has an impact on biomass carbonization. As the heating rate is higher, the biomass pyrolysis is faster, and the lower the carbonization rate. Moreover, the higher the heating rate, the larger pores will be formed on the carbon surface.17 Xie et al. applied thermogravimetric analysis to analyze the pyrolysis of typical biomass resources in various subtropical zones and demonstrated that the heating rate exerts a weak effect on the activation energy and a strong impact on the carbonization rate.18 In addition, the carbonization atmosphere also has an impact on the properties of biochar. Currently, the main carbonization atmospheres include N2, CO2, and air. The calorific value of biochar under N2 atmosphere is higher than that under air atmosphere,19 and the weight loss of various biomass under N2 atmosphere is lower than that under CO2 atmosphere.20 Thermodynamic analysis is a common method for studying biomass carbonization, mainly including thermogravimetric method, thermogravimetric-Fourier transform infrared spectrum method, and other methods. Through thermogravimetric research, researchers find that the weight loss of biomass carbonization mainly occurs between 200 to 350 °C, and changes of heating rate have a small impact on activation energy, and the activation energy increases with conversion.21,22 Ma et al. assessed the pyrolysis of Enteromorpha prolifera using TG-FTIR and revealed that the main weight loss occurs in the range of 200–350 °C and the activation energy of pyrolysis increases with the increase of conversion.23 Zhu et al. investigated the weight loss process of rice husk at different heating rates using thermogravimetric Fourier transform infrared spectroscopy experiments and demonstrated that the maximum weight loss rate and infrared absorption peak intensity changed minimally with the heating rate.24 Some scholars have conducted research on the pH of biochar and find that the pH of biochar produced under different carbonization processes varies greatly, and the pH increases with carbonization temperature.25,26 According to the carbonization temperature, the carbonization process is mainly divided into high-temperature carbonization and low-temperature carbonization. Currently, the main focus of carbonization is low-temperature carbonization. By comparing high-temperature carbonization with low-temperature carbonization, it is find that the carbon obtained in a short time at low temperature has a higher carbonization rate and higher calorific value.27
Previous studies showed that a large number of agricultural and forestry wastes are used as raw materials for carbonization. However, studies on fruit shell are limited. Existing studies typically compare and analyze the carbonization results to obtain the optimal raw materials for carbonization but not from the carbonization mechanism level. Fruit shell is a common biomass waste from a wide range of sources that presents high utilization value. Hence, exploring representative fruit shell is necessary. Accordingly, walnut shell is used as the research object in this work to analyze the thermodynamic parameters. Moreover, the optimal carbonization process is obtained through experiment and simulation analyses.
2 Material and methods
2.1 Source of raw materials
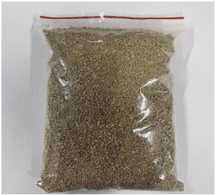
Biomass pyrolysis technology is suitable for biomass carbonization because it considers the types, distribution characteristics, and economy of biomass resources, and the raw material of carbonization technology is mainly fruit shell waste.28 Walnuts have a certain scale in the food processing industry. The output of walnut shells is large, unreasonably utilized, and treated as garbage, thereby subjecting these shells to incineration.Walnut is a widely planted economic tree species in Shaanxi Province. A large amount of walnut shell waste will be produced after deep processing. Hence, walnut shells in Weinan, Shaanxi Province are used as the raw material in this study (Fig. 1).
Table 1 shows that the ash content of walnut shell is low and the fixed carbon content is high. The carbonization process of walnut shell is suitable for carbonizing raw materials because it will produce only a small amount of polluting gases and solid waste without requiring other means to inhibit the production of additional products.
| Material | Proximate analysis/wt% | Elemental analysis/wt% | Qnet,ar/MJ kg−1 | |||||||
|---|---|---|---|---|---|---|---|---|---|---|
| Aad | Vad | Mad | FCad | C | H | O | N | S | ||
| a Where Aad is air drying based ash/wt%, Vad is air dried volatile matter/wt%, Mad is air drying basis moisture/wt%, FCad is air dried fixed carbon/wt%, Qnet,ar is lower calorific value. | ||||||||||
| Walnut shell | 0.28 | 70.73 | 7.77 | 21.22 | 48.4 | 6.18 | 44.29 | 0.33 | 0.01 | 17.44 |
2.2 Thermogravimetric experiment method
At present, almost all industrial fields are directly related to thermal analysis, and thermal analysis technology is typically used in many fields, such as physics, chemistry, and chemical engineering.29 Thermal analysis explores the physical and chemical phenomena of a substance during heating or cooling and the energy and mass changes involved. Thermal analysis technology can be used to analyze the thermal behavior of a substance.30The heating rate is an important factor that affects carbonization, pyrolysis, carbonization efficiency, and carbon quality. The steps and details of carbonization as well as the carbonization process and mechanism can be analyzed by changing the heating rate of the thermogravimetric experiment.
The raw material of 100 mesh walnut shell powder in the experiment is obtained after drying in an air blast drying oven at 105 °C for 12 hours. The samples are analyzed using thermogravimetric analysis with a NETZSCH thermobalance to measure the mass change during the carbonization and pyrolysis of materials accurately.
Samples are heated from room temperature to 800 °C at a heating rate of 5, 10, 20, and 30 °C min−1. About 10 mg of the sample is taken, high-purity nitrogen is used for carbonization, and the flow rate is 100 mL min−1 in each experiment.
2.3 Dynamic analysis method
The carbonization of walnut shell is a complex reaction process. Ea and A can be solved using different methods. The heating rate of the experiment can be divided into single and multiple heating rate methods. The difference reaction denotes the number of curves on the graph. The single heating rate method presents only one curve, whereas the multiple heating rate method exhibits multiple curves. Thermal analysis data of the same conversion rate is usually used to calculate the activation energy in the multi-heating rate method, which is also known as the equal conversion method.The iso-conversion method of various heating rates is used for kinetic analysis in this study. Formula (1) proposed by Starnk is used for kinetic analysis and calculation.31
 | (1) |
2.4 Optimum method of low temperature carbonization
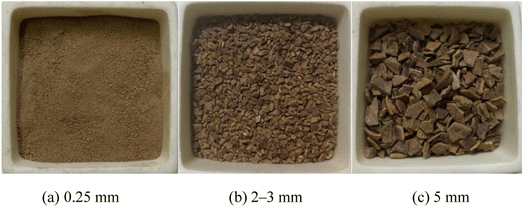
Determining the suitable carbonization conditions is crucial in obtaining high carbonization rate and preparing biochar for the production of activated carbon or for other uses. The carbonization rate is closely related to the carbonization process. Carbonization at low temperatures, such as those below 500 °C, should be adopted for fruit shell biomass with high lignin content to obtain high carbon output.Dried walnut shell particles are used in the carbonization experiments of this study. The heating rate range is 0–30 °C min−1, temperature range is 300–500 °C, holding time is 20–60 min, and particle size is 0.25–5 mm. This study aims to assess the influence of the change of walnut shell carbonization process parameters on the yield of walnut shell carbon. The influence of process parameters on the yield of walnut shell carbon is examined using RSM, and the optimal process parameters are optimized. The results can provide a reference for determining a reasonable carbonization process route of walnut shell.
Design Expert software is used according to the single-factor experiment results. Four independent variables, namely, heating up time (X1, min), final temperature (X2, °C), holding time (X3, min), and material particle size (X4, mm), are taken. Carbonization rate (q, %) is the response value. The Box–Behnken design model is adopted to design the four-factor three-level experiment, and the response surface analysis method is used to design the experimental conditions (Table 2).
| Factor | Level | ||
|---|---|---|---|
| Low (−1) | Central (0) | High (+1) | |
| a According to the RSM experiment design, 25 sets of working conditions of heating up time, final temperature, holding time, and material particle size are obtained. | |||
| X1 | 0 | 15 | 30 |
| X2 | 300 | 400 | 500 |
| X3 | 20 | 40 | 60 |
| X4 | 0.25 | 2.625 | 5 |
3 Results and discussion
3.1 Analysis of the thermogravimetric results
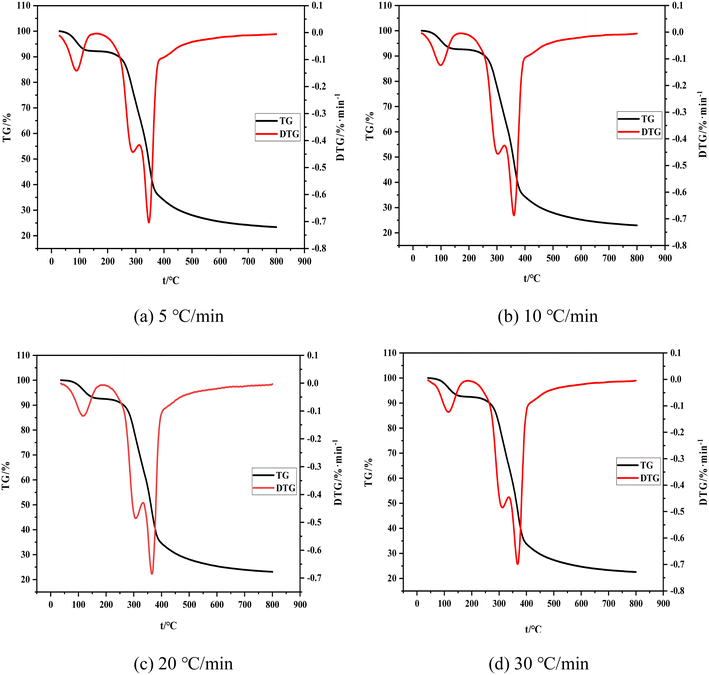
The change trend of TG and DTG curves is consistent with the change of the heating rate. The whole process can be divided into the following stages. (1) The drying stage is performed from room temperature to about 200 °C. The weight loss rate of the material reaches nearly 8% with the increase of temperature, as determined by the combined water content of the raw material itself. (2) Volatilization analysis is conducted from 200 °C to 340 °C, at which time the weight loss rate of the material reaches nearly 40% and some raw material components (hemicellulose, a small amount of cellulose and lignin) decompose to produce volatile carbon monoxide, hydrogen, and other small-molecular gases. The endothermic reaction in the first and second stages consumes a considerable amount of heat. These research results are consistent with the conclusions of ref. 32. (3) The carbonization stage is implemented from 340 °C to 500 °C. The weight loss rate of raw materials is nearly 75%. Note that the weight loss of shell raw materials is evident at this stage, and the reaction is violent. Different dehydration and depolymerization reactions occur and chemical bonds between molecules are continuously broken and linked due to the varying structures of raw material components (cellulose and lignin). Depolymerization can produce gases, such as carbon monoxide, carbon dioxide, and methane, and the polymer component fractal result of condensation is shell carbon. The raw material in this stage mainly undergoes an exothermic reaction without external heat supply. (4) The slow decomposition stage occurs from about 500 °C to 800 °C. The change in the weight loss rate is minimal because it remains unaffected by the heating rate. The final weight loss rate is about 77%. The mass changes in this stage because of the cleavage of a small amount of C–C and C–H bonds.33 Note that the boundary between these four stages is unclear and some processes may be carried out alternately due to the external conditions of heating and the type of raw materials.
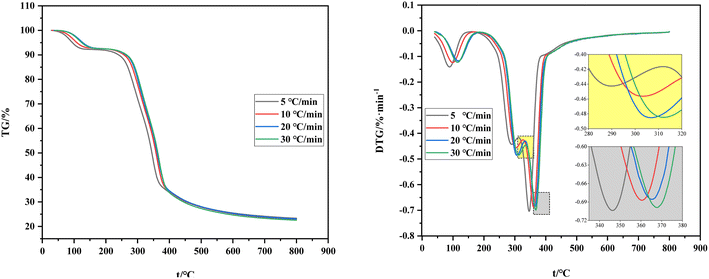
Fig. 4 shows the comparison of TG and DTG curves under four heating rates. The shift of the TG curve to the right with the increase of the heating rate is due to the poor thermal conductivity of the shell raw material and the sufficient reaction time required for carbonization and volatilization analysis. Hence, a high heating rate indicates that the corresponding reaction can only occur at a high temperature and result in a certain delay. The reaction temperature range and its peak temperature also demonstrate remarkable temperature side shift phenomenon with the rise of the heating rate. Meanwhile, the lag in the carbonization process is caused by the reaction lag.
To sum up, the influence of the heating rate on its weight loss speed, maximum weight loss rate, and weight loss rate is unclear and only presents a lag effect. Therefore, judging the effect of the heating rate on carbonization and pyrolysis reactions by only considering the change rules of TG and DTG curves is unreasonable. Previous studies only focused on the initial temperature of carbonization, maximum weight loss rate of carbonization, temperature corresponding to the maximum rate, or analysis of the release characteristic index of carbonization products while ignoring the impact of the initial and end temperatures of carbonization and average weight loss rate. This incomplete research system fails to reflect the carbonization process comprehensively. Therefore, a comprehensive characteristic index of carbonization pyrolysis is required to evaluate the whole carbonization process.34,35
 | (2) |
P comprehensively considers the maximum weight loss rate, average weight loss rate, initial temperature of carbonization, carbonization range, and maximum weight loss rate; proportional to the maximum weight loss rate, maximum weight loss speed, and average weight loss rate; and inversely proportional to the initial carbonization temperature and thermal decomposition temperature range. These features are consistent with the description of the relationship between the carbonization reaction activity and characteristic parameters in the literature. A high P indicates an intense carbonization reaction of the fruit shell and reaction activity.
| Heating rates | 5 °C min−1 | 10 °C min−1 | 20 °C min−1 | 30 °C min−1 |
|---|---|---|---|---|
| Td/(°C) | 228.5 | 247.8 | 259.2 | 267.3 |
| Te/(°C) | 389.9 | 395.1 | 405.3 | 416.6 |
| TP/(°C) | 346.3 | 361.7 | 365.2 | 367.7 |
| ΔWmax (%) | 51.1 | 52.7 | 52.3 | 52.9 |
| η∞/(%) | 76.6 | 77.0 | 76.9 | 77.4 |
| (dw/dt)max/(% min−1) | 0.71 | 0.69 | 0.69 | 0.70 |
| (dw/dt)mean/(% min−1) | 0.1 | 0.1 | 0.1 | 0.1 |
| P/(%3 per min2 per °C) × 10−5 | 9.8 | 10.1 | 9.5 | 9.3 |
The initial temperature of carbonization, final temperature of carbonization, and maximum reaction temperature increase to varying degrees with the increase of heating rate (Table 3). However, the data of maximum weight loss, final weight loss, and maximum reaction rates fluctuate slightly and the average weight loss rate remains unchanged.
The comprehensive pyrolysis characteristic index P introduces the initial temperature of carbonization, final temperature of carbonization, and average rate of carbonization while comprehensively considering the four stages of carbonization and pyrolysis and analyzing the whole carbonization process. The heating rate influences the comprehensive characteristic index of pyrolysis. As shown in Table 3, the comprehensive characteristic index of pyrolysis P first increases and then decreases with the increase of the heating rate but the degree of change is small. Among the four heating rates, P reaches the peak when the heating rate is 10 °C min−1, thereby indicating that the carbonization reaction is intense at a high pyrolytic activity at 10 °C min−1.
Therefore, only analyzing indicators, such as initial temperature of carbonization, maximum weight loss rate of carbonization, temperature corresponding to the maximum rate, or release characteristic index of carbonization products, fails to describe the carbonization process accurately. The pyrolysis comprehensive characteristic index P can accurately and quantitatively analyze the reaction activity of carbonization in the whole process. The following rule can be drawn: P increases first and then decreases with the increase of heating rate and reaches the peak at 10 °C min−1 when the carbonization reaction is intense and the maximum carbonization of walnut shell is reached. At this time, the high reaction activity and the large amount of carbon produced can provide guidance in determining the optimal carbonization process.
3.2 Analysis of dynamic results
The carbonization process of walnut shell is analyzed on the basis of constant conversion kinetics of multiple heating rates. First, the TG and DTG curves are transformed into curves α–T and dα–dT, respectively. dα–dT is the reaction rate at the temperature T that can be calculated as follows:
 | (3) |
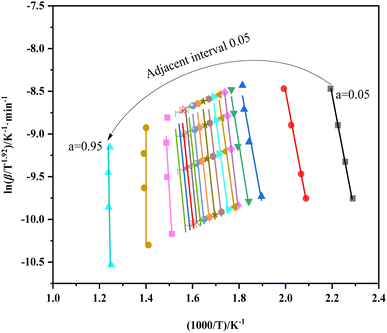
Fig. 5 shows the equivalent conversion diagram of the whole carbonization process of walnut shell from the equivalent conversion method of Formula (2). The range of α is 0.05 to 0.95, and the step length Δα is 0.05. The change of apparent activation energy of the improved equal conversion method in the range of α can be calculated, and the specific data are listed in Table 4. All the straight lines at each heating rate demonstrate a satisfactory linear relationship, thereby indicating that the activation energy of the walnut shell carbonization process calculated via the equal conversion method in Formula (3) remains unchanged with the change of the heating rate. In addition, the equiconversion curve of walnut shell carbonization becomes close with the increase of conversion because this part corresponds to the carbonization stage. Hence, the strong carbonization reaction and fast reaction process result in close data. The results showed that the activation energy of carbonization of walnut shell calculated using the improved equal conversion method remains unaffected by the change of heating rate.
| α | Fitting line | E/kJ mol−1 | R2 |
|---|---|---|---|
| 0.05 | y = 10.47x + 21.07 | 40.92942 | 0.96724 |
| 0.1 | y = 11.32x + 18.37 | 74.23701 | 0.96137 |
| 0.15 | y = 14.93x + 18.52 | 123.99989 | 0.96492 |
| 0.2 | y = 16.99x + 21.47 | 141.1927 | 0.97774 |
| 0.25 | y = 23.23x + 31.85 | 192.93921 | 0.99983 |
| 0.3 | y = 19.52x + 24.87 | 168.19976 | 0.97851 |
| 0.35 | y = 20.73x + 26.42 | 172.21079 | 0.96724 |
| 0.4 | y = 22.85x + 29.43 | 175.81415 | 0.96137 |
| 0.45 | y = 25.21x + 32.78 | 176.44426 | 0.9587 |
| 0.5 | y = 25.37x + 32.41 | 210.77128 | 0.95368 |
| 0.55 | y = 26.29x + 33.33 | 218.43556 | 0.95423 |
| 0.6 | y = 24.82x + 30.51 | 206.15721 | 0.95912 |
| 0.65 | y = 25.81x + 30.69 | 214.45144 | 0.96901 |
| 0.7 | y = 25.86x + 31.39 | 214.83034 | 0.9575 |
| 0.75 | y = 26.27x + 31.62 | 218.23444 | 0.95142 |
| 0.8 | y = 10.47x + 21.07 | 230.85888 | 0.91083 |
| 0.85 | y = 27.79x + 33.49 | 383.15627 | 0.94912 |
| 0.9 | y = 40.92x + 47.70 | 339.92115 | 0.95142 |
| 0.95 | y = 53.78x + 57.11 | 280.62832 | 0.99983 |
As shown in Table 4, the linear correlation coefficient of each line in Fig. 5 is above 0.95, thereby indicating the high reliability of each line. The analysis of effective activation energy revealed that its overall trend is rising, the carbonization process of walnut shell requires high activation energy as the reaction progresses, and the reaction becomes increasingly difficult.
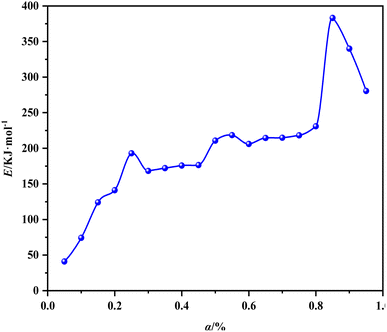
Fig. 6 shows the relationship between effective activation energy and conversion of walnut shell carbonization calculated using the improved equal conversion method. The effective activation energy of carbonization of walnut shell changes sharply with the change of conversion rate. This finding suggested that the carbonization process of walnut shell involves multiple steps and the overall activation energy gradually increases.
The three curves of carbonization Eα–α, α–T, and −dW/dT–T are combined and different segments are used to mark the characteristic temperature to understand the relationship between the decomposition of various components in the carbonization process of walnut shell and the corresponding effective activation energy further (Fig. 7). The relationship between the activation energy of walnut shell carbonization and the reaction process of components is presented in Table 5. T1 is the temperature at the end of the water evaporation, T2 is the temperature at the end of the first peak of the carbonization pyrolysis section, T3 is the temperature at the end of the first stage of the carbonization pyrolysis, T4 is the temperature at the end of the second peak of the carbonization pyrolysis, T5 is the temperature at the end of the second stage of the carbonization pyrolysis, and α1 to α5 are the respective conversion values corresponding to T1 to T5.
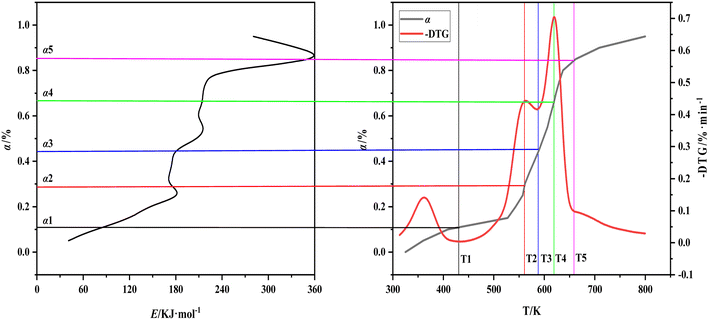 | ||
| Fig. 7 The relationship between activation energy, conversion and temperature of walnut shell pyrolysis carbonization. | ||
| Range of α | Range of temperature | Reaction | The change of E |
|---|---|---|---|
| α < 0.11 | T0–T1 | Water evaporation, low temperature decomposition of easily decomposed components | From 40.9 kJ mol−1 to 86.4 kJ mol−1 |
| 0.11 ≤ α < 0.44 | T1–T3 | Hemicellulose decomposes into volatiles | From 86.2 kJ mol−1 to 181.7 kJ mol−1 and then to 173.6 kJ mol−1, the subsequent E basically does not change |
| 0.44 ≤ α < 0.85 | T3–T5 | Decomposition of cellulose into volatiles, decomposition of lignin into carbon | From 173.6 kJ mol−1 to 352.2 kJ mol−1 rapidly |
| 0.85 ≤ α | T5–Te | Decomposition of lignin into carbon | From 352.2 kJ mol−1 to 280.4 kJ mol−1 |
Fig. 7 shows that water evaporation will easily occur and require minimal activation energy. The decomposition of hemicellulose and cellulose requires a considerable amount of heat absorption. Thus, the corresponding effective activation energy is also increased and hemicellulose is easier to decompose than cellulose. Both materials are ultimately decomposed as volatile matter. The lignin decomposition can be divided into the following parts: (1) simultaneous decomposition of lignin cellulose; (2) cellulose decomposition is complete, and lignin continues to decompose. The first part of lignin decomposition is small and mainly the endothermic decomposition process of cellulose. The effective activation energy decreases sharply in the second part because decomposition of lignin into carbon is an exothermic reaction. The entire process of the carbonization reaction of walnut shell is presented in Table 5.
3.3 RSM result analysis
| q = 327.12 + 0.31X1 − 1.17X2 − 0.51X3 − 2.85X4 − 0.0007X1X2 + 0.001X1X3 − 0.0095X1X4 + 0.0002X2X3 + 0.0048X2X4 + 0.0007X3X4 + 0.0065X12 + 0.0012X22 + 0.0035X32 + 0.04X42 | (4) |
| Source | Sum of squares | Degree of freedom | Mean squares | F-Value | P-Value | Significance |
|---|---|---|---|---|---|---|
| Model | 5387.31 | 14 | 384.81 | 81.80 | <0.0001 | Significant |
| X1 | 39.79 | 1 | 39.79 | 8.46 | 0.0156 | |
| X2 | 4338.08 | 1 | 4338.08 | 922.14 | <0.0001 | |
| X3 | 119.20 | 1 | 119.20 | 25.34 | 0.0005 | |
| X4 | 110.84 | 1 | 110.84 | 23.56 | 0.0007 | |
| X1X2 | 4.62 | 1 | 4.62 | 0.9826 | 0.3449 | |
| X1X3 | 0.54 | 1 | 0.54 | 0.1148 | 0.7417 | |
| X1X4 | 2.04 | 1 | 2.04 | 0.4347 | 0.5246 | |
| X2X3 | 0.73 | 1 | 0.73 | 0.1554 | 0.7017 | |
| X2X4 | 23.38 | 1 | 23.38 | 4.97 | 0.0499 | |
| X3X4 | 0.02 | 1 | 0.02 | 0.0042 | 0.9498 | |
| X12 | 6.09 | 1 | 6.09 | 1.29 | 0.2818 | |
| X22 | 406.73 | 1 | 406.73 | 86.46 | <0.0001 | |
| X32 | 5.57 | 1 | 5.57 | 1.18 | 0.3021 | |
| X42 | 3.09 | 1 | 3.09 | 0.6565 | 0.4367 | |
| Residual | 47.04 | 10 | 4.70 | — | — | |
| Lack of fit | 28.93 | 3 | 6.58 | 7.43 | 0.0771 | Unsignificant |
| Pure error | 1.32 | 4 | 0.97 | — | — | |
| Cor total | 5434.35 | 24 | — | — | — | |
| R-Squared = 0.9913, adj. R-sq. = 0.9792, adeq. precision = 27.2898 | ||||||
According to Table 6, the P value of the model is less than 0.0001 and that of the mismatched term is greater than 0.05. The adj. R-squared and R-squared are 0.9792 and 0.9913, respectively. The difference between these two terms is 0.0121 and less than 0.2, thereby indicating the high accuracy and reliability of the model. The significance analysis of F and P values showed that the order of influence of various factors on carbonization rate is final temperature > holding time > material particle size > heating time, and the interaction between final temperature and material particle size is the most evident.
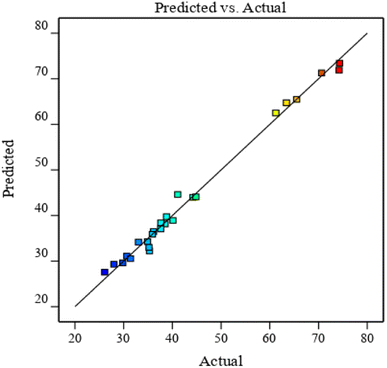
As shown in Fig. 8, scattered points are evenly distributed on both sides of the predicted value line. The predicted value of the model is closely correlated with the experimental value. The comparison of results in Table 6 revealed that the correlation coefficient R of the model is large and close to 1. This finding verifies the high correlation between the actual and predicted values of the experiment.
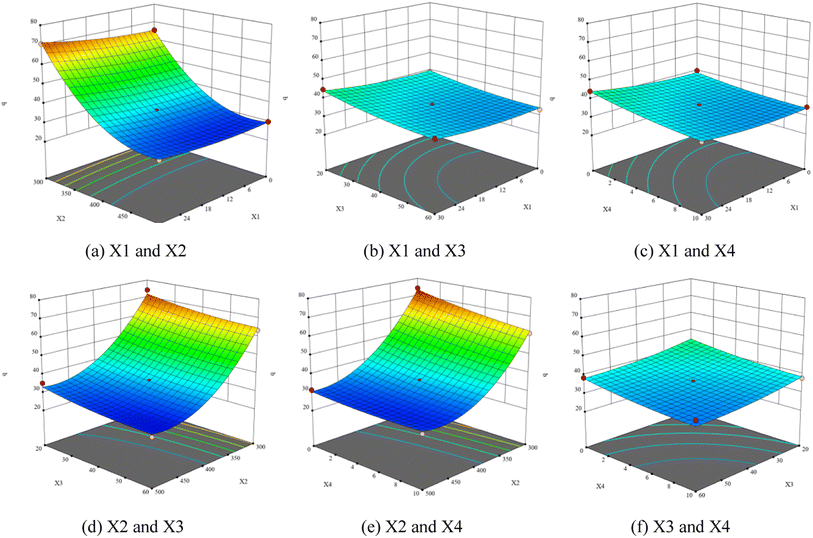
Fig. 9 presents the three-dimensional response surface constructed on the basis of the influence of carbonization process variables (heating time, final temperature, holding time, and material particle size) on carbonization rate (q, %) of walnut shell. The analysis of the influence of different working conditions on the actual reaction demonstrated that they influence the reaction. Fig. 9(a)–(c) illustrate that the carbonization rate increases with the increase of heating time. Fig. 9(a), (d) and (e) indicate that the carbonization rate decreases significantly with the increase of the final temperature. Fig. 9(b), (d) and (f) exhibit that the carbonization rate decreases with the increase of holding time. Fig. 9(c), (e) and (f) show that the carbonization rate decreases with the increase of material particle size.
| X1 | X2 | X3 | X4 | q | |
|---|---|---|---|---|---|
| Actual | Predicted | ||||
| 14.8 min | 324.7 °C | 55.5 min | 2 mm | 68.8% | 70.3% |
| 14.8 min | 324.7 °C | 55.5 min | 2 mm | 70.9% | 70.3% |
| 14.8 min | 324.7 °C | 55.5 min | 2 mm | 68.6% | 70.3% |
The maximum carbon calorific value of walnut shell obtained via the optimal process is 30.24 MJ kg−1. Hence, walnut shell can be used for activation to produce activated carbon, as carbon fuel for storage, and in many fields, with great economic value.
4 Conclusion
In this paper, the thermodynamic parameters for walnut shell during the carbonization process is investigated, and its carbonization and mechanism are discussed. Then, the optimal carbonization process of walnut shell is proposed. The main conclusions are as follows:(1) The pyrolysis comprehensive characteristic index P first increases and then decreases with the increase of heating rate. As heating rate is 10 °C min−1, P reaches the peak and the carbonization reaction is intense. The decomposition of lignin into carbon can be divided into two stages, including simultaneous decomposition stage of lignin and cellulose, and lignin continue decompose stage after cellulose decomposition.
(2) The experimental results are analyzed by fitting the linear regression equation with the BBD method, and the order of influence of each factor on carbonization rate obtained from the significance analysis of the F and P values is final temperature > holding time > material particle size > heating time; note that the interaction between final temperature and material particle size is the most evident.
(3) The optimal carbonization process of walnut shell presents a heating time of 14.8 min, final temperature of 324.7 °C, holding time of 55.5 min, particle size of the material of 2 mm, and optimum carbonization rate of 70.6%. The maximum carbon calorific value of walnut shell obtained via the optimal process is 30.24 MJ kg−1.
Conflicts of interest
There are no conflicts to declare.Acknowledgements
This research was supported by National Key R&D Program of China (No. 2021YFC3001803), Key Research and Development Program of Shaanxi Province (No. 2018ZDXM-SF-033), Hubei Market Supervision Bureau technical support project. Thanks for the support of Wang Kuancheng Foundation.References
- F. M. Ali, N. H. Azmi and K. M. Isa, et al., Optimization study on preparation of amine functionalized sea mango (cerbera odollam) activated carbon for carbon dioxide (CO2) adsorption, Combust. Sci. Technol., 2018, 190, 1–24 CrossRef.
- G. Hu, H. Wang and Y. Li, et al., Preparation and Evaluation of Iron-Based Catalysts from Corncob for NO Reduction, Combust. Sci. Technol., 2021,(3), 1–17 Search PubMed.
- S. E. Agustina and Firmansyah, Design and performance test of drum kiln for durian peel carbonization, IOP Conf. Ser.: Earth Environ. Sci., 2020, 542(1), 012–014 Search PubMed.
- O. Didem and E. Ayşegül, Carbonization kinetics of various biomass sources, J. Chem. Eng. Res. Updates, 2014, 1(1), 20–28 CrossRef.
- Y. Sainogia, H. Yoshida and M. Yamaoka, et al., Basic characteristics of low-temperature carbon products from waste sludge, Adv. Environ. Res., 2013, 7(03), 661–665 CrossRef.
- H. Abdullah and H. W. Wu, Biochar as a Fuel: 1. Properties and Grindability of Biochars Produced from the Pyrolysis of Mallee Wood under Slow-Heating Conditions, Energy Fuels, 2009, 23(08), 4174–4181 CrossRef CAS.
- Y. M. Wu, Z. L. Zhao and W. Q. Wu, Study on biomass pyrolysis based on lysis temperament combined analysis, J. Fuel Chem. Technol., 2010, 38(2), 168–173 CAS.
- W. H. Chen and P. C. Kuo, Isothermal torrefaction kinetics of hemicellulose, cellulose, lignin and xylan using thermogravimetric analysis, Energy, 2021, 36(11), 6451–6460 CrossRef.
- D. Ayhan, Effects of temperature and particle size on bio-char yield from pyrolysis of agricultural residues, J. Anal. Appl. Pyrolysis, 2014, 72(02), 243–248 Search PubMed.
- B. Biswas, N. Pandey and Y. Bisht, et al., Pyrolysis of agricultural biomass residues: comparative study of corn cob, wheat straw, rice straw and rice husk, Bioresour. Technol., 2017, 237, 57–63 CrossRef CAS PubMed.
- X. Yang, K. Kang and L. Qiu, Effects of carbonization conditions on the yield and fixed carbon content of biochar from pruned apple tree branches, Renewable Energy, 2020, 146, 1691–1699 CrossRef CAS.
- X. Pham, L. Steene and B. Piriou, et al., Oxidative pyrolysis of agricultural residues in gasification and carbonization processes, IOP Conf. Ser.: Earth Environ. Sci., 2018, 159(1), 34–36 Search PubMed.
- S. W. Xiong, S. Y. Zhang and X. Guo, et al., Study on Biomass Carbonization for Bio-Char Production, Adv. Mater. Res., 2017, 2479, 724–725 Search PubMed.
- M. Ceranic, T. Kosanic and D. Djuranovic, et al., Experimental investigation of corn cob pyrolysis, J. Renewable Sustainable Energy, 2016, 8(6), 1–33 CrossRef.
- D. Medic, M. Darr and A. Shah, et al., Effects of torrefaction process parameters on biomass feedstock upgrading, Fuel, 2012, 91(01), 147–154 CrossRef CAS.
- P. Anuphon, D. Animesh and B. Prabir, Torrefaction of agriculture residue to enhance combustible properties, Energy Fuels, 2010, 24(09), 4638–4645 CrossRef.
- H. Hanzade and Y. Serdar, Effect of the Heating Rate on the Morphology of the Pyrolytic Char From Hazelnut Shell, Int. J. Green Energy, 2009, 6(05), 508–511 CrossRef CAS.
- Q. R. Xie, Process research on pyrolysis for subtropical biomass resources, MPhil thesis, Guangxi University, 2014.
- G. F. Fu, Research on carbonization of formed biomass and characteristics of formed carbon, MPhil thesis, Nanjing Forestry University, 2009.
- A. G. Borrego, L. Garavaglia and W. D. Kalkreuth, Characteristics of high heating rate biomass chars prepared under N2 and CO2 atmospheres, Int. J. Coal Geol., 2009, 77(04), 409–415 CrossRef CAS.
- Y. G. Wang, Y. Liu and Q. X. Zhao, et al., Evaluation of combustion properties and pollutant emission characteristics of blends of sewage sludge and biomass, Sci. Total Environ., 2020, 720(11), 137–140 Search PubMed.
- P. C. Kuo, W. Wu and W. H. Chen, Gasification performances of raw and torrefied biomass in a downdraft fixed bed gasifier using thermodynamic analysis, Fuel, 2018, 117, 1231–1241 CrossRef.
- Y. Ma, J. Wang and Y. Zhang, TG-FTIR study on pyrolysis of Enteromorpha prolifera, Biomass Convers. Biorefin., 2018, 1, 3–6 Search PubMed.
- X. F. Zhu, L. Zhao and Z. B. Yang, et al., Pyrolysis of pre-dried dewatered sewage sludge under different heating rates: characteristics and kinetics study, Fuel, 2019, 107(3), 1015–1022 Search PubMed.
- S. Ghysels, F. Ronsse and D. Dickinson, et al., Production and characterization of slow pyrolysis biochar from lignin-rich digested stillage from lignocellulosic ethanol production, Biomass Bioenergy, 2019, 122, 349–360 CrossRef CAS.
- Y. Luo, L. X. Zhao and H. B. Meng, et al., Physicochemical characteristics of pyrolysis mangrass biochar at different temperatures, J. Agric. Eng., 2013, 29(13), 208–217 CAS.
- N. Ren, F. Wang and J. J. Zhang, New progress in kinetic dynamics of thermal analysis, Acta Phys.-Chim. Sin., 2020, 36(06), 12–18 Search PubMed.
- F. Fan, Y. Zheng and Y. Huang, et al., Combustion Kinetics of Biochar Prepared by Pyrolysis of Macadamia Shells, BioResources, 2017,(2), 68–71 Search PubMed.
- J. Riaza, P. Mason and J. Jones, et al., High temperature volatile yield and nitrogen partitioning during pyrolysis of coal and biomass fuels, Fuel, 2019, 248, 215–220 CrossRef CAS.
- K. Jayaraman and I. Gökalp, Pyrolysis combustion and gasification characteristics of miscanthus and sewage sludge, Energy Convers. Manage., 2015, 89, 83–91 CrossRef CAS.
- S. Vyazovkin, A. Burnham and J. Criado, et al., ICTAC kinetics committee recommendations for performing kinetic computations on thermal analysis data, Thermochim. Acta, 2011, 520(1), 1–19 CrossRef CAS.
- H. Yang, R. Yan and H. Chen, et al., Characteristics of hemicellulose, cellulose and lignin pyrolysis, Fuel, 2007,(12), 1781–1788 CrossRef CAS.
- J. J. Liang, Mechanism researches of cellulose and hemicellulose pyrolysis and their products regulation, MPhil thesis, South China University of Technology, 2016.
- Y. P. Zhao, H. Q. Hu and L. J. Jin, et al., Pyrolysis behavior of vitrinite and inertinite from Chinese Pingshuo coal by TG-MS and in a fixed bed reactor, Fuel Process. Technol., 2010, 92(4), 780–786 CrossRef.
- J. B. Yang and N. S. Cai, A TG-FTIR study on catalytic pyrolysis of coal, J. Fuel Chem. Technol., 2006, 34(6), 650–654 CrossRef CAS.
- W. Qian, Study on low-temperature pyrolysis and pyrolysis products in low-order bituminous coal, PhD thesis, China University of Mining & Technology (Beijing), 2012.
- Z. R. Wu, Pyrolysis characteristics and kinetics of Auricularia auricula bran in Huangsongdian, MPhil thesis, Northeast Electric Power University, 2020.
- N. Ren, F. Wang and J. J. Zhang, New progress in kinetic dynamics of thermal analysis, Acta Phys.-Chim. Sin., 2020, 36(06), 12–18 Search PubMed.
| This journal is © The Royal Society of Chemistry 2023 |

