 Open Access Article
Synthesis of methanol over highly dispersed Cu–Fe based catalysts derived from layered double hydroxides
Jing Tian ,
Weixin Qian*,
Haitao Zhang
 ,
Hongfang Ma
 and
Weiyong Ying
Engineering Research Center of Large Scale Reactor Engineering and Technology, Ministry of Education, State Key Laboratory of Chemical Engineering, School of Chemical Engineering, East China University of Science and Technology, Shanghai 200237, China. E-mail: wxqian@ecust.edu.cn
First published on 9th May 2023
Abstract
In this paper, catalysts with different aluminum contents were prepared by a co-precipitation method using LDHs (layered double hydroxides) as the precursors through the adjustment of Cu2+![[thin space (1/6-em)]](https://www.rsc.org/images/entities/char_2009.gif) :
:![[thin space (1/6-em)]](https://www.rsc.org/images/entities/char_2009.gif) Fe2+, and the catalysts were named LDO catalysts. The effect of aluminum on CO2 hydrogenation to methanol was investigated by evaluating the characterization. With the addition of Al, Ar physisorption results showed an increase in BET-specific surface area, TEM demonstrated a decrease in catalyst particle diameter, XRD showed that Cu and Fe existed in the catalyst mainly in the form of CuFe2O4 and CuO, XPS demonstrated a decrease in electron cloud density and an increase in base sites and oxygen vacancies, and CO2-TPD and H2-TPD results indicated that Al promoted the dissociation and adsorption of CO2 and H2. When the reaction temperature was 230 °C, the pressure was 4 MPa, H2/CO2 = 2.5 and the space velocity was 2000 ml (h gcat)−1, the best conversion (14.87%) and the highest methanol selectivity (39.53%) of the catalyst were obtained at 30% aluminum content.
Fe2+, and the catalysts were named LDO catalysts. The effect of aluminum on CO2 hydrogenation to methanol was investigated by evaluating the characterization. With the addition of Al, Ar physisorption results showed an increase in BET-specific surface area, TEM demonstrated a decrease in catalyst particle diameter, XRD showed that Cu and Fe existed in the catalyst mainly in the form of CuFe2O4 and CuO, XPS demonstrated a decrease in electron cloud density and an increase in base sites and oxygen vacancies, and CO2-TPD and H2-TPD results indicated that Al promoted the dissociation and adsorption of CO2 and H2. When the reaction temperature was 230 °C, the pressure was 4 MPa, H2/CO2 = 2.5 and the space velocity was 2000 ml (h gcat)−1, the best conversion (14.87%) and the highest methanol selectivity (39.53%) of the catalyst were obtained at 30% aluminum content.
1. Introduction
In accordance with the Intergovernmental Panel on Climate Change (IPCC), which is the United Nations body for assessing the science related to climate change, report on global warming, the global mean surface temperature (GMST) is currently 1.0 °C above the pre-industrial period (1850–1900), and the GMST is predicted to reach 1.5 °C above the pre-industrial period between 2030 and 2052. The GMST is rising at a 0.2–0.1 °C per decade rate in the meantime.1 And as CO2 is the key greenhouse gas that humans emit, its immobilization has become a crucial concern for the modern chemical industry. Compared with techniques such as membrane separation, adsorption, and solution absorption,2–8 solid material adsorption is widely used because of its low energy consumption and low pollution, and the commonly used porous adsorption materials include molecular sieves, metal–organic framework compounds, and metal oxides.9–16 The use of these efficient adsorbent materials as carriers or catalysts to continue the research of CO2 hydrogenation has become a hot topic in the scientific community.17–19The main catalysts currently used for CO2 hydrogenation to methanol are Cu-based catalysts, noble metal catalysts and metal oxides with semiconductor properties.20 Since Cu-based catalysts is inexpensive and abundant, they have received a lot of attention for industrial applications in the preparation of methanol from carbon dioxide. Typical Cu-based catalysts include Cu/ZnO/Al2O3/ZrO2 catalysts, CuCeTiOx catalysts, CuNi alloy catalysts, etc.21–23. However, one of the problems with these catalysts is the low methanol selectivity due to the reverse water–gas shift. A more serious problem is the rapid deactivation caused by the output water, which has a temporary toxic effect on the catalyst active site, inhibiting methanol production and accelerating the sintering of the Cu active component during CO2 hydrogenation.24
Layered double hydroxides (LDHs) are a typical laminate material, which can be called a hydrotalcite structure. This material is characterized by a sizable specific surface area and numerous basic sites. LDHs have a general expression which is [MII1−xMxIII(OH)2]x+·(Ax/nn−)·mH2O, in which MII is a divalent metal cation, MIII is a trivalent metal cation, x refers to the ratio of trivalent metal cations to total metal cations, i.e. x = MIII/(MII + MIII), and A represents the interlayer charge compensation anions.25–28 Typical MII includes Cu2+, Zn2+, Fe2+, Mg2+, Co2+, and Ni2+, while MIII contains Al3+, Ga3+, Fe3+, and Cr3+. The most common interlayer anions are CO32−, SO42−, NO3−, Cl−, and other inorganic anions. LDHs require that x is usually between 0.2 and 0.33. By their structural and chemical characteristics (layered structure, oxygen vacancies, etc.), LDHs have become a good-performance CO2 adsorbent and are also widely used as catalyst precursors, catalyst carriers, and catalysts themselves in the field of CO2 hydrogenation.25,29–36 Researchers have noticed that during high-temperature roasting, the Ostwald ripening effect causes metal particles to agglomerate and reduce the reaction interface area.37 Therefore, many researchers have focused on creating heterogeneous phases or expanding the distance between adjacent metals in a closed space to prevent severe deformation and agglomeration of metal particles at high temperatures.38 Recently, the compositional flexibility and structural architecture of hydrotalcite have attracted considerable interest, and catalysts derived from it have been extensively studied.39–42 Compared to typical metal oxides, LDO catalysts derived from LDHs typically have significant advantages: (1) highly dispersed metal species, (2) good thermal stability, and (3) adjustable surface properties.43–45
According to the literature, Cu–Fe bimetallic catalysts have good performance in the preparation of hydrocarbons.46 Meanwhile, Yang et al. found that Cu–Fe-based catalysts produce large amounts of methanol at low temperatures.47 During the investigation of the performance of CuFe-based CO2 hydrogenation catalysts using hydrotalcite-like precursors, a significant amount of methanol was also found in the products. Therefore, this article explores the composition of the catalyst to achieve better economic efficiency.
In this paper, co-precipitation was used to prepare LDO catalysts with different aluminium concentration levels, and the promotion effect of aluminum on the hydrogenation of the catalyst to methanol was studied. The characteristics of the catalysts were Ar adsorption–desorption, X-ray diffraction (XRD), transmission electron microscopy (TEM), X-ray photoelectron spectroscopy (XPS), H2-temperature programmed reduction (H2-TPR), H2-temperature programmed reduction (H2-TPD) and CO2-TPD.
2. Experimental information
2.1 Method of catalysts preparation
The catalysts were prepared by the co-precipitation method. First, copper nitrate hydrate (Cu(NO3)2·xH2O, 99.99 wt% purity, Aladdin), iron nitrate nine hydrate (Fe(NO3)3·9H2O, 99.99 wt% purity, Macklin), ferrous sulfate heptahydrate (FeSO4·7H2O, ≥99.00 wt% purity, Aladdin) and aluminium nitrate nonahydrate (Al(NO3)3·9H2O, 99.99 wt% purity, Aladdin) were configured as 1![[thin space (1/6-em)]](https://www.rsc.org/images/entities/char_2009.gif) :
:![[thin space (1/6-em)]](https://www.rsc.org/images/entities/char_2009.gif) 0.76
0.76![[thin space (1/6-em)]](https://www.rsc.org/images/entities/char_2009.gif) :
:![[thin space (1/6-em)]](https://www.rsc.org/images/entities/char_2009.gif) 0.24
0.24![[thin space (1/6-em)]](https://www.rsc.org/images/entities/char_2009.gif) :
:![[thin space (1/6-em)]](https://www.rsc.org/images/entities/char_2009.gif) 0.35, 1
0.35, 1![[thin space (1/6-em)]](https://www.rsc.org/images/entities/char_2009.gif) :
:![[thin space (1/6-em)]](https://www.rsc.org/images/entities/char_2009.gif) 0.87
0.87![[thin space (1/6-em)]](https://www.rsc.org/images/entities/char_2009.gif) :
:![[thin space (1/6-em)]](https://www.rsc.org/images/entities/char_2009.gif) 0.12
0.12![[thin space (1/6-em)]](https://www.rsc.org/images/entities/char_2009.gif) :
:![[thin space (1/6-em)]](https://www.rsc.org/images/entities/char_2009.gif) 0.50, 1
0.50, 1![[thin space (1/6-em)]](https://www.rsc.org/images/entities/char_2009.gif) :
:![[thin space (1/6-em)]](https://www.rsc.org/images/entities/char_2009.gif) 1
1![[thin space (1/6-em)]](https://www.rsc.org/images/entities/char_2009.gif) :
:![[thin space (1/6-em)]](https://www.rsc.org/images/entities/char_2009.gif) 0.00
0.00![[thin space (1/6-em)]](https://www.rsc.org/images/entities/char_2009.gif) :
:![[thin space (1/6-em)]](https://www.rsc.org/images/entities/char_2009.gif) 0.67, and 1
0.67, and 1![[thin space (1/6-em)]](https://www.rsc.org/images/entities/char_2009.gif) :
:![[thin space (1/6-em)]](https://www.rsc.org/images/entities/char_2009.gif) 1
1![[thin space (1/6-em)]](https://www.rsc.org/images/entities/char_2009.gif) :
:![[thin space (1/6-em)]](https://www.rsc.org/images/entities/char_2009.gif) 0.00
0.00![[thin space (1/6-em)]](https://www.rsc.org/images/entities/char_2009.gif) :
:![[thin space (1/6-em)]](https://www.rsc.org/images/entities/char_2009.gif) 0.86, respectively, to obtain four metal solutions dissolved with 200 ml of deionized water. Meanwhile, the corresponding mass of anhydrous K2CO3 (99.99 wt% purity, Macklin) was weighed and dissolved with 100 ml of deionized water, and the configured potassium carbonate solution was used as the base solution; the corresponding mass of KOH (99.99 wt% purity, Macklin) was weighed and dissolved with 200 ml of deionized water to obtain the alkaline precipitant. Under the N2 atmosphere, the three-mouth flask containing the base solution was heated to 60 °C in a water bath. The prepared metal solution and precipitant were added dropwise to the three-neck flask by a peristaltic pump under stirring conditions. Stirring was continued for 1 hour after the dropwise addition was done, aged overnight, then washed with deionized water to neutral and dried at 110 °C for 12 h to obtain the catalyst precursor LDH–xAl. where x is the molar ratio of Al to total metal ions. Finally, the catalyst was roasted at 500 °C for 5 h to obtain LDO–xAl catalysts.
0.86, respectively, to obtain four metal solutions dissolved with 200 ml of deionized water. Meanwhile, the corresponding mass of anhydrous K2CO3 (99.99 wt% purity, Macklin) was weighed and dissolved with 100 ml of deionized water, and the configured potassium carbonate solution was used as the base solution; the corresponding mass of KOH (99.99 wt% purity, Macklin) was weighed and dissolved with 200 ml of deionized water to obtain the alkaline precipitant. Under the N2 atmosphere, the three-mouth flask containing the base solution was heated to 60 °C in a water bath. The prepared metal solution and precipitant were added dropwise to the three-neck flask by a peristaltic pump under stirring conditions. Stirring was continued for 1 hour after the dropwise addition was done, aged overnight, then washed with deionized water to neutral and dried at 110 °C for 12 h to obtain the catalyst precursor LDH–xAl. where x is the molar ratio of Al to total metal ions. Finally, the catalyst was roasted at 500 °C for 5 h to obtain LDO–xAl catalysts.
2.2 Catalysts characterization techniques
The textual and structural properties of the catalyst were measured by low-temperature Ar physisorption experiments, which were determined by Micromeritics ASAP 2020M physisorption instrument. All samples were treated at 120 °C and 1.33 Pa for about 6 h before the determination, and then Ar adsorption/desorption experiments were performed at liquid nitrogen temperature (−186 °C).The XRD test was measured by a Rigaku D/MAX-2550 X-ray diffractometer, in Japan. Cu Kα radiation source (λ = 0.154 nm), Ni filter, tube voltage 40 kV, tube current 450 mA, scan range 2θ = 10–80°, continuous scan rate 0.02 min−1, and data were collected automatically by computer.
Electronic effects of catalysts were obtained by X-ray photoelectron spectroscopy (XPS). The test was performed with the Thermo Fisher ESCALAB 250, and the excitation source was Al Kα.
The catalysts were characterized by programmed temperature reduction using a Micromeritics AutoChem II 2920 chemisorption instrument with a catalyst charge of 40 mg and a reduction gas mixture of 10% H2–90% Ar (v/v) (H2-TPR) at a gas flow rate of 50 ml min−1, temperature rise rate of 10 °C min−1, thermal conductivity (TCD) detector to record the change of thermal conductivity signal. The CuO specimen was used as a reference to calculate the hydrogen consumption of the catalyst for reduction.
The instrumentation used for the temperature program desorption (H2-TPD, CO2-TPD) of the catalyst is the same as that used for TPR. In the temperature-programmed desorption (CO2/H2-TPD) experiment, the catalyst loading capacity is 200 mg, the catalyst is pre-reduced, and the sample is heated from room temperature to 400 °C at a heating rate of 10 °C min−1 in an H2/Ar mixture or CO2/Ar mixture with a flow rate of 50 ml min−1 and maintained for 4 h, and the reduction is cooled to 50 °C, and the flow rate is 50 ml min−1. The catalyst sample was purged for 30 min (H2 or CO2 physically adsorbed on the catalyst surface was removed), and after the baseline was stable, the sample was heated to 800 °C at a rate of 10 °C min−1 in the Ar gas stream with a flow rate of 50 ml min−1 and the signal of the TCD detector was recorded.
TEM testing was performed using the JEM-2100F transmission electron microscope (JEOL, Japan) to analyze the sample lattice structure. The maximum accelerating voltage of the device is 200 kV, the point resolution is 0.23 nm, and the line division rate is 0.14 nm. Count about 100 particles to analyze their particle size distribution.
2.3 Catalyst testing and product analysis
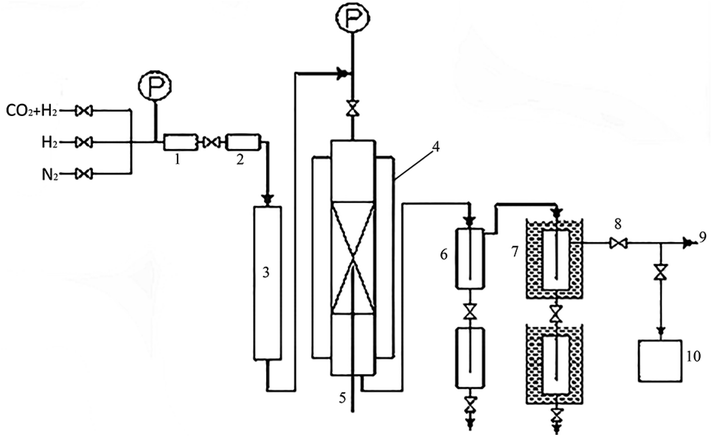
The activity test of the catalyst adopts a miniature fixed-bed reactor. A schematic diagram of the catalyst evaluation device was shown in Fig. 1, the inner diameter of the reaction tube is 10 mm, the reaction pressure is 4 MPa, the space velocity is 2000 ml (h gcat)−1, the reaction temperature is 230 °C, H2![[thin space (1/6-em)]](https://www.rsc.org/images/entities/char_2009.gif) :
:![[thin space (1/6-em)]](https://www.rsc.org/images/entities/char_2009.gif) CO2 = 2.5 and the internal standard gas is N2 (10%). The reaction tube is filled with 2 g catalyst (40–60 mesh), and at the same time diluted with quartz sand of equal ratio and same mesh, and a certain amount of quartz sand (10–15 mesh) is loaded above and below the catalyst bed for gas homogenization and catalyst support. Before the reaction, pure hydrogen was reduced under atmospheric pressure, and the reduction temperature was 350 °C. Using the Agilent 7890A online GC, the tail gases CO2, H2, CH4, and others were the test. Alcohol offline testing was conducted using a GC Agilent 7890A.
CO2 = 2.5 and the internal standard gas is N2 (10%). The reaction tube is filled with 2 g catalyst (40–60 mesh), and at the same time diluted with quartz sand of equal ratio and same mesh, and a certain amount of quartz sand (10–15 mesh) is loaded above and below the catalyst bed for gas homogenization and catalyst support. Before the reaction, pure hydrogen was reduced under atmospheric pressure, and the reduction temperature was 350 °C. Using the Agilent 7890A online GC, the tail gases CO2, H2, CH4, and others were the test. Alcohol offline testing was conducted using a GC Agilent 7890A.
The formula for calculating CO2 conversion (XCO2, %), CO selectivity (SCO, %), and hydrocarbon distribution (Si, %) for each hydrocarbon are as shown in eqn (1)–(3).
 | (1) |
 | (2) |
 | (3) |
3. Results and discussion
3.1 BET
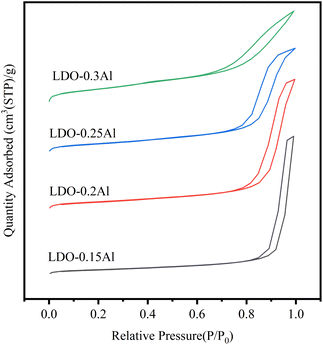
The Brunauer–Emmett–Teller (BET) equation was used to calculate the specific surface area of the catalysts, and the pore size distribution curves were calculated using the Barrett–Joyner–Halenda (BJH) method and Kelvin's equation.Fig. 2 shows the Ar adsorption–desorption isotherms of LDO catalysts with different Al contents. And y-offset is used when plotting the sorption isotherms. According to the IUPAC classification, it belongs to the type IV isotherm.48 the H3-type hysteresis loop (P/P0 > 0.4) indicates a large number of narrow-shaped pore channels formed due to the aggregation of plate-like layers, which also proves that the catalyst is a mesoporous material.
The BET surface area, pore volume, and pore size (calculated from adsorption isotherms) for these catalysts are listed in Table 1. The specific surface area of LDO–0.15Al is 41 m2 g−1, and the surface area of LDO–0.3Al continues to increase to 111 m2 g−1 with the increase of aluminum content. At the same time, with the increase in aluminum content, the pore volume increased from 0.24 cm3 g−1 increased to 0.42 cm3 g−1. The measured trend is consistent with the trend of pore size and pore volume at different aluminum content. The reason for the increase in BET surface area and the decrease in pore volume pore size may be caused by the reduced catalyst particle size due to the dispersion effect of increased Al content on CuFe species.
| Catalysts | Molar ratio of synthetic mixture (Cu2+![[thin space (1/6-em)]](https://www.rsc.org/images/entities/char_2009.gif) : :![[thin space (1/6-em)]](https://www.rsc.org/images/entities/char_2009.gif) Fe2+ Fe2+![[thin space (1/6-em)]](https://www.rsc.org/images/entities/char_2009.gif) : :![[thin space (1/6-em)]](https://www.rsc.org/images/entities/char_2009.gif) Fe3+ Fe3+![[thin space (1/6-em)]](https://www.rsc.org/images/entities/char_2009.gif) : :![[thin space (1/6-em)]](https://www.rsc.org/images/entities/char_2009.gif) Al3+) Al3+) |
Metal compositiona (wt%) (Cu![[thin space (1/6-em)]](https://www.rsc.org/images/entities/char_2009.gif) : :![[thin space (1/6-em)]](https://www.rsc.org/images/entities/char_2009.gif) Fe Fe![[thin space (1/6-em)]](https://www.rsc.org/images/entities/char_2009.gif) : :![[thin space (1/6-em)]](https://www.rsc.org/images/entities/char_2009.gif) Al) Al) |
BET surface area (m2 g−1) | BJH pore volume (cm3 g−1) | Pore diameter (nm) | Db (nm) | Particle sizec (nm) |
|---|---|---|---|---|---|---|---|
| a Determined by ICP-OES.b Average crystallite size calculated by the Scherrer equation and determined by XRD.c Determined by TEM. | |||||||
| LDO–0.3Al | 1![[thin space (1/6-em)]](https://www.rsc.org/images/entities/char_2009.gif) : :![[thin space (1/6-em)]](https://www.rsc.org/images/entities/char_2009.gif) 1 1![[thin space (1/6-em)]](https://www.rsc.org/images/entities/char_2009.gif) : :![[thin space (1/6-em)]](https://www.rsc.org/images/entities/char_2009.gif) 0 0![[thin space (1/6-em)]](https://www.rsc.org/images/entities/char_2009.gif) : :![[thin space (1/6-em)]](https://www.rsc.org/images/entities/char_2009.gif) 0.83 0.83 |
1.01![[thin space (1/6-em)]](https://www.rsc.org/images/entities/char_2009.gif) : :![[thin space (1/6-em)]](https://www.rsc.org/images/entities/char_2009.gif) 1.00 1.00![[thin space (1/6-em)]](https://www.rsc.org/images/entities/char_2009.gif) : :![[thin space (1/6-em)]](https://www.rsc.org/images/entities/char_2009.gif) 0.32 0.32 |
111 | 0.27 | 9.2 | 4.6 | 5.6 |
| LDO–0.25Al | 1![[thin space (1/6-em)]](https://www.rsc.org/images/entities/char_2009.gif) : :![[thin space (1/6-em)]](https://www.rsc.org/images/entities/char_2009.gif) 1 1![[thin space (1/6-em)]](https://www.rsc.org/images/entities/char_2009.gif) : :![[thin space (1/6-em)]](https://www.rsc.org/images/entities/char_2009.gif) 0 0![[thin space (1/6-em)]](https://www.rsc.org/images/entities/char_2009.gif) : :![[thin space (1/6-em)]](https://www.rsc.org/images/entities/char_2009.gif) 0.67 0.67 |
0.99![[thin space (1/6-em)]](https://www.rsc.org/images/entities/char_2009.gif) : :![[thin space (1/6-em)]](https://www.rsc.org/images/entities/char_2009.gif) 0.98 0.98![[thin space (1/6-em)]](https://www.rsc.org/images/entities/char_2009.gif) : :![[thin space (1/6-em)]](https://www.rsc.org/images/entities/char_2009.gif) 0.88 0.88 |
72 | 0.31 | 15.1 | 5.2 | 5.8 |
| LDO–0.2Al | 1![[thin space (1/6-em)]](https://www.rsc.org/images/entities/char_2009.gif) : :![[thin space (1/6-em)]](https://www.rsc.org/images/entities/char_2009.gif) 0.87 0.87![[thin space (1/6-em)]](https://www.rsc.org/images/entities/char_2009.gif) : :![[thin space (1/6-em)]](https://www.rsc.org/images/entities/char_2009.gif) 0.12 0.12![[thin space (1/6-em)]](https://www.rsc.org/images/entities/char_2009.gif) : :![[thin space (1/6-em)]](https://www.rsc.org/images/entities/char_2009.gif) 0.5 0.5 |
1.01![[thin space (1/6-em)]](https://www.rsc.org/images/entities/char_2009.gif) : :![[thin space (1/6-em)]](https://www.rsc.org/images/entities/char_2009.gif) 1.00 1.00![[thin space (1/6-em)]](https://www.rsc.org/images/entities/char_2009.gif) : :![[thin space (1/6-em)]](https://www.rsc.org/images/entities/char_2009.gif) 0.70 0.70 |
61 | 0.39 | 21.9 | 8.1 | 7.6 |
| LDO–0.15Al | 1![[thin space (1/6-em)]](https://www.rsc.org/images/entities/char_2009.gif) : :![[thin space (1/6-em)]](https://www.rsc.org/images/entities/char_2009.gif) 0.76 0.76![[thin space (1/6-em)]](https://www.rsc.org/images/entities/char_2009.gif) : :![[thin space (1/6-em)]](https://www.rsc.org/images/entities/char_2009.gif) 0.24 0.24![[thin space (1/6-em)]](https://www.rsc.org/images/entities/char_2009.gif) : :![[thin space (1/6-em)]](https://www.rsc.org/images/entities/char_2009.gif) 0.35 0.35 |
1.01![[thin space (1/6-em)]](https://www.rsc.org/images/entities/char_2009.gif) : :![[thin space (1/6-em)]](https://www.rsc.org/images/entities/char_2009.gif) 1.00 1.00![[thin space (1/6-em)]](https://www.rsc.org/images/entities/char_2009.gif) : :![[thin space (1/6-em)]](https://www.rsc.org/images/entities/char_2009.gif) 0.56 0.56 |
41 | 0.42 | 34.6 | 10.3 | 15.6 |
3.2 XRD
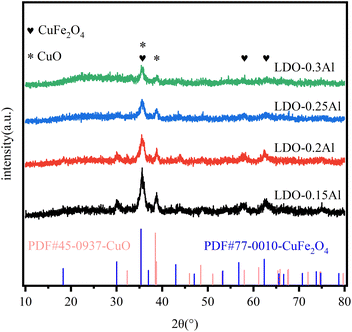
Fig. 3 shows XRD plots of all fresh catalysts. In the figure, the diffraction peak of 2θ at 35.5°, 57.1°, and 62.7° corresponds to CuFe2O4 (PDF # 77-0010), and it corresponds to CuO (PDF # 45-0937) at 35.5° and 38.9°. It can be seen from the figure that the characteristic peaks of CuFe2O4 and CuO gradually weaken as the Al content in the catalyst increases. This result means that the Al in the catalyst makes CuFe highly dispersed, and the highly dispersed Cu will generate more interfaces with the support, providing more active sites for CO2 hydrogenation to methanol, and at the same time helping to improve the stability of the catalyst and prevent the catalyst from being inactivated by high-temperature sintering.49 The disappearance of the Fe2O3 phase can be attributed to the formation of spinel CuFe2O4, which is similar to previous reports.503.3 TEM
Fig. 4 shows the TEM images and the particle size distribution of the catalyst for LDO–xAl. It can be seen in the figure that the catalysts are formed by particles of 2–30 nm. The particle sizes of each catalyst are listed in Table 1. It can be seen that the particle size decreases with increasing aluminum content and the transmission electron microscopy results are consistent with the XRD results.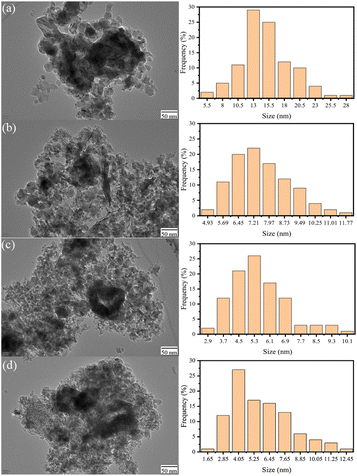 | ||
| Fig. 4 Transmission electron microscope images and particle size statistics of LDO–0.15Al (a), LDO–0.2Al (b), LDO–0.25Al (c), LDO–0.3Al (d). | ||
3.4 XPS
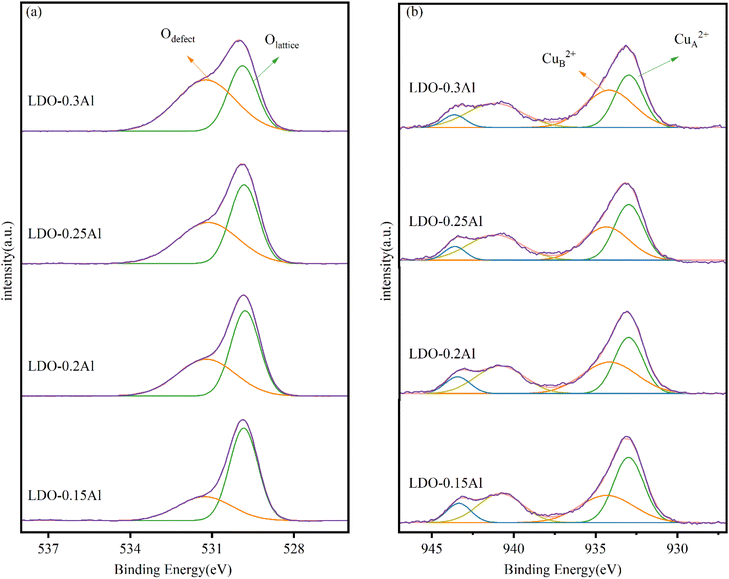
Fig. 5a shows the XPS energy spectrum of LDO catalyst's O 1s with different aluminum content. Two peaks are identified in the figure, with the peak at 529.8 eV attributable to lattice oxygen (Olattice) and the peak at 531.2 eV attributable to surface-adsorbed oxygen species near the oxygen defect (Odefect).51 The oxygen vacancy density can be indirectly expressed by Odefect/Olattice. As seen in Table 2, Odefect/Olattice increases with the increase of Al content, indicating that the addition of Al can increase the oxygen vacancy on the catalyst, which is essential for the adsorption and activation of CO2 and the production of methanol.52,53| Catalyst | The proportion of peak area at 529.8 eV (%) | The proportion of peak area at 531.2 eV (%) | Odefect/Olattice | Binding energy (eV) | Peak intensity (%) | ||
|---|---|---|---|---|---|---|---|
| CuA2+ | CuB2+ | I (CuA2+) | I (CuB2+) | ||||
| LDO–0.15Al | 32.94 | 67.06 | 0.91 | 932.98 | 934.65 | 49.71 | 50.29 |
| LDO–0.2Al | 46.55 | 53.45 | 1.15 | 934.67 | 940.50 | 48.92 | 51.08 |
| LDO–0.25Al | 52.41 | 47.59 | 2.03 | 932.97 | 934.35 | 48.38 | 51.62 |
| LDO–0.3Al | 61.44 | 38.56 | 2.04 | 932.96 | 934.17 | 45.07 | 54.93 |
The Cu 2p spectra of samples with different aluminum content are shown in Fig. 5b. A quantitative analysis of the Cu 2p signal is shown in Table 2. Early findings by Li and Lenglet indicate that Cu2+ cations with tetrahedral and octahedral coordination can be distinguished.54,55 In its study, the Cu2+ ion located on the octahedron is called CuA2+ and is considered to be the Cu2+ ion in CuO; the Cu2+ ion located on the tetrahedron is called CuB2+ and is considered to be the Cu2+ ion in CuFe2O4. According to further research by Han et al.56 the CuA2+ cation in copper oxide is a sintered Cu ion, while the other Cu2+ observed are highly dispersed copper ions. From the quantitative analysis of the Cu 2p signal, with the increase of Al content, the ratio of CuB2+ to (CuA2++ CuB2+) increased from 50.29% (LDO–0.15Al) to 54.93% (LDO–0.3Al). LDO–0.3Al catalysts have the highest copper dispersion. This is also consistent with XRD's conclusions.
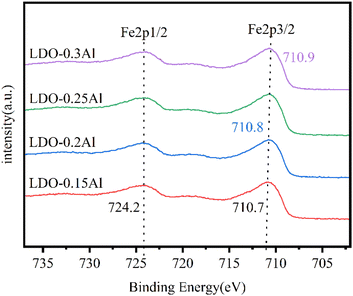
The XPS patterns of catalysts Fe 2p with different aluminum content are shown in Fig. 6. Each of the catalysts exhibited two peaks around 724.2 eV and 710.8 eV, representing Fe 2p1/2 orbitals and Fe 2p3/2 orbitals, respectively. It is well known that the change of characteristic peak binding energy in the XPS map is related to the electron cloud density of atoms, and the binding energy of characteristic peaks decreases when the density of the electron cloud of the central atom increases.57 Since the electronegativity of Cu is lower than that of Fe, the electrons of Cu atoms shift towards Fe atoms.58 However, with the increase of aluminum content, the binding energy of the Fe 2p3/2 orbital of catalysts increases from 710.6 eV to 710.9 eV, and the electron cloud density decreases. This indicates that the aluminum element suppresses the shift of electrons.
3.5 H2-TPR
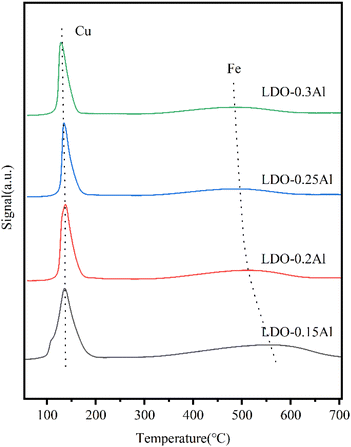
As shown in Fig. 7, in the temperature range of 100–200 °C, there is an asymmetrical broad peak with a pronounced shoulder. Since XRD did not detect Cu species other than Cu2+, peak shoulders around 130 °C should be attributed to Cu+ formation as an intermediate, while peaks around 160 °C were attributed to CuO formation. The reduction peak (300–700 °C) is attributed to α-Fe2O3 → Fe3O4 → FeO → α-Fe.59 It can be seen that from 0.15Al to 0.3Al, the peak area of the low-temperature reduction peak gradually decreases as the aluminum content increases, which may be due to the decrease in copper content. At the same time, the high-temperature reduction peak shifts to the low-temperature region, which can be attributed to the increase in Al usage to promote the dispersion of Fe, making Fe species easier to be reduced. However, a gradual decrease in the peak area of each reduction peak, especially the high-temperature reduction peak, can be seen with increasing aluminum content, which may be due to the decrease in iron content. The Cu reduction temperatures are listed in Table 3. It can be seen that as the Al content increased, the onset reduction temperature of Cu increased, which may be due to the addition of Al enhancing the interaction between Fe and Cu. Also, the reduction temperature shifted towards the high temperature region when the Al content increased from 15% to 20%, which may also be related to this. However, when the Al content was increased from 15% to 30%, the temperature of the reduction peak was shifted towards the lower temperature because the addition of Al increased the dispersion of Cu. It has been reported that Al enhances the dispersion of metal oxides, thus making them susceptible to reduction, while the Cu–Fe interaction makes Fe susceptible to reduction while the Cu reduction peak is shifted towards the high temperature region.46,60 When the Al content is increased, the Cu–Fe interaction is enhanced along with the dispersion. For the Fe reduction, both the increased dispersion and the Cu–Fe interaction result in a shift of the reduction peak towards the low temperature region, while have contrary effects on Cu reduction. Therefore, the change of the reduction peak temperature of Cu is small compared to that of Fe.| Catalyst | Peak temperature (°C) | Beginning of reduction temperature (°C) | Signal (a.u.) |
|---|---|---|---|
| LDO–0.15Al | 137 | 60 | 0.209 |
| LDO–0.2Al | 138 | 75 | 0.199 |
| LDO–0.25Al | 135 | 77 | 0.194 |
| LDO–0.3Al | 129 | 79 | 0.189 |
3.6 H2-TPD
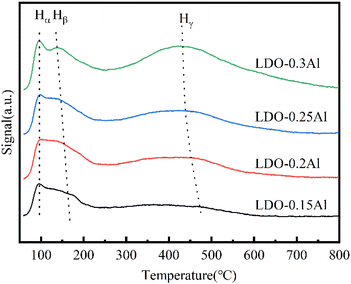
The H2-TPD of LDO catalysts with different aluminum content is shown in Fig. 8. The desorption peak at 100 °C is attributed to hydrogen absorbed at the Cu site on the surface (Hα), while the desorption at around 150 °C is attributed to hydrogen (Hβ) strongly absorbed by the Cu spilled hydrogen on the surface of other oxides/spinel, and the resolution at around 450 °C is attributed to the OH species Hγ on the surface of the metal oxide without reduction.61 It can be seen that with the increase of aluminum content, the desorption peak of Hα does not shift, while the desorption peak of Hβ and Hγ moves to the low-temperature direction, which indicates that due to the increase of aluminum content, the dispersion of catalyst grains is promoted, which is conducive to dissociation and adsorption of H2 on the catalyst surface. The analysis of the hydrogen desorption amounts is shown in the table. Since the reaction is carried out at 230 °C, Hγ is more related to the hydrogenation reaction. As shown in the table, the amount of Hγ desorbed increased as the Al content increased. All these indications suggest that the addition of Al contributes to the adsorption of hydrogen in the reaction and enhances the hydrogenation ability of the catalyst. This contributes the conversion of carbon dioxide and the production of methanol, thus improving the selectivity of methanol.3.7 CO2-TPD
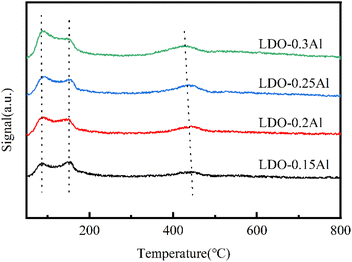
The CO2-TPD curve is shown in Fig. 9, showing three desorption peaks at 120 °C, 273 °C, and 436 °C. Peaks at 120 °C, 273 °C, and 436 °C should be attributed to weak Brønsted basic sites (OH groups), intermediate Lewis base sites (O2− coordinated with Cu2+), and strong Lewis base sites (O2−), respectively.51,62 The peak position of the five catalysts in the low and medium temperature zones were almost unchanged, indicating that they were independent of aluminum content. The dense desorption peak centered should be related to the presence of oxygen defects, that is, due to the oxygen vacancies formed during calcination. It can be seen that with the increase of aluminum content, the peak position of strong alkalinity shifts to the low-temperature region, and the peak intensity becomes larger, which is also consistent with the part of XPS related to oxygen vacancies (Table 4).| Catalyst | Peak I | Peak II | Peak III | ||||||
|---|---|---|---|---|---|---|---|---|---|
| T (°C) | Area (a.u.) | Desorption amount (μmol g−1) | T (°C) | Area (a.u.) | Desorption amount (μmol g−1) | T (°C) | Area (a.u.) | Desorption amount (μmol g−1) | |
| LDO–0.15Al | 96 | 0.31 | 26.7 | 138 | 0.44 | 38.3 | 433 | 0.64 | 55.4 |
| LDO–0.2Al | 97 | 0.28 | 25.0 | 147 | 0.76 | 67.3 | 439 | 1.25 | 111.4 |
| LDO–0.25Al | 95 | 0.28 | 26.0 | 153 | 0.70 | 63.4 | 452 | 1.37 | 125.4 |
| LDO–0.3Al | 97 | 0.36 | 30.0 | 163 | 0.84 | 70.6 | 472 | 2.68 | 223.7 |
3.8 Catalysts performance
Table 5 summarizes the appraisal results of the four catalysts, and it can be seen that the conversion of CO2 increased from 10.91% to 14.87%, and the selectivity of methanol increased from 22.12% to 39.53% with the increase in aluminum content. Combining the results of BET, XRD, and electron microscopy, with the increase in aluminum content, the size of the particles decreased and the specific surface area increased. At the same time, according to the characterization of TPR, H2-TPD, the addition of aluminum makes it the catalyst easy to reduce and enhance the dissociation adsorption capacity of hydrogen. In the characterization of XPS and CO2-TPD, it can be seen that in the range of 15–30% aluminum content, as the aluminum content increases, the basic site of the catalyst increases, and the oxygen vacancy increases, which contributes to the dissociation and adsorption of CO2. The stronger the adsorption performance of the catalyst on CO2, the more conducive it is to the stability of intermediate species such as HCOO* and H2CO*, and the more conducive it is to the formation of methanol.| Catalysts | XCO2 (%) | SCO (%) | Distribution of hydrocarbons (%) | Carbon balance (%) | |||
|---|---|---|---|---|---|---|---|
| Alkane | Alkene | Methanol | C2+OH | ||||
| LDO–0.15Al | 10.91 | 18.92 | 72.61 | 2.44 | 22.12 | 2.83 | 97.52 |
| LDO–0.2Al | 13.53 | 19.40 | 65.53 | 2.14 | 28.11 | 4.22 | 96.73 |
| LDO–0.25Al | 14.06 | 20.26 | 58.36 | 1.48 | 37.85 | 2.31 | 97.12 |
| LDO–0.3Al | 14.87 | 21.11 | 56.14 | 1.24 | 39.53 | 3.09 | 98.13 |
4. Conclusions
In this paper, LDO catalysts with different aluminum contents (15–30%) were prepared by the co-precipitation method, and the effect of aluminum on the catalyst hydrogenation to methanol was investigated. The catalyst structures were investigated using XRD, Ar physisorption desorption, H2-TPR, H2-TPD, CO2-TPD, XPS, and TEM characterization techniques, and the reaction performance of the catalysts was evaluated using a miniature fixed-bed reactor.The results of Ar physisorption desorption and transmission electron microscopy showed that the addition of Al resulted in smaller particles and increased BET-specific surface area of the catalyst. XRD and TEM images showed that the Cu and Fe species were highly dispersed after calcination. The addition of Al was found to have a significant effect on the physicochemical and catalytic properties of the catalysts by TPD, TPR, and XPS characterization. When the aluminum content increased, the surface basic sites increased, and H2 and CO2 dissociation and adsorption were enhanced, which contributed to the reaction and methanol production. The results showed that the catalyst had the best conversion (14.87%) and the highest methanol selectivity (39.53%) when the aluminum content was 30%.
Author contributions
Jing Tian: conceptualization, methodology, investigation, writing – original draft, visualization. Weixin Qian: writing – review & editing, supervision, funding acquisition. Haitao Zhang: resources, funding acquisition. Hongfang Ma: funding acquisition. Weiyong Ying: writing – review & editing, supervision, funding acquisition.Conflicts of interest
There are no conflicts to declare.Acknowledgements
We gratefully acknowledge the financial support from the National High Technology Research and Development Plan of China (863 plan, 2011AA05A204), the Fundamental Research Funds for the Central Universities (No. JKA01231712) and National Natural Science Foundation of China (Grant No. 21706068).References
- O. Hoegh-Guldberg, D. Jacob, M. Taylor, T. G. Bolanos, M. Bindi, S. Brown, I. A. Camilloni, A. Diedhiou, R. Djalante, K. Ebi, F. Engelbrecht, J. Guiot, Y. Hijioka, S. Mehrotra, C. W. Hope, A. J. Payne, H. O. Portner, S. I. Seneviratne, A. Thomas, R. Warren and G. Zhou, Science, 2019, 365(1263), eaaw6974 CrossRef CAS PubMed.
- R. Czarnota, E. Knapik, P. Wojnarowski, D. Janiga and J. Stopa, Arch. Min. Sci., 2019, 64, 487–498 CAS.
- A. Basu, J. Akhtar, M. H. Rahman and M. R. Islam, Pet. Sci. Technol., 2004, 22, 1343–1368 CrossRef CAS.
- R. W. Baker, Ind. Eng. Chem. Res., 2002, 41, 1393–1411 CrossRef CAS.
- M. Freemantle, Chem. Eng. News, 2005, 83, 49–50 Search PubMed.
- S. Y. W. Chai, L. H. Ngu and B. S. How, Greenh. Gases: Sci. Technol., 2022, 12, 394–427 CrossRef CAS.
- A. D. Ebner and J. A. Ritter, Sep. Sci. Technol., 2009, 44, 1273–1421 CrossRef CAS.
- S. K. Shukla, S. G. Khokarale, T. Q. Bui and J.-P. T. Mikkola, Front. Mater., 2019, 6, 42 CrossRef.
- S. J. Chen, M. Zhu, Y. Fu, Y. X. Huang, Z. C. Tao and W. L. Li, Appl. Energy, 2017, 191, 87–98 CrossRef CAS.
- V. Hiremath, R. Shavi and J. G. Seo, Chem. Eng. J., 2017, 308, 177–183 CrossRef CAS.
- A. Kongnoo, S. Tontisirin, P. Worathanakul and C. Phalakornkule, Fuel, 2017, 193, 385–394 CrossRef CAS.
- K. S. Lakhi, W. S. Cha, S. Joseph, B. J. Wood, S. S. Aldeyab, G. Lawrence, J.-H. Choy and A. Vinu, Catal. Today, 2015, 243, 209–217 CrossRef CAS.
- A. A. Olajire, J. CO2 Util., 2017, 17, 137–161 CrossRef CAS.
- J. Yu, L.-H. Xie, J.-R. Li, Y. Ma, J. M. Seminario and P. B. Balbuena, Chem. Rev., 2017, 117, 9674–9754 CrossRef CAS PubMed.
- H. Yang, M. Luo, X. Chen, X. Zhao, J. Lin, D. Hu, D. Li, X. Bu, P. Feng and T. Wu, Inorg. Chem., 2017, 56, 14999–15005 CrossRef CAS PubMed.
- O. K. Farha, I. Eryazici, N. C. Jeong, B. G. Hauser, C. E. Wilmer, A. A. Sarjeant, R. Q. Snurr, S. T. Nguyen, A. Ö. Yazaydın and J. T. Hupp, J. Am. Chem. Soc., 2012, 134, 15016–15021 CrossRef CAS PubMed.
- T. A. Atsbha, T. Yoon, P. Seongho and C. J. Lee, J. CO2 Util., 2021, 44, 101413 CrossRef CAS.
- S. X. Shao, C. Q. Cui, Z. Y. Tang and G. D. Li, Nano Res., 2022, 15(12), 10110–10133 CrossRef CAS.
- S. N. Zhang, Z. X. Wu, X. F. Liu, K. M. Hua, Z. L. Shao, B. Y. Wei, C. J. Huang, H. Wang and Y. H. Sun, Top. Catal., 2021, 64, 371–394 CrossRef CAS.
- J. Niu, H. Liu, Y. Jin, B. Fan, W. Qi and J. Ran, Int. J. Hydrogen Energy, 2022, 47, 9183–9200 CrossRef CAS.
- P. Gao, H. Yang, L. Zhang, C. Zhang, L. Zhong, H. Wang, W. Wei and Y. Sun, J. CO2 Util., 2016, 16, 32–41 CrossRef CAS.
- K. Chang, T. Wang and J. G. Chen, Appl. Catal., B, 2017, 206, 704–711 CrossRef CAS.
- F. Zhao, M. Gong, Y. Zhang and J. Li, J. Porous Mater., 2016, 23, 733–740 CrossRef CAS.
- J. Wu, M. Saito, M. Takeuchi and T. Watanabe, Appl. Catal., A, 2001, 218, 235–240 CrossRef CAS.
- E. Gardner, J. Am. Chem. Soc., 2006, 128, 10633–10634 CrossRef CAS.
- G. R. Williams and D. O'Hare, J. Mater. Chem., 2006, 16, 3065–3074 RSC.
- S.-T. Zhang, H. Yan, M. Wei, D. G. Evans and X. Duan, J. Phys. Chem. C, 2012, 116, 3421–3431 CrossRef CAS.
- G. Chen, H. Wan, W. Ma, N. Zhang, Y. J. Cao, X. H. Liu, J. Wang and R. Z. Ma, Adv. Energy Mater., 2020, 10(11), 1902535 CrossRef CAS.
- J. He, M. Wei, B. Li, Y. Kang, D. G. Evans and X. Duan, in Layered Double Hydroxides, ed. X. Duan and D. G. Evans, Springer Berlin Heidelberg, Berlin, Heidelberg, 2006, pp. 89–119, DOI:10.1007/430_006.
- G. R. Williams, A. I. Khan and D. O'Hare, in Layered Double Hydroxides, ed. X. Duan and D. G. Evans, Springer Berlin Heidelberg, Berlin, Heidelberg, 2006, pp. 161–192, DOI:10.1007/430_002.
- P. Benito, M. Herrero, F. M. Labajos and V. Rives, Appl. Clay Sci., 2010, 48, 218–227 CrossRef CAS.
- F. Cavani, F. Trifirò and A. Vaccari, Catal. Today, 1991, 11, 173–301 CrossRef CAS.
- Q. Wang and D. O'Hare, Chem. Rev., 2012, 112, 4124–4155 CrossRef CAS PubMed.
- A. I. Khan and D. O'Hare, J. Mater. Chem., 2002, 12, 3191–3198 RSC.
- A. I. Khan, A. Ragavan, B. Fong, C. Markland, M. O'Brien, T. G. Dunbar, G. R. Williams and D. O'Hare, Ind. Eng. Chem. Res., 2009, 48, 10196–10205 CrossRef CAS.
- C. Manzi-Nshuti, D. Wang, J. M. Hossenlopp and C. A. Wilkie, J. Mater. Chem., 2008, 18, 3091–3102 RSC.
- R. C. Singh, M. P. Singh, O. Singh and P. S. Chandi, Sens. Actuators, B, 2009, 143, 226–232 CrossRef.
- S. H. Joo, J. Y. Park, C.-K. Tsung, Y. Yamada, P. Yang and G. A. Somorjai, Nat. Mater., 2009, 8, 126–131 CrossRef CAS PubMed.
- G. Fan, F. Li, D. G. Evans and X. Duan, Chem. Soc. Rev., 2014, 43, 7040–7066 RSC.
- K. Yan, Y. Liu, Y. Lu, J. Chai and L. Sun, Catal. Sci. Technol., 2017, 7, 1622–1645 RSC.
- J. Feng, Y. He, Y. Liu, Y. Du and D. Li, Chem. Soc. Rev., 2015, 44, 5291–5319 RSC.
- S. T. Zhang, Y. Dou, J. Zhou, M. Pu, H. Yan, M. Wei, D. G. Evans and X. Duan, Chemphyschem, 2016, 17, 2754–2766 CrossRef CAS PubMed.
- Z. Xu, N. Wang, W. Chu, J. Deng and S. Luo, Catal. Sci. Technol., 2015, 5, 1588–1597 RSC.
- Z. Guo, D. Liu, S. H. Lim, Y. Liu and W. Chu, Green Chem., 2019, 21, 5999–6011 RSC.
- C. Sun, K. Świrk Da Costa, D. Wierzbicki, M. Motak, T. Grzybek and P. Da Costa, Int. J. Hydrogen Energy, 2021, 46, 12169–12179 CrossRef CAS.
- J. Liu, A. Zhang, X. Jiang, M. Liu, Y. Sun, C. Song and X. Guo, ACS Sustainable Chem. Eng., 2018, 6, 10182–10190 CrossRef CAS.
- B. Yang, X. Yu, A. Halder, X. Zhang, X. Zhou, G. J. A. Mannie, E. Tyo, M. J. Pellin, S. Seifert, D. Su and S. Vajda, ACS Sustainable Chem. Eng., 2019, 7, 14435–14442 CrossRef CAS.
- M. Thommes, K. Kaneko, A. V. Neimark, J. P. Olivier, F. Rodriguez-Reinoso, J. Rouquerol and K. S. W. Sing, Pure Appl. Chem., 2015, 87, 1051–1069 CrossRef CAS.
- M. Behrens, I. Kasatkin, S. Kühl and G. Weinberg, Chem. Mater., 2010, 22, 386–397 CrossRef CAS.
- T. K. Liu, D. Xu, D. D. Wu, G. L. Liu and X. L. Hong, ACS Sustainable Chem. Eng., 2021, 9, 4033–4041 CrossRef CAS.
- O. Martin, A. J. Martín, C. Mondelli, S. Mitchell, T. F. Segawa, R. Hauert, C. Drouilly, D. Curulla-Ferré and J. Pérez-Ramírez, Angew. Chem., Int. Ed., 2016, 55, 6261–6265 CrossRef CAS PubMed.
- H. Chen, H. S. Cui, Y. Lv, P. L. Liu, F. Hao, W. Xiong and H. A. Luo, Fuel, 2022, 314, 123035 CrossRef CAS.
- X. Y. Gao, P. Cai, Z. Y. Wang, X. M. Lv and S. Kawi, Top. Catal., 2023, 66, 299–325 CrossRef CAS.
- M. Lenglet, P. Foulatier, J. Düeb and J. Arséne, Phys. Status Solidi A, 1986, 94, 461–466 CrossRef CAS.
- F. Li, L. Zhang, D. G. Evans and X. Duan, Colloids Surf., A, 2004, 244, 169–177 CrossRef CAS.
- X. Y. Han, K. G. Fang, J. Zhou, L. Zhao and Y. H. Sun, J. Colloid Interface Sci., 2016, 470, 162–171 CrossRef CAS PubMed.
- S. Qin, C. Zhang, J. Xu, Y. Yang, H. Xiang and Y. Li, Appl. Catal., A, 2011, 392, 118–126 CrossRef CAS.
- W. Gao, Y. F. Zhao, J. M. Liu, Q. W. Huang, S. He, C. M. Li, J. W. Zhao and M. Wei, Catal. Sci. Technol., 2013, 3, 1324–1332 RSC.
- N. Lohitharn and J. G. Goodwin, J. Catal., 2008, 260, 7–16 CrossRef CAS.
- G. Wang, Y. Zuo, M. Han and J. Wang, React. Kinet., Mech. Catal., 2010, 101, 443–454 CrossRef CAS.
- H. Y. Suo, S. G. Wang, C. H. Zhang, J. Xu, B. S. Wu, Y. Yang, H. W. Xiang and Y. W. Li, J. Catal., 2012, 286, 111–123 CrossRef CAS.
- Y. Chen, H. F. Hong, J. Y. Cai and Z. H. Li, Chemcatchem, 2021, 13, 656–663 CrossRef CAS.
| This journal is © The Royal Society of Chemistry 2023 |

