 Open Access Article
Effect of acid treatment on boosting the photoelectrochemical performance of doped and codoped α-Fe2O3 photoanodes†
Yujie Wang *,
Jinlong Liu,
Jie Xu
 and
Xiaobin Hao
School of Materials and Chemical Engineering, Chuzhou University, Chuzhou, Anhui 239000, China. E-mail: wangyj120@163.com
First published on 5th June 2023
Abstract
Acid treatment of Ti-doped α-Fe2O3 photoanode can reduce the onset potential and promote the photocurrent density for photoelectrochemical (PEC) water splitting reaction. However, the inner mechanism of how this occurs has not yet been clarified. This report compares the effect of HCl hydrothermal treatment on α-Fe2O3 photoanodes doped with Ge, Pt, Ti, and Sn or codoped with TiGe, TiPt, and TiSn. The findings show that the promotion effect of HCl hydrothermal treatment was far less significant on the Ge-, Pt-, and Sn-doped α-Fe2O3 than on the Ti-doped one. In contrast, the codoped photoanodes could realize a lift in the photocurrent of up to 39% at 1.23 VRHE (versus the reversible hydrogen electrode) and a reduction in the potential onset by ∼60 mV after HCl hydrothermal treatment. Anatase TiO2 was detected by Raman spectroscopy on the Ti-doped α-Fe2O3 with adequate treatment in HCl solution. Thus, the performance promotion by acid treatment was ascribed to the surface-concentrated Ti–O bonds acting as a passivation layer that could increase the charge-capture capacity and reduce the charge-transfer resistance, as demonstrated by the potential-modulated electrochemical impedance spectroscopy results. HCl treatment of the in situ-doped α-Fe2O3 and an excessive treatment time for the ex situ-doped α-Fe2O3 caused an inhibition in the PEC performance, which could be attributed to the adverse effect of lattice defects induced by acid corrosion. The application scope of HCl treatment on the doped α-Fe2O3 was determined by revealing its working mechanism.
1. Introduction
To meet the demand for energy structure optimization and environmental protection, photoelectrochemical (PEC) water splitting was developed as an efficient and direct way to convert solar energy to hydrogen energy.1,2 The decisive factors in achieving a high solar to hydrogen efficiency for a PEC system are the photoabsorption capacity, separation efficiency of the photogenerated electrons/holes, and transfer efficiency of the photogenerated electrons/holes to water reduction/oxidation reactions on the photoelectrodes.3–5 An optimal photoelectrode should meet the following requirements: (1) the conduction and valence bands should straddle the water reduction and oxidation potentials and (2) a narrow bandgap for absorbing a substantial portion of solar light.3 In the choice of photoanode material for water oxidation, hematite (α-Fe2O3) is regarded as one of the most promising candidates, motivated by its broad photoabsorption scope up to 600 nm, superior stability, nontoxicity, and relatively high photon-transfer efficiency.6,7 Unfortunately, besides its conduction band being lower than the water reduction potential, there are some urgent issues on the α-Fe2O3 photoanode that remain to be addressed, including the deactivation of photogenerated carriers by bulk recombination due to the low electron mobility and the loss of voltage input due to its sluggish water oxidation kinetics induced by severe surface states acting as surface charge-recombination centers.8–10Doping with high-valence ions, such as Ti4+,11 Sn4+,12 Pt4+,13 or Ge4+,14 is one of the most powerful approaches for α-Fe2O3 modification, and has been adopted to considerably improve the electron conductivity and promote the photocurrent density of the α-Fe2O3 photoanode.15,16 There are two conventional methods to incorporate dopants in the α-Fe2O3 photoanode: by adding the dopant precursor during material synthesis (in situ doping) or by treating with the dopant precursor before high-temperature annealing (ex situ doping).17,18 By in situ doping, the dopant is distributed homogeneously in the bulk α-Fe2O3. On the contrary, the dopant in the ex situ method is concentrated on the surface and disperses in a gradient form. Recent works have looked more into the codoping strategy with two foreign elements, which can further promote the photocurrent density compared with monodoping.19–23 Sn and Mo codoping in α-Fe2O3 has realized a photocurrent density of 1.97 mA cm−2 at 1.23 V versus the reversible hydrogen electrode (VRHE), which is much enhanced compared with Sn-Fe2O3 and α-Fe2O3.24 Furthermore, by Pt and P codoping, Shao et al.20 improved the photocurrent density of α-Fe2O3 to 2.61 mA cm−2 at 1.23 VRHE. Unfortunately, it has been found that doping always induces a positive shift of the photocurrent onset of the α-Fe2O3 nanostructured photoanode. For instance, although Ti-doped α-Fe2O3 (Ti-Fe2O3) exhibited a remarkably higher photocurrent density than the pristine Fe2O3, there was an increase of ∼100 mV in the onset potential (Von) after Pt doping.25 This has been attributed to the aggregation of doping, causing excess surface states and further restricting the water oxidation kinetics.26
Efforts have been made to reduce the onset potential of the doped α-Fe2O3 photoanode. Besides the conventional and universal method of cocatalyst loading,27,28 a surface corrosion method by acid treatment on the prepared Ti-Fe2O3 was reported by Cao et al.,29 which shifted the onset potential cathodically by about 100 mV and increased the photocurrent density by over three times at 1.0 VRHE. Similarly, Xiao et al.30 enhanced the photocurrent density and lowered the onset potential by ca. 100 mV for the Fe2O3:Ti photoanode with HCl hydrothermal treatment. However, the working principle of acid treatment is still under debate. Cao et al.29 proposed a back reaction suppression mechanism, but performed no underlying structural analysis. On the contrary, Xiao et al.30 believed the induced surface defects with chemisorbed oxygen played a role in promoting the charge transfer in surface states and in suppressing the bulk charge recombination. Interestingly, both reports were focused on Ti-doped Fe2O3, although the doping method was different, being in situ and ex situ doping, respectively. It is also intriguing to determine if this acid treatment would be effective on α-Fe2O3 photoanodes with other dopants, such as Pt, Sn, Ge, or the associated codoped α-Fe2O3 photoanodes.
This work expands this enigma and systematically compares the effect of HCl hydrothermal treatment on doped α-Fe2O3 photoanodes with four different dopants (Ti, Sn, Pt, Ge) imported by both in situ- and ex situ-doping methods. Aiming for higher performance and a universal comparison, codoped α-Fe2O3 photoanodes with TiSn, TiPt, and TiGe pairs were also prepared and treated by HCl hydrothermal treatment. The effect of HCl treatment on the PEC performance was compared, and the working mechanism of HCl treatment on the performance enhancement in the Ti-doped α-Fe2O3 photoanodes was discussed.
2. Experimental details
2.1 Materials
Iron(III) chloride hexahydrate (FeCl3·6H2O, 99%, Greagent, Shanghai), sodium acetate (CH3COONa, 99%, Guangfu, Tianjin), hydrochloric acid (HCl, 37%, Adamas, Shanghai), titanium(IV) chloride (TiCl4, 99.6%, Alfa Aesar), chloroplatinic acid hexahydrate (H2PtCl6·6H2O, 99.9%, Adamas), tin(IV) chloride pentahydrate (SnCl4·5H2O, 98%, Adamas, Shanghai), germanium Oxide (GeO2, 99.999%, Adamas, Shanghai), and potassium hydroxide (KOH, 90%, powder, Greagent, Shanghai) were used as received.2.2 Electrodes preparation
First, the FeOOH electrodes were prepared by placing fluorine-doped tin oxide glasses (FTO, 1 × 2 cm2) in a 20 mL aqueous solution of 0.09 M FeCl3·6H2O, 0.1 M CH3COONa, and 0.23 mL HCl and hydrothermally treating at 95 °C for 135 min. Then, the FeOOH was cleaned with ultrapure water and immersed in 40 mM GeO2 aqueous solution for 30 min, and then 25 μL of 40 μM H2PtCl6 ethanol solution was added or the electrode was dip-coated with 10 mg mL−1 TiCl4 or 10 mg mL−1 SnCl4, before calcination at 550 °C for 2 h and 750 °C for 30 min to prepare the Ti-, Sn-, Pt-, or Ge-doped α-Fe2O3 electrodes (labeled as Ti, Sn, Pt, or Ge). The TiGe-, TiPt-, or TiSn-codoped α-Fe2O3 electrodes were prepared similarly by adding Ti and the other precursor on FeOOH following the proper sequence (labeled as TiGe, TiPt, or TiSn).2.3 HCl hydrothermal treatment
The above pristine, doped, and codoped α-Fe2O3 electrodes were hydrothermally treated in 12 mL 0.05 M HCl at 95 °C for 1 h or 2 h (labeled as H1 or H2, e.g., TiGe-H1 or TiGe-H2).2.4 PEC measurements
PEC tests, including linear sweep voltammetry (I–V curve), chronoamperometry (I–t curve), and electrochemical impedance spectroscopy (EIS), were performed on an electrochemical workstation (CHI 660D, Chenhua) using a three-electrode system with the α-Fe2O3 electrode (working area of 1 × 1 cm2) as the photoanode, a Pt net (1.5 × 1.5 cm2) as the cathode, Hg/HgO as the reference electrode, and 1.0 M KOH (pH 14.0) solution as the electrolyte. A xenon lamp (CeauLight, CEL-S500-T5) was used as the AM 1.5G simulated light emitter. The light intensity irradiated on the front side of photoanodes was 100 mW cm−2.The bias potential versus RHE was calculated using the Nernst equation:
| VRHE = VHg/HgO + 0.014 + 0.0592pH | (1) |
The J–V curves were scanned at a sweep rate of 20 mV s−1. The potential-simulated EIS plots were collected at frequencies ranging from 0.1 MHz to 0.1 Hz under AM 1.5G simulated light illumination with the potential ranging from −0.2 to 0.25 VHg/HgO. The charge-injecting efficiencies were calculated by dividing the photocurrent density in 0.5 M H2O2–1 M KOH electrolyte by that in 1 M KOH electrolyte. The electrochemical specific surface area (ECSA) was estimated with capacitive currents from the cyclic voltammetry (CV) analysis of the electrodes with scanning rates from 20 to 120 mV s−1 at an interval of 20 mV s−1 using the following equation:31
| ECSA = Cdl/Cs | (2) |
2.5 Characterizations
Schottky field emission scanning electron microscopy (FE-SEM, SU5000, Hitachi, Japan) and scanning/transmission electron microscopy (S/TEM, FEI TalosF200S) were used for the morphology observations. Confocal Raman spectrometry (inVia™, Renishaw, UK) was used for obtaining the Raman spectra. X-Ray photoelectron spectroscopy (XPS, ESCALAB 250Xi, Thermo, USA) was used for valence state analysis. The XPS spectra calibration was done with the binding energy of the C 1s peak at 284.8 eV.3. Result and discussions
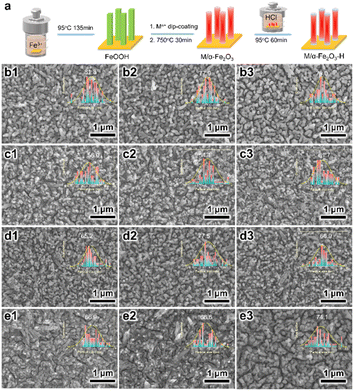
As illustrated in Fig. 1a, the pristine α-Fe2O3 electrodes were prepared on FTO substrates through the traditional method, with the hydrothermally synthesized β-FeOOH acting as the precursor, which was converted to α-Fe2O3 after high-temperature annealing. To accomplish element doping, the Ti, Ge, Pt, or Sn precursor solution was added to the hydrothermal reaction solution or deposited on the β-FeOOH surface, which are recognized as the in situ and ex situ methods, respectively. Codoped α-Fe2O3 electrodes were prepared by depositing the Ti and another element precursor (Ge, Pt, and Sn) on the β-FeOOH surface in the appropriate sequence. Thereby, four in situ single-doped (labeled as Tiin, Gein, Ptin and Snin), four ex situ single-doped (labeled as Ti, Ge, Pt, and Sn), and three ex situ codoped (TiGe, TiPt, and TiSn) α-Fe2O3 electrodes were prepared. Then all the electrodes were hydrothermally treated in 0.05 M HCl solution for 1 h (H1) or 2 h (H2). The electrodes of Ti, TiGe, TiPt and TiSn before and after HCl treatment for 1 and 2 h were observed by SEM, as shown in Fig. 1b–e. All the electrodes demonstrated a uniform nanorod structure, but the diameter varied with changing the doping elements. An exception is that an unshaped form could be seen on the TiSn sample, whereas the nanorods on the other samples showed smooth surfaces. The diameter distributions of the nanorods are shown in the insets. The average diameters of the Ti, TiGe, TiPt, and TiSn were 81.3, 56.0, 65.2, and 66.9 nm, suggesting that Ge, Pt, and Sn codoping with Ti could substantially reduce the diameter of the nanorods. Such a reduction in nanorod diameter shortens the transport distance of holes, which is in favor of reducing the recombination probability of photogenerated electrons and holes in the bulk. Moreover, HCl hydrothermal treatment barely affected the morphology or the nanorod size. Noteworthily, the unshaped form on TiSn was reduced and removed after HCl treatment for 1 and 2 h, respectively, proving that part of the materials was dissolved by acid corrosion. The ECSAs of the Ti, TiGe, TiPt, and TiSn samples were calculated by CV with varying the scanning rate, as plotted in Fig. S1.† The ECSAs of TiGe and TiSn were similar (0.56 versus 0.54), and were higher than those of Ti and TiPt (0.40 versus 0.38). This demonstrates that the ECSA was affected by the density rather than the sizes of the nanostructures. Except for the increase in the ECSA of the Ti samples, the ECSAs were barely changed by HCl treatment. The extraordinary ECSA increase for Ti may be related to nanoparticles formed by acid corrosion.The Raman spectra of the electrodes are shown in Fig. 2. The typical symmetric vibration modes, including two A1g modes at 223 and 496 cm−1 and five Eg modes at 243, 289, 299, 407, and 609 cm−1, were identified, demonstrating the main structure of α-Fe2O3. The additional forbidden vibrational mode (LO) at ∼660 cm−1 has been known to stem from surface structural disorders.33 No change was observed in the Raman vibration peaks of α-Fe2O3 on all the electrodes with varying the doping elements or after HCl treatment, demonstrating the maintenance of the structural properties. Nevertheless, there was a significant increase in the intensity of the LO mode on TiSn compared with the other samples, as embodied by the higher intensity ratio of the LO mode versus Eg mode at 609 cm−1 on TiSn. A higher LO mode corresponds to more surface disorder, coincident with the unshaped forms seen in the SEM images (Fig. 1e), implying the amorphous nature of the unshaped form induced by Sn codoping. Interestingly, a new peak at 142 cm−1 was detected on the Ti-H2 sample, ascribed to the Eg mode of anatase TiO2.34 However, no such rise was observed on the other Ti-doped or H2 samples. The emergence of the TiO2 phase on the Ti ex situ-doped samples after HCl treatment for 2 h implied the phase corrosion by the acid acted on the pure α-Fe2O3 phase but with no harm to the Ti dopant. This is reasonable because α-Fe2O3 is acid dissolvable, but TiO2 is acid tolerant. Thus, it was deduced that with the continuous dissolution of α-Fe2O3 in HCl solution, the remaining Ti accumulates and forms the TiO2 phase under the hydrothermal condition. In terms of the other HCl-treated samples, the co-dopant could isolate the Ti atoms and inhibit the reconstitution of the chemical bonds.
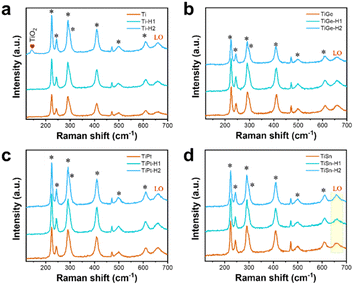 | ||
| Fig. 2 Raman spectra of the (a) Ti, (b) TiGe, (c) TiPt, and (d) TSn electrodes before and after HCl treatment for 1 and 2 h. | ||
The high-resolution XPS spectra of the electrodes are depicted in Fig. 3 and 4, and give detailed information on the elements, chemical valences, and defect states. The Fe 2p region on each sample consisted of a doublet 2p3/2 and 2p1/2, topped at 710.7 and 724.3 eV, respectively, coupled with satellite peaks (Fig. 3a). The satellite peak topped at ∼719 eV was indicative of Fe3+. No sign of Fe2+’s existence was seen from the Fe 2p orbitals, indicating that the high-valence dopant made no difference to the electronic structure of Fe. No noticeable change in the Fe 2p spectra was seen for the Ti, TiGe, and TiPt samples before and after HCl treatment. However, a strong peak at 715.7 eV existed in the Fe 2p spectra on the TiSn samples, assigned to the Sn 3d orbital. The peak intensity of the Sn 3d orbital decreased after HCl treatment for 1 h and disappeared completely after 2 h, indicating that the Sn atoms were removed during acid dissolution. Thus, there was a discrepancy in the acid stability between the doped Ti and Sn, as the former was concentrated, but the latter was dissolved. As seen from the Ti 2p region in Fig. 3b, the Ti 2p3/2 orbit located at 458.0 eV proved the existence of Ti4+.35 It was noticeable that there was a slight shift of the Ti 2p orbits to a higher binding energy on the Ti, TiGe, and TiPt samples after HCl treatment. According to the literature, the binding energy of the Ti 2p3/2 orbit on anatase TiO2 is 459.1 eV, much higher than that of doped Ti4+.34 So, this further signified the concentration and reconstruction of the Ti–O bond. It was observed that the binding energy of the Ti 2p3/2 orbit of TiSn was 458.2 eV. The higher binding energy of TiSn than Ti indicates that Sn doping affected Ti's electron structure since Sn's electronegativity was higher than that of Ti. By contrast, no shift in Ti 2p orbits was seen on the TiGe and TiPt samples, which should be related to the much lower doping amount of Ge and Pt. When TiSn was treated in HCl for 2 h, the Ti 2p orbits shifted to a lower binding energy of 458.0 eV, the same as Ti, which should be due to the removal of surface Sn. The weak Ge 2p signal topped at 1222.4 eV verified the existence of Ge4+ (Fig. 3c). There was only a negligible signal for Pt in the Pt 4f region in Fig. 3d because of the meager doping amount. Fig. 3e displays the typical peaks of Sn 3d5/2 at 486.0 eV and Sn 3d3/2 at 496.5 eV, which are typical for Sn4+.18 The peak intensity decreased significantly in the Sn 3d spectra with increasing the HCl treatment time, which was synchronous with that of Sn 3p (Fig. 3a).
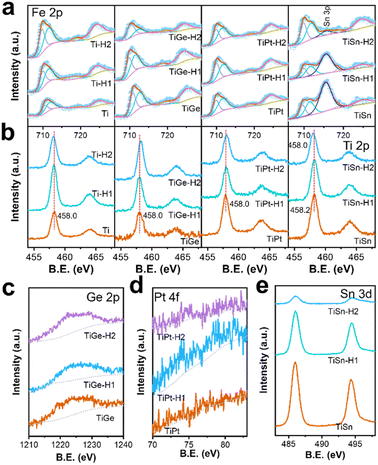 | ||
| Fig. 3 XPS spectra of the (a) Fe 2p, (b) Ti 2p, (c) Ge 2p, (d) Pt 4f and (e) Sn 3d regions of the α-Fe2O3 electrodes. | ||
As shown in Fig. 4a, the O 1s spectra consisted of two convoluted peaks centered at 529.5 and 532.2 eV, respectively, ascribed to the oxygen bonding to metal ions (lattice oxygen, OL and absorbed oxygen, OA).36 The binding energies of both oxygen species were almost constant, but the relative content of OL and OA varied. The peak area ratios of OL and OA were calculated and compared in Fig. 4b. The OL/OA ratio kept going down for the Ti sample after HCl treatment, indicating HCl corrosion induced oxygen defects on the surface, consistent with the literature.30 The codoped samples followed the same trend, indicating that the formation of oxygen defects by HCl corrosion was independent of the doping element.
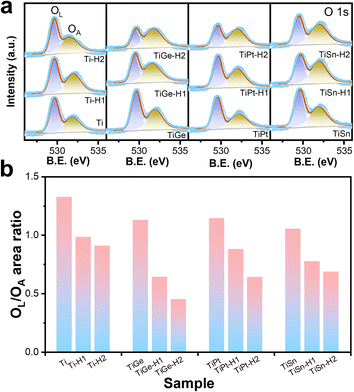 | ||
| Fig. 4 XPS spectra of the (a) O 1s region and (b) the area ratios of OL to OA of the α-Fe2O3 electrodes. | ||
The Ti-H2 sample was observed by TEM. A pile of nanorods with diameters ranging from 50–80 nm were observed (Fig. 5a). In the high-resolution TEM image (HRTEM, Fig. 5b), lattice spacings of 0.17 and 0.25 nm were measured, which agreed with the (116) and (110) planes of α-Fe2O3. The element mapping images indicated the Ti element was dispersed on the surface of α-Fe2O3, confirming the expectation that the ex situ method results in the aggregation of the dopant on the surface. No lattice spacing assigned to TiO2 was measured. It is possible that the TiO2 formed by HCl treatment existed in an amorphous phase.
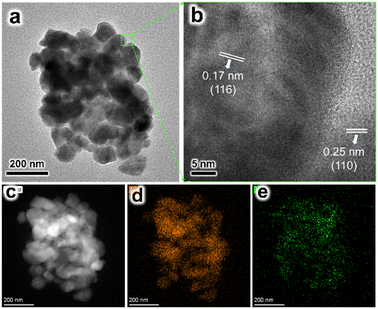 | ||
| Fig. 5 (a) TEM and (b) HRTEM images of the Ti-H2 sample. (c) HAADF-STEM image of the Ti-H2 sample, and the elemental mapping images of (d) Fe and (e) Ti. | ||
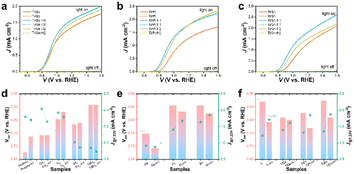
The current density versus potential (J–V) curves of the pristine, in situ- and ex situ-doped α-Fe2O3 photoanodes were measured under AM 1.5G simulated light illumination. Pristine α-Fe2O3 exhibited a low onset potential of 0.7 V and a photocurrent density of 1.659 mA cm−2 at 1.23 VRHE. By in situ doping with Ge, Ti, Sn, or TiSn, the onset potentials all increased, which were 0.766, 0.827, 0.806, and 0.881 V, while the photocurrent densities were 2.018, 1.874, 0.993, and 0.817 mA cm−2 at 1.23 VRHE, respectively (compared in Fig. S2† and 6d). Under a certain amount of in situ doping, Ge and Ti enhanced the PEC performance, whereas Sn showed an adverse effect. It is more important to focus on the impact of HCl treatment on the performance of these photoanodes. As a whole, HCl treatment remarkably inhibited the photocurrent density but had little influence on the onset potential. As for the ex situ monodoping, the onset potentials were 0.771, 0.878, 0.878, and 0.893 V, and the photocurrent densities were 0.877, 1.430, 1.576, and 1.178 mA cm−2 at 1.23 VRHE for the Ge, Pt, Sn, and Ti photoanodes, respectively (Fig. S3† and 6e). It was thus found that the ex situ method could induce the same (Ge doping) or higher onset potential than the in situ method (Ti and Sn doping). By ex situ codoping with TiGe, TiPt, and TiSn, there was a remarkable enhancement in PEC performance, with photocurrent densities of 1.366, 1.284, and 1.303 mA cm−2 at 1.23 VRHE and onset potentials of 0.832, 0.850, and 0.897 V, respectively (Fig. 6a–c and f). It was noticed that HCl treatment lowered the onset potentials and enhanced the photocurrent density of the ex situ-mono- and -codoped α-Fe2O3 photoanodes. For example, the onset potential of Ti-H1 was 0.815 V, reduced by 78 mV, even lower than Tiin. The onset potential differences by HCl treatment of TiGe, TiPt, and TiSn were 8, 58, and 64 mV, respectively. However, the onset potential shifts of the Ge-, Pt-, and Sn-doped samples were much less significant than the Ti-doped ones. Since the ex situ method resulted in a gradient doping with a higher concentration on the surface while the in situ method formed homogeneous doping, the opposite effect in the in situ and ex situ methods by HCl treatment must be related to the dopant distribution in α-Fe2O3. The transient photocurrents for Ti, TiGe, TiPt, and TiSn photoanodes were measured and are shown in Fig. S4.† At a low-bias potential of 0.84 VRHE, strong spike photocurrents were seen when the light was turned on/off. The light and dark spike photocurrents all increased after HCl treatment for 1 h and then decreased slightly after treatment for 2 h. This tendency was consistent with the J–V results. Combined with the Raman and XPS results, it could be concluded that the Ti–O bonds were concentrated on ex situ-Ti-doped Fe2O3 after HCl treatment. It has been reported that TiO2 can serve as the passivation overlayer on α-Fe2O3 to suppress surface electron–hole recombination.37 It could thus be deduced that the concentrated Ti–O on Ti ex situ-doped α-Fe2O3 was essential for reducing the onset potential. Meanwhile, Ge, Pt, and Sn barely showed such an effect.
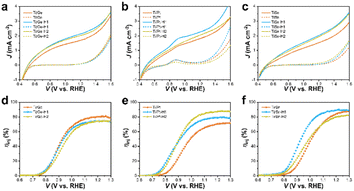
The J–V curves of the mono- and codoped α-Fe2O3 photoanodes with H2O2 as a hole scavenger were collected to investigate the suppressed surface charge recombination and reflect the charge-separation property. As depicted in Fig. S5a–d† and 7a–c, all the photoanodes exhibited a photocurrent density of ca. 2 mA cm−2 at 1.23 VRHE, far lower than the theoretical value (12.8 mA cm−2), implying that the low charge-separation efficiency served as the major drawback for the limited PEC performance of the α-Fe2O3 photoanodes. The charge separation arose from ∼0.5 VRHE, then increased gradually until the dark current onsets. The rate of photocurrent increase for Ge was much faster than that for the rest of the anodes, indicating smoother charge transport. Likewise, the low-bias photocurrent of TiGe was higher than that of the other codoped anodes, e.g., 1.04 versus 0.45 mA cm−2 at 1.0 VRHE compared with TiSn. HCl treatment for 1 h slightly improved the charge separation of all the samples, supposedly due to the surface modification's broadening of the space charge layer. Specifically, an oxidation peak appeared at 0.9 VRHE on the photocurrent and dark current of the Pt and TiPt (Figs S5b† and 7b) photoanodes, which could be assigned to the oxidation of Pt species. This implied that Pt existed as low-valence Pt instead of Pt4+ on the surface. HCl treatment caused a significant decrease in the peak intensity of Pt but only a slight decrease in PtTi, giving hints that the dissolving of Pt atoms was more severe in the Pt sample than in the PtTi sample during HCl corrosion. Recalling the XPS result that Ti atoms survived during corrosion but Sn was significantly dissolved, the situation of Pt is more complicated as Ti can protect Pt from dissolving. Here, ηinj started from 0.7–0.8 V and increased steeply until reaching a plateau. The poor ηinj limited the PEC performance of the α-Fe2O3 photoanodes at low bias and the charge-transport efficiency at high bias. The ηinj plateaus were 82%, 58%, 82%, and 83% for the Ge, Pt, Ti, and Sn anodes, respectively. These indicate that Ti and Sn doping was much more efficient for promoting surface charge transfer than Ge and Pt, also corresponding to the PEC performance sequence.
On the whole, the ηinj was enhanced by HCl treatment for 1 h, but then decreased after treating for 2 h (Fig. S5e–h† and 7d–f). For the codoped anodes, HCl treatment could significantly increase the ηinj plateau from 71.9% to 88.9% for TiPt, but the ηinj of TiGe was only negligibly affected by HCl treatment. For TiSn, HCl treatment increased the ηinj values between 0.8 and 1.2 V but barely affected the plateau. The effect of HCl treatment on TiPt was similar to that on Ti, but it was less significant on TiGe and TiSn, so Ge and Sn codoping inhibited the effect of HCl treatment on Ti-doped α-Fe2O3. Because concentrated Ti–O accelerated the charge transfer on HCl-treated α-Fe2O3, the isolation of Ti by Ge or Sn may reduce the role of HCl treatment. The changes in charge transport and injection followed the same trend due to HCl treatment, which increased first before decreasing. The changes in charge injection were much more significant, and were the main reason for the PEC performance variation.
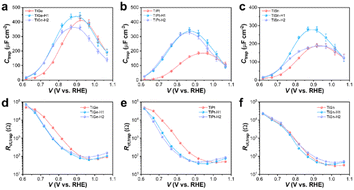
H1 treatment essentially enhanced the ηinj, which was determined by the change in the distribution of surface states. Thereby, potential-modulated EIS measurements were conducted, and the surface capacities (Ctrap) and resistances (Rct,trap) related to hole trapping and transfer in the surface states were fitted according to the known equivalent circuit (Fig. S6†). The Ctrap values represent the hole-capture capability in surface states, while the onset potential typically coincides with the location of Ctrap maximum.38 The Ctrap plots in Fig. S7a–c† present a peak centered at 0.87–0.95 VRHE for the Ge, Ti, and Sn photoanodes, corresponding to their onset potentials with a slight shift to a higher potential. Surprisingly, the Ctrap plots showed a steady increase within the recorded potential range for the Pt photoanode, suggesting that Pt doping significantly broadened the distribution of surface states. Considering the difference in onset potential of Pt (0.878 V) was negligible compared with that of Ti (0.891 V) or Sn (0.878 V), it could be deduced that Pt doping may induce additional surface states with a higher energy level (different kinds of surface states) instead of simply shifting the surface states to a higher energy level.9 Moreover, HCl treatment shifted the surface states on Ge and Ti to a lower energy level but barely affected those on Pt and Sn, which was consistent with the change in the onset potential. The decrease in Rct,trap on Ge and Ti photoanodes also indicated a smaller charge-transfer resistance facilitating charge injection, which explains the increase in photocurrent density (Fig. S7e–h†).
The changes in Ctrap and Rct,trap by HCl treatment were more significant on the codoped photoanodes, as illustrated in Fig. 8a–c. Comparably, the H1 photoanodes of TiGe, TiPt, and TiSn exhibited Ctrap plots topped at a lower potential with larger values than the pristine ones. On the contrary, the Ctrap values of the H2 photoanodes decreased, but the peak location stayed the same. Meanwhile, the Rct,trap values below 1.0 V were remarkably decreased for the TiGe-H1 and TiPt-H1 photoanodes but the difference in Rct,trap values between TiSn and TiSn-H1 was only slight (Fig. 8d–f). Besides, for each codoped photoanode, the Rct,trap values of H1 and H2 were similar. This suggests the surface-concentrated Ti–O species on H1 samples contributed to shifting the surface states to a lower energy level, increasing the hole-trapping capacity and reducing the charge-transfer resistance. The excess lattice defects on H2 samples may be the reason for the decrease in the hole-trapping capacity, which barely affected the charge-transfer resistance. The unusual behavior of TiSn-H1, which only affected the location and density of surface states but not the charge-transfer resistance, may be related to the removal of the Sn dopant.
Based on the above discussion, the effect of HCl treatment on the Ti-, Ge-, Pt-, or Sn-doped photoanodes could be summarized, as shown in Fig. 9. The ex situ-doping method caused a major distribution of the dopants on the surface. Under an appropriate treatment time (1 h), part of the surface Fe–O bonds was removed, resulting in the concentration of M–O bonds, which passivated the surface states and promoted hole transfer. The promoting effect of Ti–O was the greatest among the Ti, Ge, Pt, or Sn dopants. Thus, HCl treatment contributed to a significant performance enhancement of the Ti, TiGe, TiPt, and TiSn photoanodes.
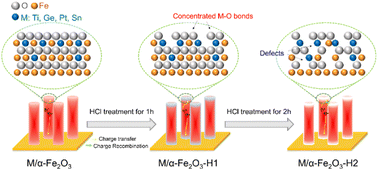 | ||
| Fig. 9 Schematic of the effect of HCl treatment on Ti-doped or TiM (M = Ge, Pt, or Sn) codoped α-Fe2O3. | ||
However, severe HCl treatment (2 h) further corroded the near-surface Fe–O bonds, leaving excess lattice defects that could serve as electron/hole recombination centers. Overall, HCl plays two roles in the ex situ-doped α-Fe2O3: it alters the surface elemental components and forms lattice defects.
4. Conclusions
HCl treatment was conducted on the doped α-Fe2O3 photoanode with various dopants (Ge, Pt, Ti, and Sn) and codopants (TiGe, TiPt, and TiSn). With the ex situ method used to form surface-enriched doping, an increase in photocurrent density and reduction in onset potential after HCl treatment for 1 h were realized. However, the performance enhancement was much more significant on the Ti-involved samples (Ti, TiGe, TiPt, and TiSn) than the others. The Raman spectra indicated the emergence of TiO2 species on Ti-doped α-Fe2O3, which could act as a passivation layer to inhibit the surface charge transfer and shift the surface states to a lower energy level. It was deduced that the surface-concentrated M–O (M represents the dopant) species, especially Ti–O, improved the PEC performance. After HCl treatment for 2 h, the photocurrent density decreased, but the onset potential was unchanged. This was contributed to by the induced surface OV, which increased as the treatment time increased. The pristine and in situ-doped α-Fe2O3 photoanodes (Ge, Ti, Sn, TiSn) suffered from a reduction in photocurrent density because M–O bonds could not be concentrated on the surface in the homogeneous-doped sample. This report reveals the working mechanism of HCl treatment on doped α-Fe2O3, while also determining its application scope and providing guidance for future surface treatment study.Author contributions
Yujie Wang: conceptualization, investigation, methodology, writing – review & editing. Jinlong Liu: methodology, writing – original draft. Jie Xu: methodology. Xiaobin Hao: methodology.Conflicts of interest
There are no conflicts to declare.Acknowledgements
This work has been supported by the University Natural Science Research Key Project of Anhui Province (KJ2020A0707), Anhui Provincial Science and Technology Key R&D Program (2022I07020035), Key Projects of the Excellent Young Talents Support Plan in Universities of Anhui Province (gxyq2021218) and Science and Technology Project of Chuzhou (2022ZD002).References
- A. Eftekhari, V. J. Babu and S. Ramakrishna, Int. J. Hydrogen Energy, 2017, 42, 11078–11109 CrossRef CAS.
- H. Zhang, D. Li, W. J. Byun, X. Wang, T. J. Shin, H. Y. Jeong, H. Han, C. Li and J. S. Lee, Nat. Commun., 2020, 11, 4622 CrossRef PubMed.
- P. Tang and J. Arbiol, Nanoscale Horiz., 2019, 4, 1256–1276 RSC.
- C. Jiang, S. J. A. Moniz, A. Wang, T. Zhang and J. Tang, Chem. Soc. Rev., 2017, 46, 4645–4660 RSC.
- Q. Meng, B. Zhang, L. Fan, H. Liu, M. Valvo, K. Edström, M. Cuartero, R. de Marco, G. A. Crespo and L. Sun, Angew. Chem., Int. Ed., 2019, 58, 19027–19033 CrossRef CAS PubMed.
- P. Wang, C. Ding, D. Li, Y. Cao, Z. Li, X. Wang, J. Shi and C. Li, Dalton Trans., 2022, 51, 9247–9255 RSC.
- X. Zhao, C. Lu, S. Li, Y. Chen, G. Zhang, D. Zhang, K. Feng and J. Zhong, J. Energy Chem., 2022, 69, 414–420 CrossRef CAS.
- J. Xiao, H. Huang, Q. Huang, X. Li, X. Hou, L. Zhao, R. Ma, H. Chen and Y. Li, Appl. Catal., B, 2017, 212, 89–96 CrossRef CAS.
- J. Li, W. Wan, C. A. Triana, H. Chen, Y. Zhao, C. K. Mavrokefalos and G. R. Patzke, Nat. Commun., 2021, 12, 255 CrossRef CAS PubMed.
- B. Du, R. Li, Y. Zhang, X. Chen, R. Tao, Z. Qin, C. Fu and J. Xiao, Int. J. Hydrogen Energy, 2022, 47, 1556–1567 CrossRef CAS.
- J. Park, K. Y. Yoon, T. Kim, H. Jang, M. J. Kwak, J. Y. Kim and J. H. Jang, Nano Energy, 2020, 76, 105089 CrossRef CAS.
- P. S. Shinde, A. Annamalai, J. H. Kim, S. H. Choi, J. S. Lee and J. S. Jang, Sol. Energy Mater. Sol. Cells, 2015, 141, 71–79 CrossRef CAS.
- Y.-S. Hu, A. Kleiman-Shwarsctein, A. J. Forman, D. Hazen, J.-N. Park and E. W. McFarland, Chem. Mater., 2008, 20, 3803–3805 CrossRef CAS.
- K.-Y. Yoon, J. Park, M. Jung, S.-G. Ji, H. Lee, J. H. Seo, M.-J. Kwak, S. Il Seok, J. H. Lee and J.-H. Jang, Nat. Commun., 2021, 12, 4309 CrossRef CAS PubMed.
- C. Li, Z. Luo, T. Wang and J. Gong, Adv. Mater., 2018, 30, 1707502 CrossRef PubMed.
- D. A. Wheeler, G. Wang, Y. Ling, Y. Li and J. Z. Zhang, Energy Environ. Sci., 2012, 5, 6682–6702 RSC.
- A. Annamalai, P. S. Shinde, T. H. Jeon, H. H. Lee, H. G. Kim, W. Choi and J. S. Jang, Sol. Energy Mater. Sol. Cells, 2016, 144, 247–255 CrossRef CAS.
- I. Kwon Jeong, M. A. Mahadik, S. Kim, H. M. Pathan, W.-S. Chae, H. Suk Chung, G. Won Kong, S. Hee Choi and J. Suk Jang, Chem. Eng. J., 2020, 390, 124504 CrossRef CAS.
- H. Zhang, W. Y. Noh, F. Li, J. H. Kim, H. Y. Jeong and J. S. Lee, Adv. Funct. Mater., 2019, 29, 1805737 CrossRef.
- S. Shao, Y. Xiao, J. M. Yang, X. X. Lv, K. Feng, Y. J. Xia, D. Zhang, H. Xu, J. Zhong and J. J. Deng, Chem. Eng. J., 2021, 413, 127416 CrossRef CAS.
- Q. Zhu, C. Yu and X. Zhang, J. Energy Chem., 2019, 35, 30–36 CrossRef.
- P. Huang, X. Miao, J. Wu, P. Zhang, H. Zhang, S. Bai and W. Liu, Dalton Trans., 2022, 51, 8848–8854 RSC.
- S.-F. Duan, Y.-Y. Geng, X.-B. Pan, X.-Q. Yao, Y.-X. Zhao, X. Li, C.-L. Tao and D.-D. Qin, Dalton Trans., 2019, 48, 928–935 RSC.
- J. Xiao, B. Du, S. Hu, J. Zhong, X. Chen, Y. Zhang, D. Cai, S.-F. Zhou and G. Zhan, ACS Appl. Energy Mater., 2021, 4, 10368–10379 CrossRef CAS.
- K. H. Ye, Z. L. Wang, H. B. Li, Y. F. Yuan, Y. C. Huang and W. J. Mai, Sci. China Mater., 2018, 61, 887–894 CrossRef CAS.
- G. Rahman and O.-S. Joo, Mater. Chem. Phys., 2013, 140, 316–322 CrossRef CAS.
- X. Long, P. Wang, J. Jin, X. Zhao and J. Ma, ACS Sustainable Chem. Eng., 2021, 9, 13047–13055 CrossRef CAS.
- D. K. Zhong and D. R. Gamelin, J. Am. Chem. Soc., 2010, 132, 4202–4207 CrossRef CAS PubMed.
- D. Cao, W. Luo, J. Feng, X. Zhao, Z. Li and Z. Zou, Energy Environ. Sci., 2014, 7, 752–759 RSC.
- J. Xiao, F. Zhao, J. Zhong, Z. Huang, L. Fan, L. Peng, S.-F. Zhou and G. Zhan, Chem. Eng. J., 2020, 402, 126163 CrossRef CAS.
- R. Chong, G. Wang, Y. Du, Y. Jia, X. Wang, C. Li, Z. Chang and L. Zhang, Chem. Eng. J., 2019, 366, 523–530 CrossRef CAS.
- C. C. L. McCrory, S. Jung, J. C. Peters and T. F. Jaramillo, J. Am. Chem. Soc., 2013, 135, 16977–16987 CrossRef CAS PubMed.
- C. H. Liu, Y. Xu, H. Luo, W. C. Wang, Q. Liang and Z. D. Chen, Chem. Eng. J., 2019, 363, 23–32 CrossRef CAS.
- J. Liu, M. Dai, J. Wu, Y. Hu, Q. Zhang, J. Cui, Y. Wang, H. H. Tan and Y. Wu, Sci. Bull., 2018, 63, 194–202 CrossRef CAS PubMed.
- S. Farhoosh, B. Eftekharinia, M. Tayebi, B.-K. Lee and N. Naseri, Appl. Surf. Sci., 2021, 550, 149374 CrossRef CAS.
- J. Xiao, L. Fan, F. Zhao, Z. Huang, S.-F. Zhou and G. Zhan, J. Catal., 2020, 381, 139–149 CrossRef CAS.
- M. G. Ahmed, I. E. Kretschmer, T. A. Kandiel, A. Y. Ahmed, F. A. Rashwan and D. W. Bahnemann, ACS Appl. Mater. Interfaces, 2015, 7, 24053–24062 CrossRef CAS PubMed.
- L. Steier, I. Herraiz-Cardona, S. Gimenez, F. Fabregat-Santiago, J. Bisquert, S. D. Tilley and M. Grätzel, Adv. Funct. Mater., 2014, 24, 7681–7688 CrossRef CAS.
Footnote |
| † Electronic supplementary information (ESI) available: J–V curves of the monodoped photoanodes before and after HCl treatment with or without H2O2. ηinj, Ctrap, Rct,trap curves of the monodoped photoanodes. See DOI: https://doi.org/10.1039/d3ra01576a |
| This journal is © The Royal Society of Chemistry 2023 |

