 Open Access Article
Theoretical prediction on net boroxene as a promising Li/Na-ion batteries anode
Chunlai Huangab,
Junping Hu *ab and
Chuying Ouyangc
aNanchang Key Laboratory of Photoelectric Conversion and Energy Storage Materials, Nanchang Institute of Technology, Nanchang 330099, China
bKey Laboratory of Optoelectronic Materials and New Energy Technology, Nanchang Institute of Technology, Nanchang 330099, China
cDepartment of Physics, Laboratory of Computational Materials Physics, Jiangxi Normal University, Nanchang 330022, China
First published on 5th June 2023
Abstract
Novel two-dimensional (2D) electrode materials have become a new frontier for mining electrode materials for Li-ion batteries (LIBs) and Na-ion batteries (NIBs). Herein, based on first-principles calculations, we present a systematic study on the Li and Na storage behaviors in Calypso-predicted completely flat 2D boron oxide (l-B2O) with large mesh pores. We start our calculations from geometrical optimization, followed by a performance evaluation of Li/Na adsorption and migration processes. Finally, the specific capacity and average open-circuit voltage are evaluated. Our study reveals that l-B2O has good electrical conductivity before and after Li/Na adsorption and the Li/Na diffusion barrier height and average open-circuit voltage are both low, which is beneficial to the rate performance and full-cell operation voltage, respectively. Furthermore, it suffers a small lattice change (<1.7%), ensuring good cycling performance. In particular, we find that the Li and Na theoretical specific capacities of l-B2O can reach up to 1068.5 mA h g−1 and 712.3 mA h g−1, respectively, which are almost 2–3 times higher than graphite (372 mA h g−1). All the above outcomes indicate that 2D l-B2O is a promising anode material for LIBs and NIBs.
1. Introduction
New energy storage technologies can effectively avoid the intermittency of renewable energy power generation and help smooth out user demand to boost energy utilization efficiency,1–5 among which lithium-ion batteries are key components for mobile electrical devices, EVs, and large-scale energy storage stations.6–10 However, as the demand for energy storage continues to grow, the existing Li resources fall short in meeting the demand, leading to a significant increase in the cost of LIBs.11 Considering this, Na ion batteries are expected to achieve partial substitution among small and micro EVs and large energy storage stations in view of their comparatively lower prices and abundant Na resources.12,13Whether it concerns LIBs or NIBs, the most critical material is still the electrode material. Good electrode materials are conducive to achieving high specific capacity and high power, thus realizing fast and large charging mode.14 Electrode materials are divided into positive and negative electrode materials. At present, the research on positive electrode materials is relatively abundant, but the research on negative electrode materials is relatively small.15,16
With the discovery of graphene,17 more and more 2D materials have been successfully prepared. The emergence of these 2D materials has given more possibilities to optimize the electrode materials for secondary batteries due to their large specific surface area and high electronic conductivity, making it possible to store large amounts of metal ions for higher capacity.18 The diffusion rate of metal ions along the surface of 2D materials is generally fast, which facilitates the rate performance.19 More importantly, 2D electrode nanomaterials do not show large volume changes during battery charging and discharging, thus maintaining structural integrity during cycling.20 Therefore, in recent years, 2D materials have been intensively studied in the field of energy storage devices.21,22
For negative electrode materials, to obtain higher theoretical capacity, their own atomic weight should be relatively low, for example, among all 2D materials, boron-based 2D materials are predicted to have the highest theoretical capacity at present.23 Recently, we used Calypso,24 a very popular material structure prediction software, to obtain a new type of 2D material that is more stable in energy than its counterpart two-dimensional boron oxide of the same scale.25 It is worth noting that due to the electron-deficient nature of boron atoms, which makes B–B bonds unstable in borophene,26,27 and the experimental results that B–O bonds are more stable than B–B bonds under oxygen-rich conditions,28 the possibility of the experimentally successful preparation of 2D “BxOy” predicted by Calypso is increasing; therefore, there are more and more theoretical and experimental studies on 2D “BxOy” materials,29,30 including 2D B2O. To the best of our knowledge, our predicted 2D B2O here has not been studied regarding the direction of electrode materials for LIBs or NIBs.
Motivated by the discussions above, herein, using first-principles calculations, we systemically examine the Li and Na storage behaviors in completely flat 2D boron oxide (l-B2O) with large mesh pores. We start our calculations from geometrical optimization, followed by the performance evaluation of Li/Na adsorption and migration processes. Finally, specific capacity and average open-circuit voltage are evaluated. Our study reveals that l-B2O has good electrical conductivity before and after Li/Na adsorption, the Li/Na diffusion barrier height and average open-circuit voltage are both low, which is beneficial to the rate performance and full-cell operation voltage, respectively. Furthermore, it suffers a small lattice change (<1.7%), ensuring good cycling performance. In particular, we find that the Li and Na theoretical specific capacities of l-B2O can reach up to 1068.5 mA h g−1 and 712.3 mA h g−1, respectively, which are almost 2–3 times higher than graphite (372 mA h g−1). All the above outcomes indicate that 2D l-B2O is a promising anode material for LIBs and NIBs.
2. Computational methods
The structural predication of the l-B2O was obtained via crystal structure analysis performed by particle swarm optimization (CALYPSO).31–33 Just based on the given chemical composition, the CALYPSO code can efficiently search out the ground or metastable structures. All key parameters are chosen from the default values of Calypso software. For example, PopSize = 30 and Kgrid = 0.12 0.06. Our first-principles calculations are based on the density functional theory with the plane-wave pseudopotentials34,35 realized in the Vienna Ab initio Simulation Package (VASP).36,37 The exchange-correlation functional is modeled in the generalized gradient approximation (GGA) with the Perdew-Burke-Ernzerhof (PBE)38,39 realization. Boron 2s22p1, oxygen 2s22p6, lithium 2s1, and sodium 3s1 electrons are treated as valence electrons. A 520 eV cutoff energy is used for the plane wave expansion of the wave functions. The Brillouin zone is sampled with 3 × 3 × 1 and 5 × 5 × 1 mesh Monkhorst–Pack k-point mesh40 for the structural optimization and electronic structure calculations, respectively. The criteria of convergence for the energy and forces are 10−5 eV and 10−3 eV Å−1, respectively. Phonon spectra calculations were conducted with the Phonopy package.413. Results and discussion
3.1 Lattice structure
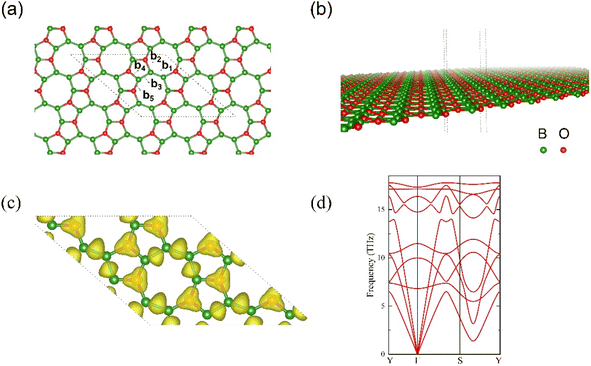
After total relaxation, the lattice structure for l-B2O is shown in Fig. 1(a) and (b). For the optimized 2 × 2 supercell, which contains 16 B atoms and 8 O atoms, the corresponding lattice constants are a = b = 10.822 Å, the rhombic cell angle is 138.638°, as shown in Fig. 1(a), and the individual bond lengths are 1.571 Å (b1), 1.569 Å (b2), 1.623 Å (b3), 1.477 Å (b4), and 1.704 Å (b5). As shown in Fig. 1(a), the atomic structure of l-B2O possesses completely planar net configuration, and its space group is Amm2 (no. 38). The electron localization function (ELF) is illustrated in Fig. 1(c), showing that each O atom is strongly bonded to three adjacent B atoms and between B and B atoms. The phonon spectrum of l-B2O shows no imaginary frequency modes, as plotted in Fig. 1(d); hence, this configuration is dynamically stable. Moreover, by comparing the total energy of the system with other B2O-type structures42,43 of the same chemical composition, we found that l-B2O is 0.12 eV per unit lower in total energy than their proposed structure. This implies that l-B2O is more stable energetically. This means that l-B2O is more energetically stable, and since the experimental synthesis is still in the exploratory stage, this is more conducive to the successful experimental preparation of l-B2O by chemical vapor deposition (CVD), hydrothermal synthesis, solvothermal method, mechanical stripping, and redox stripping.443.2 Li or Na adsorption
To initially clarify whether l-B2O can be used as an electrode material for Li/Na ion batteries or whether it is more suitable as a cathode or anode material, it is necessary to investigate the adsorption behavior of individual Li or Na atoms on the l-B2O monolayer. Depending on the atomic structure symmetry, three possible types of adsorption sites are regarded, i.e., hollow sites (above the center of B/O five-membered ring or eight-membered ring), top sites (above B or O atoms), and bridge sites (above the B–O bond center).The adsorption properties are given by the estimation of the adsorption energies, the definition is as follows.
| Ead = EB16O8 − EB16O8M − EM | (1) |
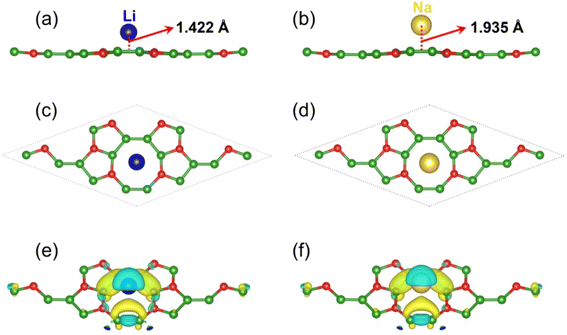
A negative Ead value implies that Li or Na can spontaneously adsorb on the l-B2O without forming a cluster; in contrast, its positive values suggest that Li or Na is more inclined to form clusters. By comparing the magnitude of the adsorption energy, we determined the most stable configuration for Li or Na adsorption, as shown in Fig. 2(c) and (d), in which the Li or Na atom are both located above the hollow site of the B–O–B ring. The Li adsorption energy are −0.17 eV, and the Na adsorption energy is −0.20 eV, implying that l-B2O has a great possibility to be utilized as the LIBs/NIBs anode. In addition, we performed Bader charge analysis calculations, which is tabulated in Table 1 and reveals that about 0.86e and 0.88e are shifted to the B16O8 monolayer after the adsorption of Li and Na, respectively. To better understand the interaction behavior between Li/Na and 2D l-B2O, as shown in Fig. 2(e) and (f), we drew the charge density difference curves for the two most stable adsorption conformations. It can be seen that the electrons in both adsorption configurations tend to cluster around the B–O–B ring, while their density decreases around the Li or Na atoms. Both results indicate a strong interaction between Li (Na) and B16O8 monolayers, which is favorable for the high capacity obtained.
| Average charge state | ||||
|---|---|---|---|---|
| B | O | Li | Na | |
| B16O8 | 2.211 | 7.577 | ||
| LiB16O8 | 2.259 | 7.590 | 0.136 | |
| Li8B16O8 | 2.584 | 7.628 | 0.204 | |
| NaB18O9 | 2.258 | 7.593 | 0.119 | |
| Na8B16O8 | 2.459 | 7.626 | 0.454 | |
Moreover, we execute the electronic structure calculations for B16O8 and its most stable Li/Na adsorption configurations of l-B2O, i.e., B16O8Li/B16O8Na, because it is important for its function as electrodes for LIBs or NIBs. The results are shown in Fig. 3. As we can see, for B16O8, there is an energy gap of 0.13 eV near the Fermi energy level, which still indicates that B16O8 has good electronic conductivity. Crucially, this energy gap disappears when Li or Na is adsorbed, which means that the electronic conductivity becomes better and that most of the electronic states near the Fermi energy level are contributed by the B atom.
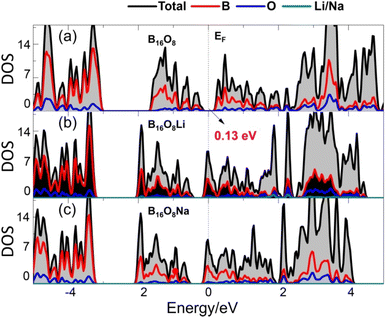 | ||
| Fig. 3 Density of states (DOS) for (a) B16O8 and its lithiated and sodiated phase, i.e., (b) B16O8Li and (c) B16O8Na. | ||
3.3 Li or Na diffusion
It is well-known that rate performance is another key parameter of Li- or Na-ion batteries. To evaluate it, we performed the calculation of the diffusion barrier, i.e., we determined the optimal path of diffusion and calculated its corresponding diffusion barrier using the climbing image nudged elastic band (CL-NEB) method.45 For l-B2O monolayer utilized as the Li-ion batteries electrode material, we consider the three pathways representing all the possible diffusion paths, as shown in Fig. 4(a). The initial and final states are both the most stable Li/Na adsorption configurations. The corresponding energy barriers for Li migration are plotted in Fig. 4(b), where the saddle points for each path are found. Similarly, for l-B2O monolayer utilized in Na-ion batteries, the energy barriers and migration pathways profiles are shown in Fig. 4(c), and the saddle points are also found for each path. Obviously, the Li diffusion barriers are higher than that of the Na diffusion barrier for each corresponding migration way. For both cases, the path 3 migration ways possess the lowest diffusion barrier, which is 0.38 eV for Li and 0.25 eV for Na.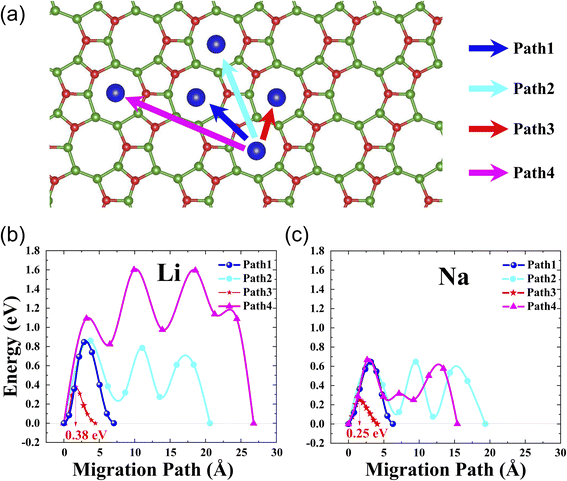 | ||
| Fig. 4 (a) The considered Li/Na migration pathways correspondingly; (b) the diffusion barrier profiles for Li on l-B2O; (c) the diffusion barrier profiles for Na on l-B2O. | ||
The above calculation results suggest fast Li or Na diffusion on l-B2O, which is expected to give good rate performance of l-B2O as an anode. To better explain the energy barriers, we relate the calculated Li or Na migration energy barriers with diffusion coefficients, expressed as follows.46–48
 | (2) |
| d (Å) | Ea (eV) | Diffusion coefficient (cm2 s−1) | ||||
|---|---|---|---|---|---|---|
| T = 250 K | T = 300 K | T = 350 K | ||||
| Li | Path 1 | 7.07 | 0.85 | 4.26 × 10⁻¹⁹ | 2.98 × 10⁻¹⁶ | 3.21 × 10⁻¹⁴ |
| Path 2 | 20.62 | 0.79 | 6.23 × 10⁻¹⁷ | 2.71 × 10⁻¹⁴ | 2.08 × 10⁻¹² | |
| Path 3 | 4.45 | 0.38 | 4.79 × 10⁻¹⁰ | 8.90 × 10⁻⁹ | 7.18 × 10⁻⁸ | |
| Path 4 | 26.79 | 1.60 | 3.81 × 10⁻³³ | 9.13 × 10⁻²⁸ | 6.35 × 10⁻²⁴ | |
| Na | Path 1 | 6.28 | 0.65 | 3.71 × 10⁻¹⁵ | 5.51 × 10⁻¹³ | 1.96 × 10⁻¹¹ |
| Path 2 | 0.65 | 0.39 | 4.86 × 10⁻¹² | 1.02 × 10⁻¹⁰ | 8.99 × 10⁻¹⁰ | |
| Path 3 | 4.07 | 0.25 | 1.48 × 10⁻⁷ | 1.03 × 10⁻⁶ | 4.10 × 10⁻⁶ | |
| Path 4 | 15.39 | 0.58 | 6.01 × 10⁻¹³ | 5.15 × 10⁻¹¹ | 1.24 × 10⁻⁹ | |
3.4 Average open-circuit voltage (OCV) and theoretical capacity
It is well known that the storage capacity and open-circuit voltage of lithium-ion or sodium-ion batteries are crucial indicators to measure their performance. To further examine these properties, based on the discussion in the last section, we now increase the concentration of the Li or Na adsorption on l-B2O monolayer. For estimating the maximum storage capacity, we continued to use a 2 × 2 supercell with an increasing number of Li or Na atoms sandwiched on either side of the host. We simulate here the half-cell reaction with M/M+ (M = Li, Na) as follows.| B16O8 + xM+ + xe− ↔ B16O8Mx | (3) |
The average OCV can be obtained by computing the total energies difference before and after M intercalation. To obtain more accurate total energies value, all the configurations are fully relaxed. In addition, usually the entropy and volume effects are negligible during the reaction. Hence, the average OCV for one intercalation reaction involving xM+ ions can be calculated from the corresponding total energies difference as follows.
| VOCV = (EB16O8 + xEM − EB16O8Mx)/x | (4) |
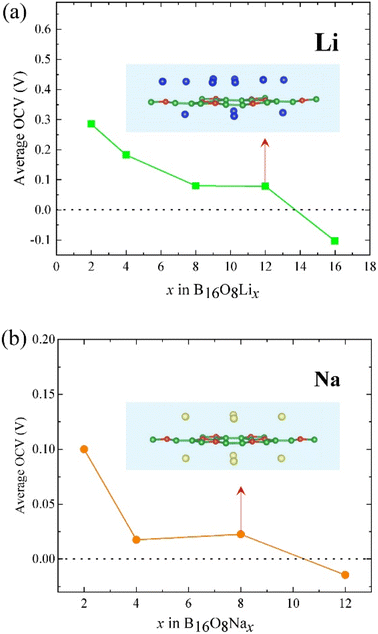
As mentioned before, according to the adsorption energies for Li or Na adsorption and eqn (1), l-B2O should be suitable to be utilized as an anode material for both LIBs and NIBs. As for LIBs or NIBs anode, the first considered position of adsorbed Li/Na atoms are at the top of the hollow sites (see Fig. 2) due to the least adsorption energy. In addition, the Li/Na layer could symmetrically adsorb on both the sides of the l-B2O monolayer. After the first layer adsorption, we add more Li/Na to the host layer. For Li adsorption, we find that when we initially put more Li atoms to the host layer with higher distance than the first Li layer; all the Li atoms relaxed to the same height, as shown in Fig. 5(a). Conversely, the Na atoms are different, and a different distribution of Na atomic layers can be clearly seen. Therefore, we calculated the relationship between different numbers of embedded Li or Na and the average OCV, as shown in Fig. 5. For the case of Li-embedded, the Li-embedded voltage is basically decreasing when the number of Li-embedded is 2, 4, 8, and 12, but with 16 Li-embedded, the Li-embedded voltage becomes −0.103 V, which means that B16O8 can accommodate up to 12 Li-embedded. For the case of embedded Na, when the number of embedded Na is 2, 4, or 8, the average OCV is also greater than 0 V; when embedded to 12, the average OCV becomes −0.003 V, indicating that the maximum number of embedded Na is 8.
Then, we can obtain the theoretical capacity (Ct) through the following equation.
| Ct = xF/3.6Ml-B2O | (5) |
4. Conclusion
In this work, we demonstrate flat 2D borophene oxide (l-B2O) can be a very promising anode material for both LIBs and NIBs using first-principles calculations. Our study reveals that l-B2O has good electrical conductivity before and after Li/Na adsorption, the Li/Na diffusion barrier height and average open-circuit voltage are both low, which is beneficial to the rate performance and full-cell operation voltage respectively. Furthermore, it suffers a small lattice change (<1.7%), ensuring good cycling performance. In particular, we find that the Li and Na theoretical specific capacities of l-B2O can reach up to 1068.5 mA h g−1 and 712.3 mA h g−1, respectively, which are almost 2–3 times higher than graphite (372 mA h g−1). Thus, we suggest that l-B2O is a promising anode material for both LIBs and NIBs.Conflicts of interest
There are no conflicts to declare.Acknowledgements
This work is supported by Natural Science Foundation of China (Grant No. 12264029, 12064014) and Scientific Research Fund of Jiangxi Provincial Education Department (GJJ211923).References
- K. M. Tan, T. S. Babu, V. K. Ramachandaramurthy, P. Kasinathan, S. G. Solanki and S. K. Raveendran, J. Energy Storage, 2021, 39, 102591 CrossRef.
- Z. Zhang, T. Ding, Q. Zhou, Y. Sun, M. Qu, Z. Zeng, Y. T. Ju, L. Li, K. Wang and F. Chi, Renewable Sustainable Energy Rev., 2021, 148, 111263 CrossRef.
- A. A. Kebede, T. Kalogiannis, J. Van Mierlo and M. Berecibar, Renewable Sustainable Energy Rev., 2022, 159, 112213 CrossRef CAS.
- X. Qi, J. Wang, G. Królczyk, P. Gardoni and Z. Li, J. Energy Storage, 2022, 50, 104682 CrossRef.
- M. Q. Li, R. Shan, A. Abdulla, J. Tian and S. Gao, J. Energy Storage, 2023, 59, 106560 CrossRef.
- L. Lu, X. Han, J. Li, J. Hua and M. Ouyang, J. Power Sources, 2013, 226, 272–288 CrossRef CAS.
- M. Li, J. Lu, Z. Chen and K. Amine, Adv. Mater., 2018, 30, 1800561 CrossRef PubMed.
- G. Zhao and J. Baker, Energy Strategy Rev., 2022, 40, 100819 CrossRef.
- T. Chen, Y. Jin, H. Lv, A. Yang, M. Liu, B. Chen, Y. Xie and Q. Chen, Trans. Tianjin Univ., 2020, 26, 208–217 CrossRef.
- J. Li, Z. Liang and S. Xu, Energy Rep., 2022, 8, 584–596 CrossRef.
- K. Du, E. H. Ang, X. Wu and Y. Liu, Energy Environ. Mater., 2022, 5, 1012–1036 CrossRef CAS.
- W. Zhang, F. Zhang, F. Ming and H. N. Alshareef, EnergyChem, 2019, 1, 100012 CrossRef.
- D. Pahari, P. Verma and S. Puravankara, J. Energy Storage, 2022, 56, 105961 CrossRef.
- S. W. Kim, D. H. Seo, X. Ma, G. Ceder and K. Kang, Adv. Energy Mater., 2012, 2, 710–721 CrossRef CAS.
- X. Li, X. Y. Wang and J. Sun, N. Carbon Mater., 2021, 36, 106–116 CrossRef CAS.
- T. Perveen, M. Siddiq, N. Shahzad, R. Ihsan, A. Ahmad and M. I. Shahzad, Renewable Sustainable Energy Rev., 2020, 119, 109549 CrossRef CAS.
- A. K. Geim, Science, 2009, 324, 1530–1534 CrossRef CAS PubMed.
- P. Ares and K. S. Novoselov, Nano Mater. Sci., 2022, 4, 3–9 CrossRef CAS.
- S. Wang, S. Zhao, X. Guo and G. Wang, Adv. Energy Mater., 2022, 12, 2100864 CrossRef CAS.
- M. S. Javed, A. Mateen, S. Ali, X. Zhang, I. Hussain, M. Imran, S. S. Shah and W. Han, Small, 2022, 18, 2201989 CrossRef CAS PubMed.
- E. Pomerantseva and Y. Gogotsi, Nat. Energy, 2017, 2, 1–6 Search PubMed.
- X. Chen, H. Yu, Y. Gao, L. Wang and G. Wang, EnergyChem, 2022, 2, 100071 CrossRef.
- Z. Q. Wang, T. Y. Lü, H. Q. Wang, Y. P. Feng and J. C. Zheng, Frontiers of Physics, 2019, 14, 1–20 Search PubMed.
- C. Zhong, W. Wu, J. He, G. Ding, Y. Liu, D. Li, S. A. Yang and G. Zhang, Nanoscale, 2019, 11, 2468–2475 RSC.
- J. Hu, C. Zhong, W. Wu, N. Liu, Y. Liu, S. A. Yang and C. Ouyang, J. Phys.: Condens. Matter, 2019, 32, 065001 CrossRef PubMed.
- L. H. Li, J. Cervenka, K. Watanabe, T. Taniguchi and Y. Chen, ACS Nano, 2014, 8, 1457–1462 CrossRef CAS PubMed.
- A. Lherbier, A. R. Botello-Méndez and J. C. Charlier, 2D Mater., 2016, 3, 045006 CrossRef.
- W. W. Luo, G. Liu, Z. H. Xu, Z. Y. Zhou, X. Wang, C. Y. Ouyang and S. Q. Liu, Comput. Mater. Sci., 2017, 140, 261–266 CrossRef CAS.
- S. Ullah, P. A. Denis and F. Sato, RSC Adv., 2019, 9, 37526–37536 RSC.
- S. Spitzer, A. Rastgoo-Lahrood, K. Macknapp, V. Ritter, S. Sotier, W. g. M. Hecklab and M. Lackinger, Chem. Commun., 2017, 53, 5147–5150 RSC.
- Y. Wang, J. Lv, L. Zhu and Y. Ma, Phys. Rev. B: Condens. Matter Mater. Phys., 2010, 82, 094116 CrossRef.
- Y. Wang, J. Lv, L. Zhu and Y. Ma, Comput. Phys. Commun., 2012, 183, 2063–2070 CrossRef CAS.
- Y. Wang, M. Miao, J. Lv, L. Zhu, K. Yin, H. Liu and Y. Ma, J. Chem. Phys., 2012, 137, 224108 CrossRef PubMed.
- G. Kresse and D. Joubert, Phys. Rev. B: Condens. Matter Mater. Phys., 1999, 59, 1758 CrossRef CAS.
- P. E. Blöchl, Phys. Rev. B: Condens. Matter Mater. Phys., 1994, 50, 17953 CrossRef PubMed.
- G. Kresse and J. Hafner, Phys. Rev. B: Condens. Matter Mater. Phys., 1993, 47, 558 CrossRef CAS PubMed.
- G. Kresse and J. Furthmüller, Phys. Rev. B: Condens. Matter Mater. Phys., 1996, 54, 11169 CrossRef CAS PubMed.
- J. P. Perdew, K. Burke and M. Ernzerhof, Phys. Rev. Lett., 1996, 77, 3865 CrossRef CAS PubMed.
- G. Kresse and D. Joubert, Phys. Rev. B: Condens. Matter Mater. Phys., 1999, 59, 1758 CrossRef CAS.
- H. J. Monkhorst and J. D. Pack, Phys. Rev. B: Solid State, 1976, 13, 5188 CrossRef.
- A. Togo, F. Oba and I. Tanaka, Phys. Rev. B: Condens. Matter Mater. Phys., 2008, 78, 134106 CrossRef.
- F. Gao, Y. H. Wei, J. G. Du and G. Jiang, Int. J. Hydrogen Energy, 2021, 46, 33486–33495 CrossRef CAS.
- Y. Luo, P. F. Liu, H. T. Li, Y. Tang, J. J. He, X. Y. Huang, B. T. Wang and L. J. Zhou, npj Comput. Mater., 2020, 6, 94 CrossRef.
- P. Leidinger, M. Panighel, V. Pérez Dieste, I. J. Villar-Garcia, P. Vezzoni, F. Haag, J. V. Barth, F. Allegretti, S. Günther and L. L. Patera, Nanoscale, 2023, 15, 1068–1075 RSC.
- G. Henkelman, B. P. Uberuaga and H. Jónsson, J. Chem. Phys., 2000, 113, 9901–9904 CrossRef CAS.
- H. Wang, M. Wu, X. Lei, Z. Tian, B. Xu, K. Huang and C. Ouyang, Nano Energy, 2018, 49, 67–76 CrossRef CAS.
- G. H. Vineyard, J. Phys. Chem. Solids, 1957, 3, 121–127 CrossRef CAS.
- R. Kutner, Phys. Lett. A, 1981, 81, 239–240 CrossRef.
- P. Yu, B. N. Popov, J. A. Ritter and R. E. White, J. Electrochem. Soc., 1999, 146, 8 CrossRef CAS.
- G. Yuan, T. Bo, X. Qi, P. F. Liu, Z. Huang and B. T. Wang, Appl. Surf. Sci., 2019, 480, 448–453 CrossRef CAS.
- X. Zhang, J. Hu, Y. Cheng, H. Y. Yang, Y. Yao and S. A. Yang, Nanoscale, 2016, 8, 15340–15347 RSC.
- V. Shukla, R. B. Araujo, N. K. Jena and R. Ahuja, Nano Energy, 2017, 41, 251–260 CrossRef CAS.
- Q. Sun, Y. Dai, Y. Ma, T. Jing, W. Wei and B. Huang, J. Phys. Chem. Lett., 2016, 7, 937–943 CrossRef CAS PubMed.
- Y. Xiao, Y. Ding, H. Cheng and Z. Lu, Comput. Mater. Sci., 2019, 163, 267–277 CrossRef CAS.
- Q. Meng, J. Ma, Y. Zhang, Z. Li, A. Hu, J. J. Kai and J. Fan, J. Mater. Chem. A, 2018, 6, 13652–13660 RSC.
- V. V. Kulish, O. I. Malyi, C. Persson and P. Wu, Phys. Chem. Chem. Phys., 2015, 17, 13921–13928 RSC.
- H. Huang, H. H. Wu, C. Chi, B. Huang and T. Y. Zhang, J. Mater. Chem. A, 2019, 7, 8897–8904 RSC.
| This journal is © The Royal Society of Chemistry 2023 |

