 Open Access Article
Binary ionic liquids hybrid electrolyte based supercapacitors with high energy & power density†
Zheng Bo a,
Xu Zhanga,
Zhesong Huanga,
Yuhui Huangbc,
Jianhua Yana,
Kefa Cena and
Huachao Yang
 *ac
*ac
aState Key Laboratory of Clean Energy Utilization, Institute for Thermal Power Engineering, College of Energy Engineering, Zhejiang University, Hangzhou 310027, Zhejiang, China. E-mail: huachao@zju.edu.cn
bCollege of Materials Science and Engineering, Zhejiang University, Hangzhou, 310027, Zhejiang, China
cResearch Institute of Zhejiang University-Taizhou, Taizhou, Zhejiang Province 318000, China
First published on 24th May 2023
Abstract
Supercapacitors with high energy and power densities have become highly desirable in practical applications. Ionic liquids (ILs) are considered as promising electrolytes of supercapacitors owing to their excellent electrochemical stability window (approx. 4–6 V) and good thermal stability. However, the high viscosity (up to 102 mPa s) and low electric conductivity (<10 mS cm−1) at room-temperature extremely reduce the ion diffusion dynamics in the energy storage process, resulting in the unsatisfactory power density and rate performance of supercapacitors. Herein we propose a novel binary ionic liquids (BILs) hybrid electrolyte composed of two kinds of ILs in an organic solvent. Along with the organic solvent with high dielectric constant and low viscosity, the addition of binary cations effectively improves the electric conductivity and reduces the viscosity of IL electrolytes. By mixing trimethyl propylammonium bis(trifluoromethanesulfonyl)imide ([TMPA][TFSI]) and N-butyl-N-methylpyrrolidinium bis(trifluoromethanesulfonyl)imide ([Pyr14][TFSI]) with an equal mole ratio in acetonitrile (1 M), the as-prepared BILs electrolyte shows superior electric conductivity (44.3 mS cm−1), low viscosity (0.692 mPa s), and a wide electrochemical stability window (4.82 V). The supercapacitors assembled with activated carbon electrodes (commercial mass loading) and this BILs electrolyte achieve a high working voltage of 3.1 V, leading to a maximum energy density of 28.3 W h kg−1 at 803.35 W kg−1 and a maximum power density of 32.16 kW kg−1 at 21.17 W h kg−1, which are obviously superior to those of commercial supercapacitors based on organic electrolytes (2.7 V).
1. Introduction
Supercapacitors are electrochemical energy storage devices based on the electrostatic double-layer effect, namely the reversible adsorption and desorption processes of ions at the electrode/electrolyte interface. These rapid-response processes enable an ultra-high power density (>10 kW kg−1) and ultra-long cycle life (>500![[thin space (1/6-em)]](https://www.rsc.org/images/entities/char_2009.gif) 000 cycles) for supercapacitors.1–3 Therefore, they have been widely used in various fields, including braking energy recovery of rail transit, backup power of wind turbine pitches, photovoltaic–battery hybrid energy storage systems, and emergency start for armored vehicles.4–7 Despite the ultra-high power density, a considerable energy density of supercapacitor is necessarily required for practical applications. Nowadays, the energy density of commercial supercapacitors is usually lower than 5 W h kg−1 (calculated by the mass of the total device), facing difficulties to meet the requirements of the above applications.8 Based on the mass of active materials, the energy density is usually lower than 20 W h kg−1.9–13 According to the equation of energy density (E = 0.5CV2), the energy density is proportional to the square of the operating voltage.14 Therefore, expanding the voltage window can significantly improve the energy density of supercapacitors. The electrolyte is a crucial factor in determining the voltage window of supercapacitors.15 Currently, organic electrolytes composed of quaternary ammonium salts and organic solvents are widely used in commercial supercapacitors, e.g., tetraethylammonium tetrafluoroborate ([TEA][BF4]) in acetonitrile (ACN). Even though a high operating voltage of 2.7 V can be achieved in supercapacitors assembled with the organic electrolyte, serious safety issues emerge at high temperature, such as easy combustion, explosion, and volatility.
000 cycles) for supercapacitors.1–3 Therefore, they have been widely used in various fields, including braking energy recovery of rail transit, backup power of wind turbine pitches, photovoltaic–battery hybrid energy storage systems, and emergency start for armored vehicles.4–7 Despite the ultra-high power density, a considerable energy density of supercapacitor is necessarily required for practical applications. Nowadays, the energy density of commercial supercapacitors is usually lower than 5 W h kg−1 (calculated by the mass of the total device), facing difficulties to meet the requirements of the above applications.8 Based on the mass of active materials, the energy density is usually lower than 20 W h kg−1.9–13 According to the equation of energy density (E = 0.5CV2), the energy density is proportional to the square of the operating voltage.14 Therefore, expanding the voltage window can significantly improve the energy density of supercapacitors. The electrolyte is a crucial factor in determining the voltage window of supercapacitors.15 Currently, organic electrolytes composed of quaternary ammonium salts and organic solvents are widely used in commercial supercapacitors, e.g., tetraethylammonium tetrafluoroborate ([TEA][BF4]) in acetonitrile (ACN). Even though a high operating voltage of 2.7 V can be achieved in supercapacitors assembled with the organic electrolyte, serious safety issues emerge at high temperature, such as easy combustion, explosion, and volatility.
Ionic liquids (ILs), also known as room-temperature molten salts, only consist of ions and appear as liquid at room temperature. In the past decades, ILs have been investigated as an alternative electrolyte to commercial organic electrolytes.16–22 Compared with commercial organic electrolytes, ILs offer better thermal stability and lower volatility, which provide excellent safety and reliability in case of electrolyte leakage.23 Additionally, their excellent electrochemical stability offers a larger operating voltage window (3–5 V), which can significantly improve the energy density of supercapacitors. However, due to the strong electrostatic forces, the anions can easily associate with cations to form ionic clusters restricting the free movement of ions.24,25 It results in high viscosity and low room-temperature electric conductivity of ILs, severely impeding further applications in supercapacitors.
Typically, two strategies have been proposed to address the challenges: one is to build a nano-conductive network with high porosity to enhance charge transport performance, and the other is to weaken the anion–cation interactions by introducing solvents.26,27 For instance, Kong et al. demonstrated that adding 0.2 wt% SWCNTs nanoparticles to ILs can effectively increase their electric conductivity by 35% (from 3.18 to 4.3 mS cm−1). However, the addition of SWCNTs results in a sharp increase of viscosity (from ∼80 to ∼100 mPa s) of the nanofluid electrolyte at 25 °C.28 Krause et al. reduced the viscosity of ILs from 62 to 5.6 mPa s and improved the conductivity from 2.6 to 10.3 mS cm−1 by adding propylene carbonate to N-butyl-N-methyl pyrrolidinium bis(trifluoro methane sulfonyl)imide ([Pyr14][TFSI]).29 Although ILs-solvent can indeed improve the electric conductivity and reduce the viscosity, the potential negative influence of solvent on electrochemical stability should be considered. Additionally, Jarosik et al. explored the effect of binary mixing and found that a binary mixture of [EMIM][OTf] (1-ethyl-3-methylimidazolium trifluoro methane sulfonate) and [EMIM][TFSI] (1-ethyl-3-methylimidazolium bis(trifluoro methane sulfonyl)imide) has a higher conductivity than each electrolyte alone, indicating a synergistic effect.30
Here, we propose a novel binary ionic liquids (BILs) hybrid electrolyte. After systematically investigating the effects of the solvents, the cation proportions, and the electrolyte concentrations on the properties of electrolytes (viscosity and electric conductivity), the optimum BILs electrolyte was proposed. Based on the combination of solvent and cationic synergistic effect, the BILs electrolyte achieves lower viscosity, higher electric conductivity, and excellent electrochemical stability, simultaneously. Electrochemical measurements are tested to evaluate the performance of the optimum electrolyte in supercapacitors. Supercapacitors assembled with the BILs electrolyte surpass those using the commercial organic electrolyte in terms of the operating voltage window, energy density, and power density.
2. Experimental section
2.1. Materials and characterizations
The commercial organic electrolyte (1 M [TEA][BF4]/ACN) was purchased from Shenzhen Capchem Co., Ltd. The ionic liquids of trimethyl propylammonium bis(trifluoro methane sulfonyl)imide ([TMPA][TFSI], 98%) and N-butyl-N-methyl pyrrolidinium bis(trifluoro methane sulfonyl)imide ([Pyr14][TFSI], 98%) were purchased from Shanghai Aladdin Reagent Co., Ltd. The organic solvents of acetone (≥99.5%, Sinopharm), methanol (≥99.5%, Sinopharm), acetonitrile (ACN, ≥99.5%, Sinopharm), γ-butyrolactone (GBL, ≥99%, Sigma-Aldrich), N-methyl formamide (NMF, 99%, Macklin), dimethyl sulfoxide (DMSO, ≥99.8%, Aladdin), propylene carbonate (PC, 99.7%, Aladdin), formamide (≥99.5%, Sinopharm), and N-methyl pyrrolidone (NMP, 98%, Macklin) were dried for 72 h by molecular sieves (3 Å). The activated carbon (YP-50F, Kuraray), Super-P (SP, XFNANO Co.), and poly vinylidene fluoride (PVDF, Macklin) were used directly.The conductivity was measured by a conductivity meter (DDSJ-308F, INESA, Shanghai) and the viscosity was measured by a falling-ball viscometer (Lovis 2000 M/ME, Anton-Paar, Australia). The ion interactions in electrolytes were investigated by Raman spectroscopy (LabRAM HR Evolution, Horiba, Japan) with an excitation wavelength of 785 nm at the frequency range from 50 to 4000 cm−1.
2.2. Preparation of electrolytes and electrodes
The electrolytes were prepared as below, and all operations were carried out under an argon atmosphere in the glove box (SUPER-1220/750, H2O ≤ 0.1 ppm, O2 ≤ 0.1 ppm). First, m1 g [Pyr14][TFSI] and m2 g [TMPA][TFSI] were mixed and then diluted by V L organic solvent. The m1 and m2 were calculated according to the equation below,| m1 = xCVM1 | (1) |
| m2 = (1 − x)CVM1 | (2) |
| No. | Solvent | Mole fraction x | Concentration (M) | Denomination |
|---|---|---|---|---|
| 1 | ACN | 0 | 1 | 1 M [TMPA][TFSI]/ACN |
| 2 | ACN | 0.25 | 1 | 1 M [TMPA]0.75[Pyr14]0.25[TFSI]/ACN |
| 3 | ACN | 0.5 | 0.25 | 0.25 M [TMPA]0.5[Pyr14]0.5[TFSI]/ACN |
| 4 | ACN | 0.5 | 0.5 | 0.5 M [TMPA]0.5[Pyr14]0.5[TFSI]/ACN |
| 5 | ACN | 0.5 | 1 | 1 M [TMPA]0.5[Pyr14]0.5[TFSI]/ACN |
| 6 | ACN | 0.5 | 1.5 | 1.5 M [TMPA]0.5[Pyr14]0.5[TFSI]/ACN |
| 7 | ACN | 0.5 | 2 | 2 M [TMPA]0.5[Pyr14]0.5[TFSI]/ACN |
| 8 | ACN | 0.75 | 1 | 1 M [TMPA]0.25[Pyr14]0.75[TFSI]/ACN |
| 9 | ACN | 1 | 1 | 1 M [Pyr14][TFSI]/ACN |
| 10 | Acetone | 0.5 | 1 | 1 M [TMPA]0.5[Pyr14]0.5[TFSI]/acetone |
| 11 | Methanol | 0.5 | 1 | 1 M [TMPA]0.5[Pyr14]0.5[TFSI]/methanol |
| 12 | GBL | 0.5 | 1 | 1 M [TMPA]0.5[Pyr14]0.5[TFSI]/GBL |
| 13 | NMF | 0.5 | 1 | 1 M [TMPA]0.5[Pyr14]0.5[TFSI]/NMF |
| 14 | DMSO | 0.5 | 1 | 1 M [TMPA]0.5[Pyr14]0.5[TFSI]/DMSO |
| 15 | PC | 0.5 | 1 | 1 M [TMPA]0.5[Pyr14]0.5[TFSI]/PC |
| 16 | Formamide | 0.5 | 1 | 1 M [TMPA]0.5[Pyr14]0.5[TFSI]/formamide |
The electrodes were prepared as below. The activated carbon, SP, and PVDF were mixed with a mass ratio of 85![[thin space (1/6-em)]](https://www.rsc.org/images/entities/char_2009.gif) :
:![[thin space (1/6-em)]](https://www.rsc.org/images/entities/char_2009.gif) 10
10![[thin space (1/6-em)]](https://www.rsc.org/images/entities/char_2009.gif) :
:![[thin space (1/6-em)]](https://www.rsc.org/images/entities/char_2009.gif) 5 in NMP, and the mixtures were ground for 35–40 min in an agate mortar to form a uniform slurry. The slurry was cast upon the current collector (carbon-coated aluminium foil) and then dried at 80 °C in the vacuum oven overnight. The electrode was punched into circular electrodes with a diameter of 11 mm and 8 mm on standby. The average mass loading of the activated carbon (excluding SP and PVDF) in the as-prepared electrodes was 7.0 ± 0.2 mg cm−2 (1σ). It is worthy to note that the mass loading was comparative to commercial level (10 mg cm−2), which was more reasonable and applicable for practical working condition. Guo et al. summarized the significance of enhancing mass loading to commercial level in industrialization of lab-scale devices.31
5 in NMP, and the mixtures were ground for 35–40 min in an agate mortar to form a uniform slurry. The slurry was cast upon the current collector (carbon-coated aluminium foil) and then dried at 80 °C in the vacuum oven overnight. The electrode was punched into circular electrodes with a diameter of 11 mm and 8 mm on standby. The average mass loading of the activated carbon (excluding SP and PVDF) in the as-prepared electrodes was 7.0 ± 0.2 mg cm−2 (1σ). It is worthy to note that the mass loading was comparative to commercial level (10 mg cm−2), which was more reasonable and applicable for practical working condition. Guo et al. summarized the significance of enhancing mass loading to commercial level in industrialization of lab-scale devices.31
2.3. Electrochemical measurements
The electrochemical measurements of linear sweep voltammetry (LSV), cyclic voltammetry (CV), galvanostatic charge–discharge (GCD), and electrochemical impedance spectroscopy (EIS) were tested by the electrochemical workstation (PGSTAT203N, Metrohm, Switzerland).EIS measurements were performed at the frequency from 0.1 to 105 Hz. And the Nyquist plots were fitted according to equivalent circuit by ZView software to analyze the impedance spectra.
LSV was conducted in a three-electrode system, and other electrochemical measurements were tested in a symmetrical two-electrode system. In the three-electrode system, a platinum disc with a diameter of 6 mm and an as-prepared activated carbon electrode with a diameter of 8 mm were used as working electrode and counter electrode, respectively, and a silver wire was used as pseudo-reference electrode. In the symmetrical two-electrode supercapacitor, two activated carbon electrodes with an equal diameter of 11 mm were assembled using the CR2032-type coin cell. And all devices were fabricated under an argon atmosphere in the glove box using glass fiber (GF/D, Waterman, Britain) as the separator.
In the LSV tests, the linear potential was applied to sweep the working electrode from the open circuit voltage towards anode or cathode limits with a scan rate of 5 mV s−1, until a strong current response occurred due to the electrolyte decomposition. According to the ref. 32, the cut-off value of current density was selected as 1 mA cm−2. The current density of working electrode (Icut-off, mA cm−2) is calculated by the equation:
 | (3) |
In the other CV tests, the scan rates ranged from 10 to 200 mV s−1. Eqn (4) and (5) were used to calculate the electrochemical performance of CV:
 | (4) |
 | (5) |
The working voltage was tested by CV at the scan rate of 20 mV s−1 and the operation voltage from 2.7 V to 3.5 V. To meet the requirements of stability and energy density simultaneously, the cut-off value of coulombic efficiency was selected as 95% according to the ref. 33. All the tests were performed through the same device in which the operation voltage was incrementally increased after each 30 cycles, and only the 30th cycle was considered for calculation.
The current density range of GCD tests was 0.5–10 A g−1, which was calculated by the total active mass loading on two electrodes. The frequency range of EIS was 0.1–100 kHz. The specific capacitance (Cg, F g−1) in GCD tests is calculated by the eqn (6). The energy density (E, W h kg−1) and power density (P, W kg−1) can be further calculated by eqn (7) and (8):
 | (6) |
 | (7) |
| P = 3600E/Δt | (8) |
3. Results and discussion
3.1. Optimum electrolyte
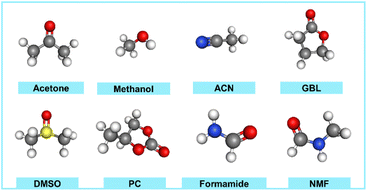
In order to obtain the best electrolyte formulation, the effect of the dielectric constant and viscosity of solvent additives on the conductivity and viscosity of mixed ILs electrolytes were investigated. Eight kinds of solvents with different dielectric constants were selected, including acetone, acetonitrile (ACN),methanol, γ-butyrolactone (GBL), N-methylformamide (NMF), dimethyl sulfoxide (DMSO), propylene carbonate (PC) and formamide. The molecular models of various solvents are shown in Fig. 1.The dielectric constant of the solvent reflects the polarity of solvent molecules. In general, solute molecules are usually more prone to dissolve in solvents with high dielectric constants. The solvation of solute molecules can destroy the structure of ion clusters and facilitate the dissociation of ion pairs. The viscosity of the solvent directly affects that of the electrolytes. The dielectric constants (20 °C) and viscosity (25 °C) of the eight solvents are shown in Table 2, and these solvents are arranged according to the viscosity.34 Among them, the viscosity of acetone is the lowest (0.316 mPa s), while formamide has the highest viscosity of 3.302 mPa s.
The effect of solvent type on the conductivity and viscosity of the hybrid electrolyte is shown in Fig. 2a. It is found that the electric conductivity and viscosity of the hybrid electrolyte are mainly influenced by the solvent viscosity. As the viscosity of the added organic solvent increases from 0.316 to 3.302 mPa s, the viscosity of the hybrid electrolytes increases from 0.771 to 4.806 mPa s, while the electric conductivity decreases from 33.1 to 8.84 mS cm−1. When the viscosity of added solvents is similar, the solvent with larger dielectric constant leads to a lower viscosity and higher electric conductivity of hybrid electrolytes. For example, the viscosity and electric conductivity of the electrolyte containing acetone are 0.771 mPa s and 33.1 mS cm−1, respectively. While the viscosity and electric conductivity of the hybrid electrolyte containing ACN are 0.692 mPa s and 44.3 mS cm−1, respectively. Compared with acetone, ACN exhibits larger dielectric constant with similar viscosity, offering superior ion dissociation and higher electric conductivity. Similarly, the hybrid electrolyte with NMF (the viscosity of 1.732 mPa s, the dielectric constant of 182.4) has lower viscosity of 2.734 mPa s and higher electric conductivity of 14.56 mS cm−1 than the one with GBL (viscosity of 1.7 mPa s, the dielectric constant of 39). Based on above results, the addition of ACN simultaneously achieves the lowest viscosity and the highest electric conductivity, indicating that ACN is the optimal organic solvent additive for the BILs electrolyte.
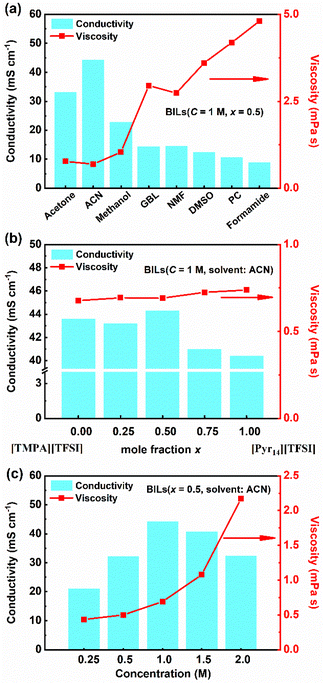 | ||
Fig. 2 Conductivity and viscosity of hybrid electrolytes at different (a) solvents, (b) cationic types and proportions, and (c) concentrations. In which, mole fraction x = n([Pyr14+])![[thin space (1/6-em)]](https://www.rsc.org/images/entities/char_2009.gif) : :![[thin space (1/6-em)]](https://www.rsc.org/images/entities/char_2009.gif) n([TMPA+]). n([TMPA+]). | ||
Fig. 2b displays the effects of the type and proportion of cations on the properties of the hybrid electrolyte containing ACN (1 M). In the hybrid electrolytes, the anion is [TFSI−] and the cations include [TMPA+] and [Pyr14+]. The mole fraction of [Pyr14+] varies from 0 to 1. As the content of [Pyr14+] increases from 0% to 100%, the viscosity of electrolytes increases from 0.677 to 0.738 mPa s. Moreover, the electric conductivity exhibits a general trend of an initial rise up to 44.3 mS cm−1 when the mole fraction of [Pyr14+] is 0.5, followed by a decline to 40.4 mS cm−1 when the mole fraction of [Pyr14+] is 1.
Fig. 2c depicts the viscosity and electric conductivity of the hybrid electrolyte containing ACN at different ILs concentrations when the mole fraction of [Pyr14+] is fixed at 0.5. With the increase of concentration of electrolytes from 0.25 to 2 M, the viscosity increases from 0.43 to 2.17 mPa s. Besides, the electric conductivity firstly increases from 21.1 to 44.3 mS cm−1 at 1 M, then decreases to 32.4 mS cm−1 at 2 M. When the concentration of the hybrid electrolyte is lower than 1 M, the content of anions and cations in the electrolyte increases as the concentration increases, which helps to enhance the electric conductivity. However, a further increase in electrolyte concentration leads to the formation of ion clusters, which seriously hinders ion transport and causes lower electric conductivity.25,35
3.2. Raman spectra
Raman spectroscopy was widely used to study ion interactions in ionic liquids.36 Fig. 3 shows the Raman spectra of [TMPA][TFSI], [Pyr14][TFSI], 1 M [TMPA][TFSI]/ACN, 1 M [Pyr14][TFSI]/ACN and 1 M [TMPA]0.5[Pyr14]0.5[TFSI]/ACN at the frequency range of 50–4000 cm−1.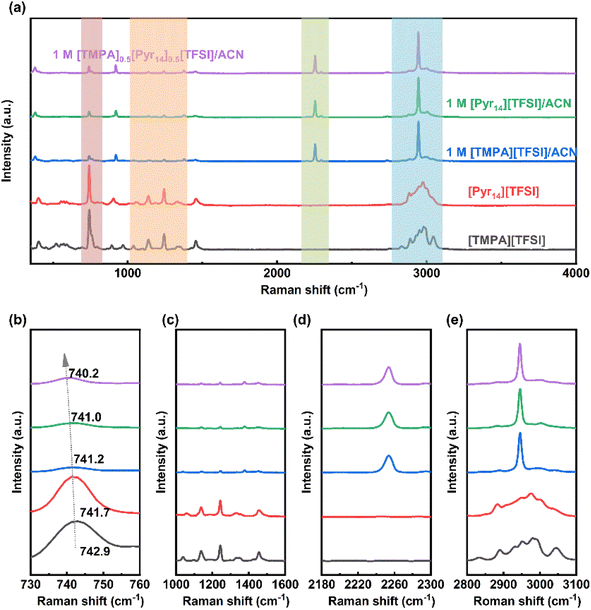 | ||
| Fig. 3 Raman spectra of hybrid electrolytes in different frequency ranges: (a) 50–4000 cm−1, (b) 730–760 cm−1, (c) 1000–1600 cm−1, (d) 2180–2300 cm−1, and (e) 2800–3100 cm−1. | ||
The intense peak at 740–750 cm−1 can be assigned to the S–N–S bending vibration (Fig. 3b), and the peak at 1230–1260 cm−1 represents the –CF3 symmetric stretching vibration of [TFSI−] (Fig. 3c).37,38 It can be clearly observed from Fig. 3b and c that the intensity of characteristic peaks of [TFSI−] weakens significantly due to the decrease of the anion concentration after the addition of ACN. The bending vibration (S–N–S) in pure [TMPA][TFSI] (742.9 cm−1) and [Pyr14][TFSI] (741.7 cm−1) and undergoes red shifts to 741.0 and 741.2 cm−1 upon the addition of ACN, respectively, indicating that ACN can effectively destroy ion clusters. After 1 M [TMPA][TFSI]/ACN and 1 M [Pyr14][TFSI]/ACN are mixed by equal volume, the red shift of bending vibration (S–N–S) further reaches 740.2 cm−1, indicating that the asymmetry of two cations contributes to further weakening the cation–anion interaction.
As shown in Fig. 3d, the stretching vibration band (C![[triple bond, length as m-dash]](https://www.rsc.org/images/entities/char_e002.gif) N) of ACN is between 2250 and 2260 cm−1, which cannot be detected in [TMPA][TFSI] and [Pyr14][TFSI]. Fig. 3e shows that the characteristic peaks of –CH3 and –CH2– groups on the cationic branch become narrow peaks with higher intensity after adding ACN, which might be related to the ion dissociation.39–42 The results of Raman spectroscopy are in line with the viscosity and conductivity variations.
N) of ACN is between 2250 and 2260 cm−1, which cannot be detected in [TMPA][TFSI] and [Pyr14][TFSI]. Fig. 3e shows that the characteristic peaks of –CH3 and –CH2– groups on the cationic branch become narrow peaks with higher intensity after adding ACN, which might be related to the ion dissociation.39–42 The results of Raman spectroscopy are in line with the viscosity and conductivity variations.
3.3. Electrochemical performance
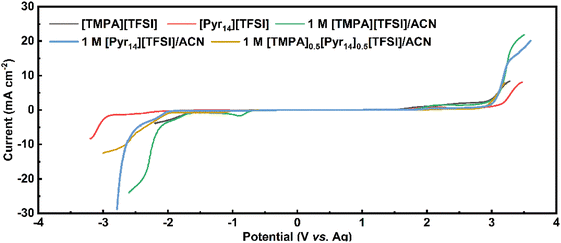
Table 3 shows the electric conductivity, viscosity and ESW of five different electrolytes at 25 °C. With the addition of ACN, the ESW of [TMPA][TFSI] decreases from 3.66 V to 2.80 V, and that of [Pyr14][TFSI] decreases from 5.40 V to 4.94 V.
| Electrolytes | Conductivity (mS cm−1) | Viscosity (mPa s) | Anode limit (V) | Cathode limit (V) | ESW (V) |
|---|---|---|---|---|---|
| [TMPA][TFSI] | 3.63 | 81.438 | 1.96 | −1.70 | 3.66 |
| [Pyr14][TFSI] | 2.01 | 82.974 | 2.98 | −2.42 | 5.40 |
| 1 M [TMPA][TFSI]/ACN | 43.6 | 0.677 | 2.00 | −0.80 | 2.80 |
| 1 M [Pyr14][TFSI]/ACN | 40.4 | 0.738 | 2.88 | −2.06 | 4.94 |
| 1 M [TMPA]0.5[Pyr14]0.5[TFSI]/ACN | 44.3 | 0.692 | 2.89 | −1.93 | 4.82 |
As shown in Table 3, the anodic limits of 1 M [TMPA][TFSI]/ACN and 1 M [Pyr14][TFSI]/ACN are 2.00 V and 2.88 V, respectively. Comparatively, the equal-volume mix of the above two electrolytes causes an anodic limit up to 2.89 V. This anodic limit is significantly higher than that of 1 M [TMPA][TFSI]/ACN and comparable to 1 M [Pyr14][TFSI]/ACN. As a result, 1 M [TMPA]0.5[Pyr14]0.5[TFSI]/ACN is the optimal BILs electrolyte, which shows the best combination of highest electric conductivity (44.3 mS cm−1), low viscosity (0.692 mPa s) and large ESW (4.82 V).
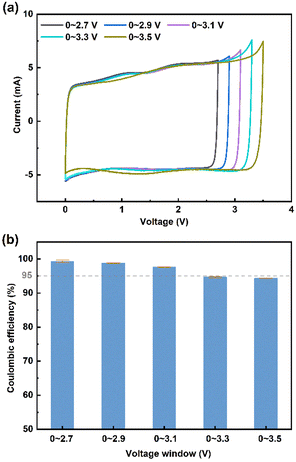 | ||
| Fig. 5 (a) CV curves and (b) coulombic efficiency of 1 M [TMPA]0.5[Pyr14]0.5[TFSI]/ACN at different cut-off voltages. | ||
Besides, Baptista et al. proposed a novel method of determining the available operating voltage theoretically.44 This method is more quantitative, and can provide the value of maximum working voltage as a function of acceptable parasitic current. Based on this method, the theoretical value of maximum operating voltage calculated by Tafel plots is 3.1 V (the calculation process is shown in Fig. S1, ESI†), which is consistent with the result of CV tests.
It is noteworthy that the 1 M [Pyr14][TFSI]/ACN also shows a large ESW of 4.94 V. Thus, the CV measurements at 20 mV s−1 were performed to test the working voltage of 1 M [Pyr14][TFSI]/ACN (Fig. S2, ESI†). As shown in Fig. S2,† when the applied voltage is 3.1 V, the coulombic efficiency decreases below 95%, indicating that the acceptable voltage window of 1 M [Pyr14][TFSI]/ACN is lower than 3.1 V. Considering the lower working voltage, 1 M [Pyr14][TFSI]/ACN is excluded from the following tests of electrochemical performance.
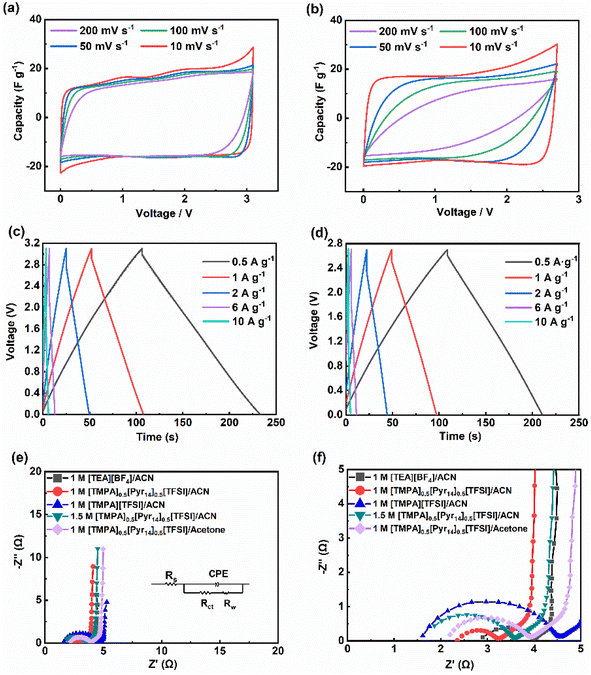
Fig. 6c and d depict the GCD curves of supercapacitors using 1 M [TMPA]0.5[Pyr14]0.5[TFSI]/ACN and 1 M [TEA][BF4]/ACN. These curves exhibit an isosceles symmetric triangle at different current densities, showing the typical capacitive behaviour. At the current density of 0.5 A g−1, the capacitance of the supercapacitor using 1 M [TEA][BF4]/ACN and the BILs electrolyte are 20 F g−1 and 21 F g−1, respectively. And the above two devices show similar IR drop (0.09 V for 1 M [TEA][BF4]/ACN and 0.08 V for the BILs electrolyte). Fig. 6e presents the Nyquist plots with the equivalent circuit (inset), and the magnification of the high-frequency region in Nyquist spectra is displayed in Fig. 6f. The Nyquist curves consist of three parts (high/middle/low frequency region), which corresponds to three kinds of resistances.45 In high frequency region, the intercept of the Nyquist curve at the Z′ axis refers to the equivalent series resistance (Rs), which contains resistances of the electrode, the electrolyte, and the contact interface. In middle frequency region, the diameter of the semicircle near the Z′ axis indicates the interfacial charge transfer resistance (Rct), which occurs at the interface between the electrolyte and electrode. And in low frequency region, the ∼45°line is corresponding to the Warburg impedance (Rw), which is related to the ion diffusion.
As shown in the Fig. 6e and f, all electrolytes exhibit an almost vertical slope in the low-frequency range, demonstrating a great capacitive behaviour.46 And the curve of 1 M [TMPA]0.5[Pyr14]0.5[TFSI]/ACN exhibits a much smaller Rct than those of the rest electrolytes. To further analyse the impedance quantitatively, the Nyquist plots are fitted according to the equivalent circuit by ZView. As summarized in Table 4, three replicate experiments were conducted to calculate the average values of fitting data. Notably, all data points are reported with a corresponding confidence interval of 1σ.
| Electrolytes | Rs (Ω) | Rct (Ω) | Rw (Ω) |
|---|---|---|---|
| 1 M [TEA][BF4]/ACN | 2.93 ± 0.11 | 1.03 ± 0.15 | 1.19 ± 0.11 |
| 1 M [TMPA][TFSI]/ACN | 1.65 ± 0.01 | 2.83 ± 0.01 | 1.55 ± 0.09 |
| 1.5 M [TMPA]0.5[Pyr14]0.5[TFSI]/ACN | 1.74 ± 0.01 | 1.76 ± 0.01 | 2.20 ± 0.03 |
| 1 M [TMPA]0.5[Pyr14]0.5[TFSI]/ACN | 2.01 ± 0.01 | 0.72 ± 0.01 | 1.71 ± 0.01 |
| 1 M [TMPA]0.5[Pyr14]0.5[TFSI]/acetone | 2.21 ± 0.01 | 1.61 ± 0.01 | 2.61 ± 0.02 |
The first four electrolytes displayed in Table 4 are composed of the same solvent (ACN) with different solutes. Among these four electrolytes, the value of Rct for the 1 M [TMPA]0.5[Pyr14]0.5[TFSI]/ACN is 0.72 ± 0.01 Ω (1σ), almost half of the value for 1 M [TEA][BF4]/ACN, demonstrating the lowest interface resistance between electrode and electrolyte. The last two electrolytes in Table 4 are composed of the same solute with different solvents. Comparing the three resistances of these two electrolytes, it can be found that 1 M [TMPA]0.5[Pyr14]0.5[TFSI]/ACN exhibits excellent comprehensive performance in impedance, which is consistent with the results shown in Fig. 2a. Furthermore, the greater ion-diffusion properties of 1 M [TMPA]0.5[Pyr14]0.5[TFSI]/ACN is confirmed by the comparatively less Warburg resistance Rw among all the electrolytes displayed.
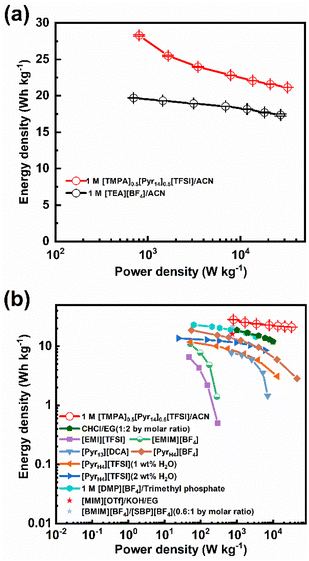
Fig. 7b compares the energy and power densities of the activated carbon devices containing optimal BILs electrolyte (1 M [TMPA]0.5[Pyr14]0.5[TFSI]/ACN) and other ILs electrolytes.11,12,17,32,47–50 As shown in Fig. 7b, devices containing pure ILs ([EMI][TFSI] or [EMIM][BF4]) display unsatisfied performance (the energy density is lower than 10 W h kg−1 and the power density is below 300 W kg−1).47 Comparatively, those devices containing ILs with organic solvents show better electrochemical performance. For example, the supercapacitor, which is assembled with 1.0 M [DMP][BF4]/trimethyl phosphate, achieves the maximum energy and power density of 23.23 W h kg−1 and 3.33 kW kg−1, respectively.50 Comparing to devices using 1.0 M [DMP][BF4]/trimethyl phosphate, those using mixed ILs electrolyte ([BMIM][BF4]![[thin space (1/6-em)]](https://www.rsc.org/images/entities/char_2009.gif) :
:![[thin space (1/6-em)]](https://www.rsc.org/images/entities/char_2009.gif) [SBP][BF4] = 0.6
[SBP][BF4] = 0.6![[thin space (1/6-em)]](https://www.rsc.org/images/entities/char_2009.gif) :
:![[thin space (1/6-em)]](https://www.rsc.org/images/entities/char_2009.gif) 1 by molar ratio) achieve a similar maximum energy density of 21.96 W h kg−1 at a higher power density (782.73 W kg−1).48 Among all the ILs electrolytes listed in Fig. 7b, the optimal BILs electrolyte (1 M [TMPA]0.5[Pyr14]0.5[TFSI]/ACN) displays the best performance (the highest energy and power density are achieved, simultaneously). Therefore, the BILs electrolyte (1 M [TMPA]0.5[Pyr14]0.5[TFSI]/ACN) is a promising electrolyte for supercapacitors with both outstanding energy storage and power performance.
1 by molar ratio) achieve a similar maximum energy density of 21.96 W h kg−1 at a higher power density (782.73 W kg−1).48 Among all the ILs electrolytes listed in Fig. 7b, the optimal BILs electrolyte (1 M [TMPA]0.5[Pyr14]0.5[TFSI]/ACN) displays the best performance (the highest energy and power density are achieved, simultaneously). Therefore, the BILs electrolyte (1 M [TMPA]0.5[Pyr14]0.5[TFSI]/ACN) is a promising electrolyte for supercapacitors with both outstanding energy storage and power performance.
4. Conclusions
In summary, the effects of dielectric constant and viscosity of solvents, type and proportion of cations, and electrolyte concentration on the properties of BILs electrolyte were revealed. Firstly, the solvent viscosity is the main factor affecting the viscosity and electric conductivity of BILs electrolyte. High dielectric constant contributes to enhancing the conductivity of electrolytes as the solvent viscosity is similar. Secondly, with the increase of the electrolyte concentration, the electric conductivity of the BILs electrolyte initially increases and then decreases, and reaches maximum value at the concentration of 1 M. Thirdly, the optimum proportion of cations is 1![[thin space (1/6-em)]](https://www.rsc.org/images/entities/char_2009.gif) :
:![[thin space (1/6-em)]](https://www.rsc.org/images/entities/char_2009.gif) 1 due to the highest electric conductivity for 1 M [TMPA]0.5[Pyr14]0.5[TFSI]/ACN, which is superior to both 1 M [TMPA][TFSI]/ACN and 1 M [Pyr14][TFSI]/ACN.
1 due to the highest electric conductivity for 1 M [TMPA]0.5[Pyr14]0.5[TFSI]/ACN, which is superior to both 1 M [TMPA][TFSI]/ACN and 1 M [Pyr14][TFSI]/ACN.
We propose a novel BILs electrolyte, which is convenient to prepare by introducing organic solvent and another cation to pure ILs. It is verified that the additional cations and organic solvent allow higher electric conductivity and lower viscosity. Among the BILs electrolyte mentioned above, 1 M [TMPA]0.5[Pyr14]0.5[TFSI]/ACN exhibits the best properties with high electric conductivity (44.3 mS cm−1), low viscosity (0.692 mPa s) and a large ESW up to 4.82 V. The activated carbon supercapacitors assembled with this BILs electrolyte works at 3.1 V, achieving excellent energy and power densities of 28.30 W h kg−1 and 32.16 kW kg−1, respectively. Compared with the commercial organic electrolyte and other electrolytes currently reported, 1 M [TMPA]0.5[Pyr14]0.5[TFSI]/ACN shows a great potential as an alternative electrolyte for high-performance supercapacitors. These results demonstrate that strategies based on adjusting ion components and adding organic solvents can be effective and feasible for improving the electrochemical properties of room-temperature ILs.
Conflicts of interest
There are no conflicts to declare.Acknowledgements
This work was supported by the Zhejiang Provincial Natural Science Foundation of China (No. LY23E060004).References
- M. Salanne, B. Rotenberg, K. Naoi, K. Kaneko, P. L. Taberna, C. P. Grey, B. Dunn and P. Simon, Nat. Energy, 2016, 1, 16070 CrossRef CAS.
- Z. Bo, Z. S. Huang, C. X. Xu, Y. C. Chen, E. Wu, J. H. Yan, K. Cen, H. C. Yang and K. Ostrikov, Energy Storage Mater., 2022, 50, 395–406 CrossRef.
- H. C. Yang, J. Y. Yang, C. W. Li, Z. S. Huang, A. Bendavid, J. H. Yan, K. F. Cen, Z. J. Han and Z. Bo, J. Power Sources, 2022, 541, 231684 CrossRef CAS.
- P. Simon and Y. Gogotsi, Acc. Chem. Res., 2013, 46, 1094–1103 CrossRef CAS PubMed.
- F. Beguin, V. Presser, A. Balducci and E. Frackowiak, Adv. Mater., 2014, 26, 2219–2251 CrossRef CAS PubMed.
- A. Borenstein, O. Hanna, R. Attias, S. Luski, T. Brousse and D. Aurbach, J. Mater. Chem. A, 2017, 5, 12653–12672 RSC.
- C. Schutter, S. Pohlmann and A. Balducci, Adv. Energy Mater., 2019, 9, 1900334 CrossRef.
- Y. M. Volfkovich, Russ. J. Electrochem., 2021, 57, 311–347 CrossRef CAS.
- J. Y. Hwang, M. P. Li, M. F. El-Kady and R. B. Kaner, Adv. Funct. Mater., 2017, 27, 1605745 CrossRef.
- S. Ahmed, A. Ahmed and M. Rafat, Surf. Coat. Technol., 2018, 349, 242–250 CrossRef CAS.
- M. Zhong, Q. F. Tang, Y. W. Zhu, X. Y. Chen and Z. J. Zhang, J. Power Sources, 2020, 452, 227847 CrossRef CAS.
- L. Dick, T. Stettner, Y. X. Liu, S. Q. Liu, B. Kirchner and A. Balducci, Energy Storage Mater., 2022, 53, 744–753 CrossRef.
- F. Markoulidis, J. Bates, C. Lekakou, R. Slade and G. M. Laudone, Carbon, 2020, 164, 422–434 CrossRef CAS.
- M. V. Fedorov and A. A. Kornyshev, Electrochim. Acta, 2008, 53, 6835–6840 CrossRef CAS.
- E. Zhang, N. Fulik, S. Paasch, L. Borchardt, S. Kaskel and E. Brunner, Energy Storage Mater., 2019, 19, 432–438 CrossRef.
- M. C. G. Santos, G. G. Silva, R. Santamaria, P. F. R. Ortega and R. L. Lavall, J. Phys. Chem. C, 2019, 123, 8541–8549 CrossRef CAS.
- T. Stettner, S. Gehrke, P. Ray, B. Kirchner and A. Balducci, ChemSusChem, 2019, 12, 3827–3836 CrossRef CAS PubMed.
- H. V. Nguyen, A. Bin Faheem, K. Kwak and K. K. Lee, J. Power Sources, 2020, 463, 228134 CrossRef CAS.
- L. Miao, Z. Y. Song, D. Z. Zhu, L. C. Li, L. H. Gan and M. X. Liu, Energy Fuels, 2021, 35, 8443–8455 CrossRef CAS.
- D. S. Silvester, R. Jamil, S. Doblinger, Y. X. Zhang, R. Atkin and H. Li, J. Phys. Chem. C, 2021, 125, 13707–13720 CrossRef CAS.
- T. Stettner and A. Balducci, Energy Storage Mater., 2021, 40, 402–414 CrossRef.
- M. Chen, J. D. Wu, T. Ye, J. Y. Ye, C. Zhao, S. Bi, J. W. Yan, B. W. Mao and G. Feng, Nat. Commun., 2020, 11, 5809 CrossRef CAS PubMed.
- G. B. Appetecchi, S. Scaccia, C. Tizzani, F. Alessandrini and S. Passerini, J. Electrochem. Soc., 2006, 153, A1685–A1691 CrossRef CAS.
- A. Knorr and R. Ludwig, Sci. Rep., 2015, 5, 17505 CrossRef PubMed.
- O. Nordness and J. F. Brennecke, Chem. Rev., 2020, 120, 12873–12902 CrossRef CAS PubMed.
- A. Brandt, S. Pohlmann, A. Varzi, A. Balducci and S. Passerini, MRS Bull., 2013, 38, 554–559 CrossRef CAS.
- W. Y. Tsai, R. Y. Lin, S. Murali, L. L. Zhang, J. K. McDonough, R. S. Ruoff, P. L. Taberna, Y. Gogotsi and P. Simon, Nano Energy, 2013, 2, 403–411 CrossRef CAS.
- C. Kong, W. Qian, C. Zheng and W. Fei, J. Mater. Chem. A, 2015, 3, 15858–15862 RSC.
- A. Krause and A. Balducci, Electrochem. Commun., 2011, 13, 814–817 CrossRef CAS.
- A. Jarosik, S. R. Krajewski, A. Lewandowski and P. Radzimski, J. Mol. Liq., 2006, 123, 43–50 CrossRef CAS.
- W. Guo, C. Yu, S. F. Li and J. S. Qiu, Energy Environ. Sci., 2021, 14, 576–601 RSC.
- C. Wolff, S. Jeong, E. Paillard, A. Balducci and S. Passerini, J. Power Sources, 2015, 293, 65–70 CrossRef CAS.
- X. D. Bu, L. J. Su, Q. Y. Dou, S. L. Lei and X. B. Yan, J. Mater. Chem. A, 2019, 7, 7541–7547 RSC.
- N. L. Cheng, Solvent Handbook, Chemical Industry Press, Beijing, 2022 Search PubMed.
- T. Niemann, D. Zaitsau, A. Strate, A. Villinger and R. Ludwig, Sci. Rep., 2018, 8, 14753 CrossRef PubMed.
- L. Q. Zhang and H. R. Li, Acta Phys.-Chim. Sin., 2010, 26, 2877–2889 CAS.
- S. Saito, H. Watanabe, K. Ueno, T. Mandai, S. Seki, S. Tsuzuki, Y. Kameda, K. Dokko, M. Watanabe and Y. Umebayashi, J. Phys. Chem. B, 2016, 120, 3378–3387 CrossRef CAS PubMed.
- Q. Y. Dou, S. L. Lei, D. W. Wang, Q. N. Zhang, D. W. Xiao, H. W. Guo, A. P. Wang, H. Yang, Y. L. Li, S. Q. Shi and X. B. Yan, Energy Environ. Sci., 2018, 11, 3212–3219 RSC.
- T. Carstens, A. Lahiri, N. Borisenko and F. Endres, J. Phys. Chem. C, 2016, 120, 14736–14741 CrossRef CAS.
- J. Krummacher, L. H. Hess and A. Balducci, ChemSusChem, 2017, 10, 4178–4189 CrossRef CAS PubMed.
- T. Fujimori, K. Fujii, R. Kanzaki, K. Chiba, H. Yamamoto, Y. Umebayashi and S. I. Ishiguro, J. Mol. Liq., 2007, 131, 216–224 CrossRef.
- T. Endo, S. Hoshino, Y. Shimizu, K. Fujii and K. Nishikawa, J. Phys. Chem. B, 2016, 120, 10336–10349 CrossRef CAS PubMed.
- V. H. Paschoal, L. F. O. Faria and M. C. C. Ribeiro, Chem. Rev., 2017, 117, 7053–7112 CrossRef CAS PubMed.
- J. M. Baptista, G. Gaspar, K. G. U. Wijayantha and K. Lobato, J. Energy Storage, 2022, 52, 104927 CrossRef.
- J. Kong, H. C. Yang, X. Z. Guo, S. L. Yang, Z. S. Huang, X. C. Lu, Z. Bo, J. H. Yan, K. F. Cen and K. K. Ostrikov, ACS Energy Lett., 2020, 5, 2266–2274 CrossRef CAS.
- X. R. Shuai, Z. Bo, J. Kong, J. H. Yan and K. F. Cen, RSC Adv., 2017, 7, 2667–2675 RSC.
- P. F. R. Ortega, G. A. dos Santos, J. P. C. Trigueiro, G. G. Silva, N. Quintanal, C. Blanco, R. L. Lavall and R. Santamaria, J. Phys. Chem. C, 2020, 124, 15818–15830 CrossRef CAS.
- Y. F. Zhang, X. Y. Zhang, X. S. Lang and Q. G. Zhang, Ionics, 2021, 27, 4003–4011 CrossRef CAS.
- Q. Y. Guo, B. L. He, J. Tan and Q. W. Tang, Electrochim. Acta, 2022, 434, 141323 CrossRef CAS.
- H. V. T. Nguyen, J. Kim and K. K. Lee, J. Mater. Chem. A, 2021, 9, 20725–20736 RSC.
Footnote |
| † Electronic supplementary information (ESI) available. See DOI: https://doi.org/10.1039/d3ra01634j |
| This journal is © The Royal Society of Chemistry 2023 |

