 Open Access Article
Creative Commons Attribution 3.0 Unported Licence
Microstructure, ion adsorption and magnetic behavior of mesoporous γ-Fe2O3 ferrite nanoparticles
Farzad Nasirpouri *a,
Sohiela Fallaha,
Ghader Ahmadpoura,
Elnaz Moslehifardc,
Aleksei Yu. Samardakb,
Vadim Yu. Samardakb,
Alexey V. Ognevbd and
Alexander S. Samardak
 bd
bd
aFaculty of Materials Engineering, Sahand University of Technology, Tabriz, Iran. E-mail: nasirpouri@sut.ac.ir; f_nasirpouri@yahoo.com
bInstitute of High Technologies and Advanced Materials, Far Eastern Federal University, 10 Ajax bay, Russky Island, Vladivostok 690922, Russia
cFaculty of Dentistry, Tabriz University of Medical Sciences, Tabriz, Iran
dSakhalin State University, Yuzhno-Sakhalinsk 693000, Russia
First published on 23rd August 2023
Abstract
Magnetic nanoparticles with capacity for surface functionalisation have potential applications in water purification and biomedicine. Here, a simple co-precipitation technique was used to synthesize mesoporous ferrite nanoparticles in the presence of cetyltrimethylammonium bromide (CTAB) micellular surfactant. The as-synthesized ferrite nanoparticles were calcined at 250 °C for 5, 10, 15, and 24 h to remove the surfactant and create a mesoporous structure. The prepared samples were characterised using a wide range of analytical techniques. Microscopical images showed that all uncalcined particles have cauliflower shape without porosity. However, after calcination, surface and deep pores were created on the synthesized nanoparticles. In addition, transmission electron microscope (TEM) images of calcined nanoparticles revealed a wormhole-like structure, which is typical for the mesoporous architectures. Based on X-ray diffraction (XRD), the uncalcined and calcined samples exhibit pure Fe3O4 (magnetite) and γ-Fe2O3 (maghemite) ferrite phases, respectively. The γ-Fe2O3 nanoparticles demonstrated a high Brunauer–Emmett–Teller (BET) surface area with pore diameters smaller than 10 nm and a type IV isotherm similar to the mesopores. Hysteresis loops measured by vibrating sample magnetometry (VSM) showed the superparamagnetic nature for mesoporous γ-Fe2O3 nanoparticles. The first-order reversal curve (FORC) diagram revealed the formation of a mesoporous structure in calcined materials which reduces coercive distribution (Hc) and magnetostatic interaction (Hu) once compared to non-calcined samples. Mesoporous γ-Fe2O3 nanoparticles were successfully employed as an adsorbent for the removal of heavy metal ions of Pb(II) from an aqueous solution. The highest lead ion adsorption was observed in mesoporous γ-Fe2O3 nanoparticles prepared with 3% CTAB.
Introduction
Porous materials can be categorized into three types based on pore size: macroporous (pores > 50 nm), mesoporous (pores 2–50 nm), and microporous (pores < 2 nm). Mesoporous nanoparticles have emerged as a fascinating class of materials with unique properties and diverse applications. These nanoparticles exhibit a well-defined porous structure with pore sizes ranging from 2 to 50 nm, offering a high surface area and large pore volume.1 Mesoporous nanoparticles, including mesoporous silica nanoparticles (MSNs),2 mesoporous carbon nanoparticles (MCNs),3 mesoporous metal oxide nanoparticles,4,5 mesoporous polymer nanoparticles,6 and mesoporous metal–organic frameworks (MOFs),7 are a versatile class of materials with well-defined mesoporous structures. These nanoparticles possess high surface area, adjustable pore sizes, and unique properties, rendering them highly suitable for a wide range of application.8,9The synthesis of mesoporous materials involves two common methods: soft template and hard template. Soft template synthesis relies on the self-assembly of surfactant like cetyltrimethylammonium bromide (CTAB), followed by surfactant extraction. The hard template method utilizes pre-existing mesoporous structures and involves self-assembly within the limited space of the template. Soft template synthesis often yields materials with low crystallinity and thermal stability. Techniques like true liquid crystal templating (TLCT) and evaporation-induced self-assembly (EISA) are employed for ordered mesoporous materials.10–12 The TLCT method employs liquid crystal phases as templates for mesoporous structure formation, utilizing the self-organization of anisotropic fluids with long-range order. The precursor solution is introduced into the liquid crystal phase, which solidifies and is then removed, leaving behind mesoporous structures.13,14 In contrast, the EISA method involves controlled solvent evaporation. The precursor and a structure-directing agent, such as a surfactant or block copolymer, are dissolved in the solvent. As the solvent evaporates, the structure-directing agent self-assembles, resulting in mesophase formation. Solidification and template removal lead to mesoporous nanoparticles.15,16 Both methods provide effective routes for creating well-defined mesoporous materials.
Typical porous materials with high surface areas, like MSNs and MCNs, are widely used as adsorbents and catalysts in industry.17 However, they can occasionally present issues for industrial applications due to their poor separation efficiency, high regeneration temperatures, and inappropriate hydrophilic/hydrophobic characteristics. In some applications, having a large surface area alone is insufficient.18 For instance, adsorbents must be highly capable of adsorption, sensitive to specific pollutants like radioactive particles, hazardous metal ions, organic and inorganic solutes/anions, recyclable with high separation efficiency, and simple to regenerate. In contrast, magnetic ceramics are a type of metal oxide that has many advantages, including high electrical resistivity, ease of synthesis, and resistance to corrosion and wear. Among magnetic ceramics, iron oxide that can exist in several phases such as magnetite (Fe3O4), hematite (α-Fe2O3), and maghemite (γ-Fe2O3), has been used in a variety of fields and applications.19,20 Two major classes of iron oxide, magnetite and maghemite, have fascinating magnetic properties that make them suitable candidates for a range of applications, including electromagnetic adsorbers, high-frequency switch modes, heavy ion adsorbents, magnetic recording devices, and, in particular, biomedical ones.21 Maghemite (γ-Fe2O3) is a recyclable soft magnetic material that can be easily separated using a magnetic separation method.
The most common method for synthesizing mesoporous maghemite nanoparticles involves oxidizing synthesized magnetite nanoparticles in the presence of CTAB. Initially, magnetite (Fe3O4) nanoparticles are synthesized using a wet chemical procedure in the presence of CTAB as a surfactant.22,23 The CTAB molecules adsorb onto the surface of the magnetite nanoparticles, stabilizing their growth and preventing agglomeration. Subsequently, the surfactant is removed from the Fe3O4 nanoparticles through an oxidation process. This oxidation step transforms the magnetite into maghemite (γ-Fe2O3) while creating a mesoporous structure within the nanoparticles.
Mesoporous maghemite nanoparticles has a lot of potential applications: drug delivery, cancer cell destruction (magnetic hyperthermia), enhanced MRI imaging, catalysis, energy storage.24,25 Also, mesoporous maghemite nanoparticles are effective in removing various heavy metals from aqueous environments. For instance, in order to successfully remove cadmium (Cd2+) ions from contaminated water medium, a mesoporous magnetic composite, γ-Fe2O3-functionalized cross-linked chitosan (γ-Fe2O3@CS), was utilized.26 Also, γ-Fe2O3 nanoparticles with polyrhodanine coating were used to remove heavy metal ions (Hg(II)) from aqueous solution.20,27 By utilizing their unique properties, mesoporous maghemite nanoparticles offer a promising solution for the remediation of heavy metal-contaminated water, contributing to the improvement of water quality and environmental health.26,27
In this comprehensive study, we conducted an in-depth investigation into the synthesis, microstructural characterization, magnetic properties, and adsorption efficiency of lead ions (Pb2+) from aqueous solutions using mesoporous maghemite nanoparticles. Our research aimed to explore the potential applications of these nanoparticles in water treatment and environmental remediation. The nanoparticles were synthesized through the oxidation of magnetite, which was prepared using the co-precipitation method with varying concentrations of CTAB surfactant. By examining different CTAB content, we aimed to assess the impact of surfactant content on the properties of the resulting mesoporous maghemite nanoparticles.
Experimental
Materials
The chemicals used for the synthesis of superparamagnetic mesoporous magnetite include divalent iron chloride (FeCl2), trivalent iron chloride (FeCl3·6H2O), cetyltrimethylammonium bromide (CTAB), sodium hydroxide (NaOH), ethanol (C2H2OH), deionized water (H2O), and liquid nitrogen with a purity of 99.9% supplied from Merck and Sigma-Aldrich.Synthesis
The method of Srivastava et al.28 was adopted for the synthesis of superparamagnetic mesoporous ferrite powder. Due to the different precursors of the process, Reaction (1) was considered.29| FeCl2 + 2FeCl3·6H2O + 8NaOH ⇒ Fe3O4 + 8NaCl + 10H2O | (1) |
First, a solution of metal salts was obtained by dissolving appropriate amounts of iron chlorides in ethanol and deionized water. Then, a separate solution of CTAB with different contents (0, 1.5, 3, 5, 20 and 30%) was prepared in 10 mL of ethanol. The two solutions were mixed followed by adding 60 mL of deionized water. A NaOH solution (2 M) was prepared in ethanol at 80 °C and dropwise added to CTAB and iron chloride solution until the pH of the suspension reached 11. The color of the suspension altered from yellowish brown to blackish brown upon adding NaOH, reflecting the reaction and the formation of iron oxide. The resulting precipitates were separated by a centrifuge and washed several times with deionized water and ethanol. The sediments were then placed in a freeze dryer to decline the temperature below 0 using liquid nitrogen. The iron oxide precipitates were dried in a freeze dryer for 6 h at −40 °C and under a vacuum of 450 Torr. They were heat-treated at 250 °C for 5, 10, 15, and 24 h in the furnace. The calcination process was only carried out to remove CTAB from the synthesized structure and form a mesoporous structure in iron oxide nanoparticles. Table 1 displays the codes for samples of ferrite nanoparticles synthesized before and after calcination according to various CTAB percentages.
| % of CTAB | Uncalcined samples | Calcined samples 250 °C |
|---|---|---|
| 0 | S1 | C1 |
| 1.5 | S2 | C2 |
| 3 | S3 | C3 |
| 5 | S4 | C4 |
| 20 | S5 | C5 |
| 30 | S6 | C6 |
Characterisation
Field emission scanning electron microscope (FESEM) (model SEM 950, Carl Zeiss) equipped with an energy dispersive X-ray (EDS) spectrometer and transmission electron microscope (TEM) (model Hitachi H-7000) were used to investigate the surface structure, morphology, size and size distribution of synthesized nanoparticles, as well as the effect of surfactant (CTAB) and calcination time on the size and size distribution of nanoparticles. Crystallographic structure of synthesised samples determined by X-ray diffraction using a Bruker, Germany, model D8 ADVANCE with a copper tube, a voltage of 40 kV, and a maximum current of 40 mA. The XRD pattern of the samples was taken between the angles of 20 to 65°. The detector scanned the sample with a step size of 0.01° every 4 seconds. Fourier transform infrared spectroscopy (FTIR) was used to identify the bonds in the synthesized mesoporous nanoparticles using a TENSOR 27 model made in Germany by Brucker Company. The analysis of N2 adsorption–desorption isotherms was used to check the porosity on the surface of the samples. The model of nitrogen gas adsorption and desorption device was BELSORP MINI II made by BEL company in Japan. The magnetic properties of the synthesized samples were measured using a vibrating sample magnetometer (VSM) manufactured by Magnetic Daneshpajoh Company in Kashan, Iran. The FORC measurements were carried out using a LakeShore VSM 7410 magnetometer. A standard solution proposed by Madhu Kumari and co-workers were used for using synthesized mesoporous superparamagnetic γ-Fe2O3 nanoparticles in lead adsorption.Results and discussions
Morphology
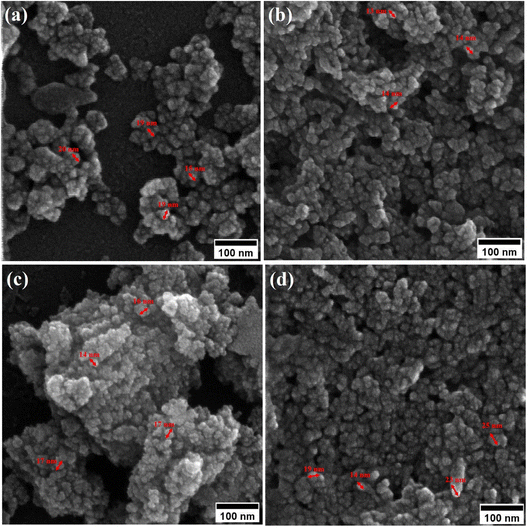
Field-emission scanning electron microscopy (FESEM) was used to assess the morphology of superparamagnetic mesoporous iron oxide nanoparticles. Fig. 1 and 2 show FESEM images of nanoparticles synthesized before calcination (S2, S4, S5, and S6 samples) and after 15 h of calcination (C2, C4, C5, and C6 samples) at 250 °C, respectively. As can be seen, uncalcined samples included bulk particles (Fig. 1), which can be assigned to the presence of the surface activators in the synthesized samples before calcination as the size of the same sample was shrunk after calcination and no cauliflower accumulation can be observed after calcination (Fig. 2). The images of the nanoparticles before calcination were recorded at 100k× magnification due to their adhesion to each other and their larger size; while the images of the particles after calcination (Fig. 2) were taken at the magnification of 330k× due to their smaller microstructure.30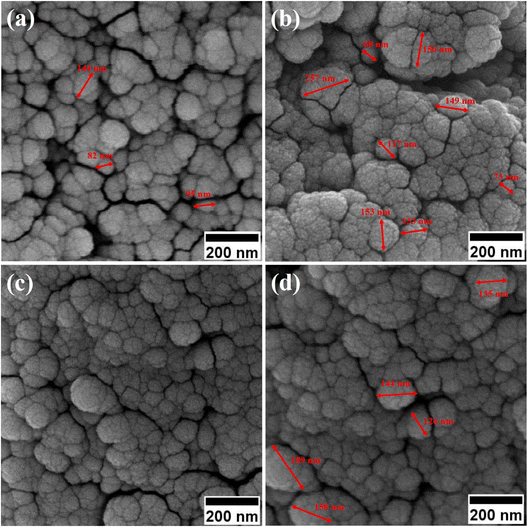 | ||
| Fig. 1 FESEM image of synthesized ferrite nanoparticles before calcination with CTAB of (a) 1.5%, (b) 5%, (c) 20% and (d) 30%. | ||
 | ||
| Fig. 2 FESEM image of synthesized ferrite nanoparticles after calcination with CTAB of (a) 1.5%, (b) 5%, (c) 20% and (d) 30%. | ||
Table 2 lists the mean particle size of the samples based on the FESEM images in Fig. 1 and 2.
| No | wt% of CTAB | Mean particle size before calcination (nm) | Mean particle size after calcination (nm) |
|---|---|---|---|
| 1 | 0 | — | 40 |
| 2 | 1.5 | 129 | 18 |
| 3 | 5 | 138 | 14 |
| 4 | 20 | 150 | 17 |
| 5 | 30 | 152 | 21 |
By enhancing the CTAB content in the samples (before calcination), their size was enlarged. The mean size of the uncalcined particles was initially 129 nm, which was enhanced to 152 by increasing the CTAB content. The nanoparticles had similar structures before calcination with no porosity as the pores were blocked by CTAB. The calcination is aimed to remove CTAB from the structure of the nanoparticles to form surface and depth porosity on/inside the superparamagnetic mesoporous nanoparticles. A comparison of the calcined nanoparticles indicated that the rise in the CTAB content first decremented the mean size of the nanoparticles followed by an increase. The same behavior was also observed in mesoporous iron oxide materials synthesized using the soft-templating method by increasing the CTAB content, the concentration of the structure-directing agent is elevated. This can lead to a higher coverage of CTAB molecules around the growing nanoparticles and result in larger particle sizes. The excess CTAB molecules form a thicker layer around the particles, promoting their growth and reducing the surface energy, which contributes to the enlargement of the nanoparticles.31
When CTAB is added to a solution, it forms micelles due to its lyotropic (liquid crystal) nature. The size of these micelles can be influenced by the concentration of CTAB in the solution. At low CTAB content, the micelles formed are relatively small in size. As the CTAB content increases, the size of the micelles initially decreases due to the increased surfactant-to-solvent ratio. This behavior is often observed in the regime of low to moderate CTAB content. However, as the CTAB content continues to increase, a critical point is reached where the micelles start to grow in size. This can be attributed to the increased availability of CTAB molecules, which leads to the formation of larger micelles. At this point, the surfactant-to-solvent ratio becomes more favorable for the growth of larger micelles, resulting in an increase in their size. Regarding the complete removal of surface activators, such as CTAB, from structures with higher CTAB content, it can indeed pose challenges. When a higher amount of CTAB is used, it can become more difficult to remove all the surfactant molecules during subsequent purification steps, such as calcination or washing processes. Incomplete removal of CTAB can lead to residual surfactant molecules remaining on the surface of the nanoparticles.32–34 These residual surfactants can act as adhesive agents, causing the particles to adhere to each other. This phenomenon can result in particle aggregation or agglomeration, affecting the overall structure and properties of the mesoporous iron oxide nanoparticles.35 The size distribution of the synthesized nanoparticles was calculated by FESEM analysis of Fig. 2 as depicted in Fig. 3. The size distribution of the particles synthesized in the absence of CTAB is also depicted in Fig. 3(a) (sample C1). In normal Gaussian diagrams, the highest frequency shows the mean size of the particles. In this regard, the nanoparticles synthesized without CTAB had a mean particle size of 35 and 105 nm. The size distribution of these particles also showed a wide diagram extending from 10 to 120 nm. The mean size of nanoparticles prepared in the presence of 1.5 wt% CTAB (sample C2) was 19 nm with a narrow distribution from 10 to 30 nm, while 90% of the particles fell below the size of 20 nm (Fig. 3(b)). A rise in the CTAB content from 1.5 to 5% (sample C4) led to narrower size distribution as the size distribution of particles varied from 5 to 25 nm, where 90% of the particles were smaller than 20 nm and larger than 5 nm (Fig. 3(c)). The mean size of these particles was estimated to be 15 nm. A rise in the CTAB content from 5 to 20% (sample C5) and 30% (sample C6) enhanced the size of the particles from 15 to 17 and 20 nm, respectively. The size distribution diagrams indicated that the size of particles, prepared in the presence of 20% CTAB, varied from 5 to 20 nm (Fig. 3(d)), which is similar to the particles synthesized with 5% of CTAB; however, 90% of these particles were smaller than 18 nm. The distribution of the particles synthesized by 30% of CTAB (sample C6) was wider (ranging from 11 to 30 nm) than those prepared with 5 and 20% of CTAB (sample C5). The samples prepared with various CTAB contents were calcined at 250 °C for 5, 10, 15, and 20 h to assess the influence of the calcination time on the morphology. Fig. 4 shows the morphology of iron oxide nanoparticles prepared with 1.5% of CTAB before (sample S2) and after calcination (sample C2) for 5, 10, and 15 h. As expected, a rise in the calcination temperature decremented the particle size and accumulation. The size of the bulk particles before the calcination process was 129 nm which declined to 27, 23, and finally 18 nm after calcination for 5, 10, and 15 h, respectively. The same trend can be observed in the case of iron oxide nanoparticles prepared with 5% of CTAB (samples S4 and C4) (Fig. 5). A comparison of the morphology of samples S4 and C4 in Fig. 5 revealed a decline in the size of the accumulated particles as well as nanoparticles. For sample S4 (Fig. 5(a)), the size of the accumulated particles was 138 nm which declined to 53 and 14 nm after 5 and 15 h of calcination, respectively (Fig. 5(b) and (c)). Based on FESEM images, more CTAB will be removed by prolonging the calcination time, leading to the formation of mesoscale pores. On the other hand, as agglomeration declined with the removal of the surface activators, the true size of the particles can be measured at high accuracy.
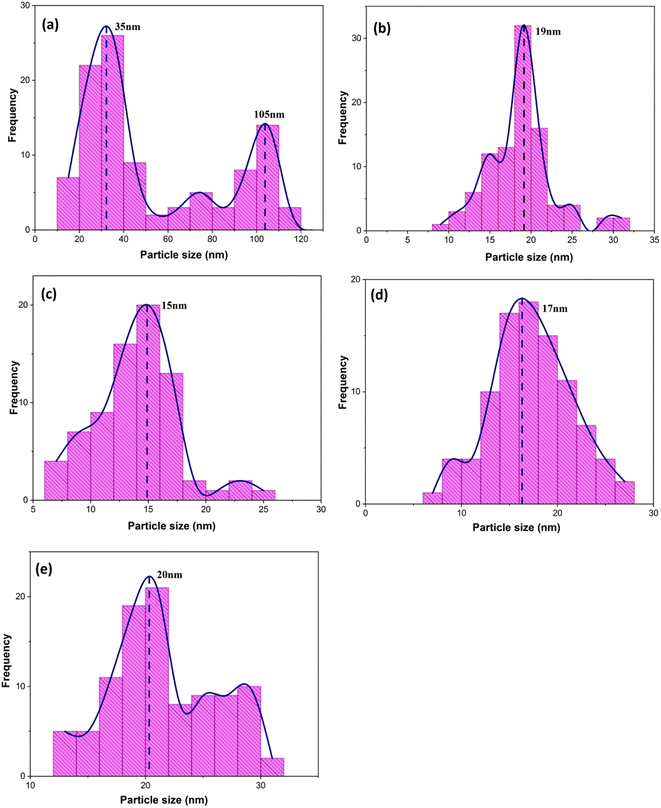 | ||
| Fig. 3 Size distribution diagrams of synthesized particles in the presence of various concentrations of CTAB: (a) without the presence of CTAB and (b) 1.5%, (c) 5%, (d) 20%, and (e) 30% of CTAB (extracted from Fig. 2 FESEM images). | ||
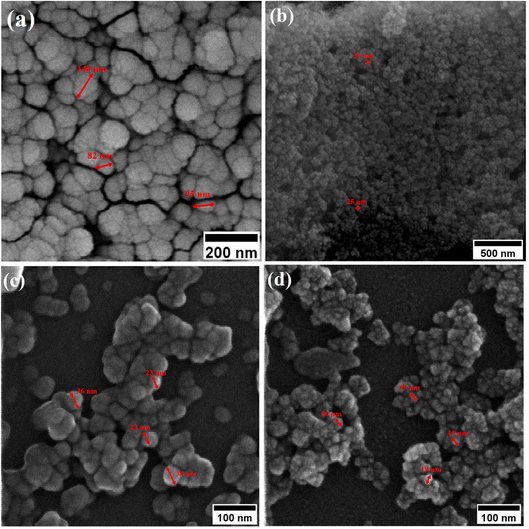 | ||
| Fig. 4 Morphology of iron oxide nanoparticles synthesized with 1.5% of CTAB (a) before calcination and after calcination for (b) 5 h, (c) 10 h and (d) 15 h at 250 °C. | ||
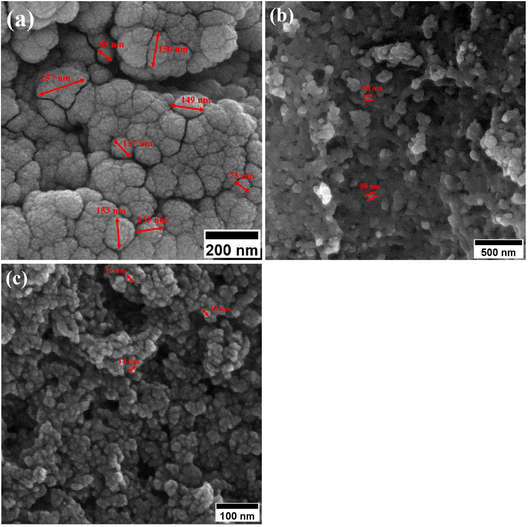 | ||
| Fig. 5 Morphology of iron oxide nanoparticles synthesized with 5 wt% of CTAB (a) before calcination and after calcination for (b) 5 h, and (c) 15 h at 250 °C. | ||
Fig. 6 shows TEM images at various magnifications of iron oxide nanoparticles calcined at 250 °C for 24 h with 1.5 wt% (sample C2) and 3 wt% (sample C3) CTAB. The samples contain nanoparticles with almost uniform size in the range of 10–20 nm, as shown in Fig. 6(a) and (d). The uniform and tubular structure of the samples generated, with worm-like mesopores, is also clearly visible in Fig. 6(b) and (d). Mesoporous iron oxide nanoparticles are partially agglomerated spherical particles, as shown in Fig. 6(c) and (f). The presence of agglomerated particles can be attributed to the growth mechanism of particles during the CTAB-assisted co-precipitation synthesis of mesoporous iron oxide nanoparticles. In this technique, CTAB surfactant plays a crucial role as a soft template for the formation of the nanoparticles. During the co-precipitation process, the Ostwald ripening mechanism becomes predominant in the growth of the nanoparticles. Ostwald ripening occurs due to the difference in surface free energy between smaller and larger nanoparticles. Smaller nanoparticles possess higher surface free energy compared to larger nanoparticles. As the reaction progresses, nanoparticles of various sizes are present in the solution. The higher surface free energy of smaller nanoparticles drives the diffusion of material from smaller to larger particles. This phenomenon is known as Ostwald ripening or particle coarsening. The material from smaller nanoparticles tends to dissolve and redeposit on the surfaces of larger nanoparticles, leading to their growth at the expense of smaller particles. However, during this growth process, there can be instances where the aggregation or agglomeration of particles occurs. Aggregation refers to the formation of clusters or aggregates of particles, whereas agglomeration refers to the sticking together of individual particles. The agglomeration/agglomeration of particles can be attributed to various factors, including the presence of residual surfactant, the concentration and distribution of particles in the solution, and the conditions during the co-precipitation process. To minimize agglomeration/agglomeration and promote the formation of well-dispersed mesoporous iron oxide nanoparticles, careful optimization of the synthesis parameters, such as the concentration of CTAB, reaction temperature, and reaction time, is required. Additionally, subsequent purification steps, such as washing and calcination, play a crucial role in removing residual surfactants and stabilizing the nanoparticles, ensuring their uniform dispersion and preventing further agglomeration/agglomeration. It can also be seen from Fig. 6(c) and (f) that the particle size of sample C3 is smaller than that of sample C2, which can be related to the more amount of CTAB used in the sample C3. A greater amount of CTAB causes more gas to be released from the burning of CTAB during the calcination process, increasing porosity and decreasing particle size.36 It should be noted, however, that a higher concentration of CTAB may have an adverse effect on the morphology of mesoporous nanoparticles. In this case, CTAB may not be completely removed from the nanoparticle structure during the calcination process, resulting in a decrease in porosity and an increase in particle size.
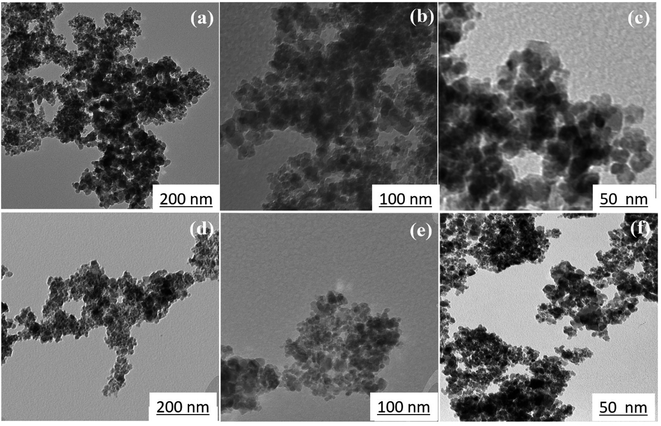 | ||
| Fig. 6 TEM images of mesoporous iron oxide nanoparticles prepared in the presence of (a, b and c) 1.5 wt% CTAB (sample C2), (d, e and f) 3 wt% CTAB (sample C3) after 24 h of calcination at 250 °C. | ||
Fig. 7(a) shows the transmission electron microscopy (TEM) image of the sample C3 after 15 h of calcination. As depicted in Fig. 7(a), the nanoparticles have a wormhole-like structure, which is the characteristic of mesoporous structures. This structure is a defining characteristic of mesoporous materials and contributes to their high surface area and pore volume. The term “wormhole-like” refers to the presence of a network of interconnected pores within the nanoparticles, resembling tunnels or channels. These pores have a well-defined size and shape, typically in the mesoscale range (2 to 50 nanometers in diameter). The interconnected nature of these pores creates a three-dimensional framework, providing a large surface area for interactions with molecules and facilitating the diffusion of substances within the nanoparticle. The wormhole-like structure in mesoporous nanoparticles is typically formed during the synthesis process. In the case of mesoporous iron oxide nanoparticles, the addition of CTAB surfactant during co-precipitation or other synthesis methods plays a crucial role in creating and stabilizing this structure. CTAB molecules self-assemble around the nanoparticles, forming a template that guides the growth and arrangement of the mesoporous structure. The resulting wormhole-like structure in mesoporous iron oxide nanoparticles offers several advantages for various applications. The high surface area and pore volume enable efficient adsorption and diffusion of molecules, making them desirable for applications such as catalysis, drug delivery, and sensing. Additionally, the interconnected pores provide a means for controlled release of encapsulated substances or targeted transport within the nanoparticles. The size distribution of the particles was also assessed by selecting 150 particles as showed in Fig. 7(b). The particles exhibited an ultra-narrow size distribution (3–15 nm) with high overlap.37
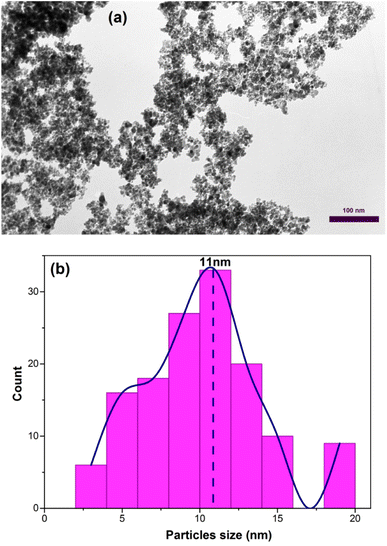 | ||
| Fig. 7 (a) TEM image of mesoporous iron oxide nanoparticles prepared by using 3% of CTAB after calcination for 15 h (b) size distribution diagram of the same sample. | ||
Phase and elemental analysis
The XRD patterns of the S3 and C3 (calcinated for 24 h) samples are displayed in Fig. 8. The XRD pattern of sample S3, with a prominent peak (311) at about 35.9° and planes (220), (400), (422), (511), and (440) at about 30.5, 43.7, 53.8, 57.3, and 62.9° matches well with the Fe3O4 (magnetite) phase according to JCPDS code: 96-900-5817. There was no evidence of other iron oxide phases in sample S3. Sample C3 shows similar planes with a little shift in peak locations. This shows that, while the lattice constant differs between the two samples, the crystal structure (cubic spinel lattice) is identical. Furthermore, the intensity of the peaks is increased after calcination at 250![[thin space (1/6-em)]](https://www.rsc.org/images/entities/char_2009.gif) C, which indicates an improvement in the crystallinity and removal of the surfactants from the nanoparticle pores. The evaluation of the data in the High Score Plus software package suggests the presence of a maghemite phase (γ-Fe2O3) in sample C3 with JCPDS code: 96-900-6317. The most common method of synthesizing γ-Fe2O3 is to oxidize Fe3O4 in air at temperatures around 200–300 °C. Therefore, it can be inferred that the Fe3O4 phase entirely transforms into the γ-Fe2O3 phase following the calcination of sample S3 at 250.
C, which indicates an improvement in the crystallinity and removal of the surfactants from the nanoparticle pores. The evaluation of the data in the High Score Plus software package suggests the presence of a maghemite phase (γ-Fe2O3) in sample C3 with JCPDS code: 96-900-6317. The most common method of synthesizing γ-Fe2O3 is to oxidize Fe3O4 in air at temperatures around 200–300 °C. Therefore, it can be inferred that the Fe3O4 phase entirely transforms into the γ-Fe2O3 phase following the calcination of sample S3 at 250. ![[thin space (1/6-em)]](https://www.rsc.org/images/entities/char_2009.gif) C38 The lattice constant decreases from 8.471 to 8.351 Å as magnetite transforms into maghemite. The decreasing lattice constant could be explained by the ionic radii of the Fe2+ and Fe3+ cations. Since Fe2+ cations have a larger ionic radius, the Fe–O distance is also larger. Because of the oxidation of Fe2+ cations to Fe3+ cations during the conversion of maghemite to magnetite, the spacing reduces and leads to a decrease in the lattice constant. The crystallite size of the particles synthesized was calculated by the Debye–Scherer equation:
C38 The lattice constant decreases from 8.471 to 8.351 Å as magnetite transforms into maghemite. The decreasing lattice constant could be explained by the ionic radii of the Fe2+ and Fe3+ cations. Since Fe2+ cations have a larger ionic radius, the Fe–O distance is also larger. Because of the oxidation of Fe2+ cations to Fe3+ cations during the conversion of maghemite to magnetite, the spacing reduces and leads to a decrease in the lattice constant. The crystallite size of the particles synthesized was calculated by the Debye–Scherer equation:
 | (2) |
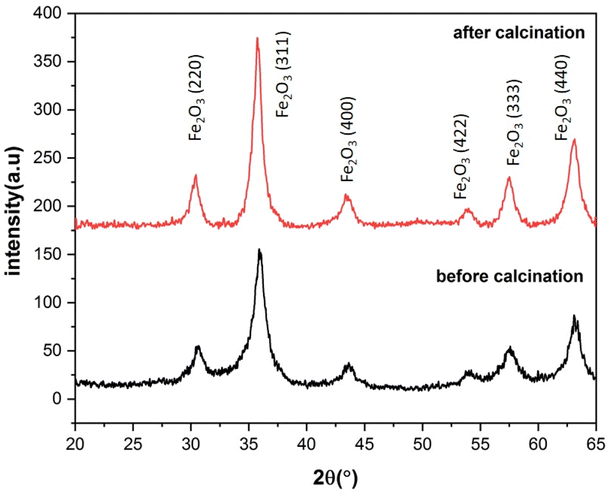 | ||
| Fig. 8 X-ray diffraction patterns of ferrite nanoparticles synthesized with 3% of CTAB before and after calcination for 24 h at 250 °C. | ||
EDS analysis was used to determine the composition of the mesoporous γ-Fe2O3 nanoparticles for 5% CTAB after 24 h of calcination at 250 °C, as shown in Fig. 9. According to EDS analysis, the product consists of Fe, O, C, Si and Al elements. The presence of carbon in the iron oxide nanoparticle composition indicates that CTAB is not completely eliminated during the calcination process, whereas the Si and Al peaks in the EDS spectra are related to the semiconductor substrate on which the sample is placed. The iron-containing region in the EDS spectra of iron oxide nanoparticles was between 0–1 and 6–7 keV, while the oxygen-containing region was between 0–1 keV. The peaks around 0.7, and 6.5 keV were connected with Fe binding energies, while the peak at 0.5 keV was related with oxygen binding energies. As a result, the EDS spectra for sample C3 confirmed the formation of γ-Fe2O3 nanoparticles.42 In order to better understand the distribution of the constituent elements of mesoporous γ-Fe2O3 nanoparticles, the EDS mapping analysis of sample C3 is shown in Fig. 9. Elemental mapping analysis confirms the uniform distribution of Fe and O elements in the mesoporous γ-Fe2O3 nanoparticles, as well as the residual carbon traces from CTAB, which are uniformly spread throughout the sample. For the full removal of CTAB from iron oxide composition, a high calcination temperature (500 ![[thin space (1/6-em)]](https://www.rsc.org/images/entities/char_2009.gif) C) is required.43 But increasing the calcination temperature will lead the growth of particles and the loss of the mesoporous structure. Therefore, the presence of carbon in the final product is normal due to the low calcination temperature.
C) is required.43 But increasing the calcination temperature will lead the growth of particles and the loss of the mesoporous structure. Therefore, the presence of carbon in the final product is normal due to the low calcination temperature.
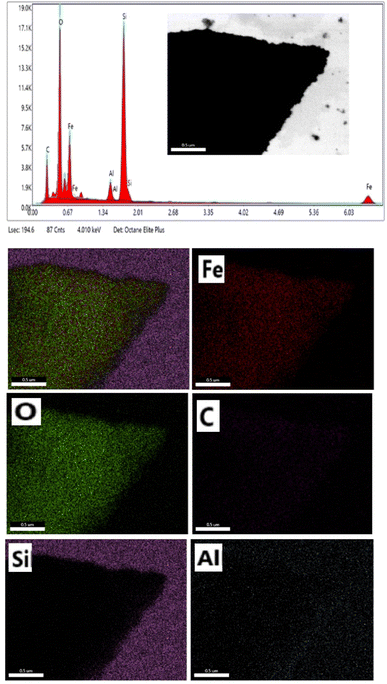 | ||
| Fig. 9 EDS and elemental mapping of mesoporous γ-Fe2O3 nanoparticles prepared in the presence of 3% of CTAB (sample C3). | ||
FTIR spectroscopy
Fourier transform infrared spectroscopy (FTIR) was utilized to assess the chemical bonds on the surface of the samples. Fig. 10 shows the FTIR results of the mesoporous γ-Fe2O3 nanoparticles for C1, C2, and C4 after 5 h of calcination at 250 °C. The peaks (low frequency bands) between the wavenumber of 567 cm−1 and 577 cm−1 correspond to the stretching vibrations of the Fe–O bond, which are consistent with those observed in the spinel maghemite (γ-Fe2O3) phase.44 The peaks emerging at 1635–1648 cm−1 in all three samples can be attributed to water and ammonia molecules. The peaks at 3390–3420 cm−1 are related to the decline of the water content in the samples after calcination. The peaks at 2919.78 and 2854.38 cm−1 in the samples of C2 and C4 can be ascribed to the hydrocarbon chains (CH3+ and CH2+) in the CTAB. The presence of an adsorption peak related to the C–Br bond at 788.24 and 890 cm−1 in the C4 sample suggests the incomplete removal of the surface activator during the calcination process.45,46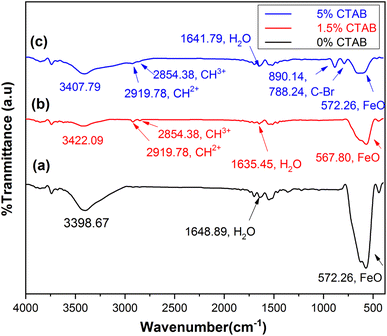 | ||
| Fig. 10 FTIR spectra of synthesized mesoporous γ-Fe2O3 nanoparticles in the presence of (a) 0%, (b) 1.5% and (c) 5% of CTAB after 5 h of calcination at 250 °C. | ||
Nitrogen adsorption–desorption isotherms of superparamagnetic mesoporous γ-Fe2O3 nanoparticles
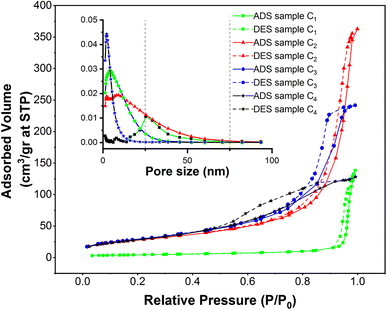
In order to assess specific surface area, the nitrogen adsorption and desorption test was performed on four samples of mesoporous γ-Fe2O3 nanoparticles that had been calcined for 24 h at 250 °C. These nanoparticles were similar except for their CTAB content which was different. The nitrogen adsorption–desorption isotherms (BET), as well as the size distribution of the pores determined by BJH calculations, are presented in Fig. 11, for C1, C2, C3 and C4 samples and the important information of these diagrams is also listed in Tables 3 and 4. As suggested in Fig. 11, all the isotherms are of IV type with H1 hysteresis which is typical of the mesoporous materials. This implies that the surface porosity is in the range of 2–50 nm.47 The size distribution of the pores was estimated by the BJH method as depicted in the left corner of Fig. 11.| Sample | % of CTAB | Calcination time (h) | Specific surface area (m2 g−1) | Average pore size (nm) |
|---|---|---|---|---|
| C1 | 0 | 24 | 19.2 | — |
| C2 | 1.5 | 24 | 121.2 | 8 |
| C3 | 3 | 24 | 141.8 | 2 |
| C4 | 5 | 24 | 138 | 4 |
| Sample | % of CTAB | Specific surface area BJH (m2 g−1) | Specific surface area Langmuir (m2 g−1) | Specific surface area BET (m2 g−1) | Specific surface area t-plot (m2 g−1) | Particle size estimation DEBT (nm) |
|---|---|---|---|---|---|---|
| C2 | 1.5 | 121.2 | 124.9 | 110.5 | 95.1 | 11 |
| C3 | 3 | 141.8 | 140 | 125.9 | 95.9 | 9.7 |
| C4 | 5 | 138.1 | 134 | 120 | 92.6 | 10 |
Based on the results, the porosity size distribution of the C2, C3 and C4 samples was about 8, 2, and 4 nm. The porosity size distribution of the C3 sample prepared in the presence of 3% CTAB was very narrow and comparable to the value (2.1–2.5 nm) reported by Mitra.31 But the distribution of pore size was wider in the C4 sample prepared with 5% CTAB; this width was even higher for the C2 sample synthesized by 1.5% CTAB. This can decrement the specific surface area of these samples.
As depicted in Table 3, a rise in CTAB content from 1.5 to 3% enhanced the specific surface area to 141.88 m2 g−1 while the pore size declined from 8 to 2 nm. Further enhancement in the CTAB percentage to 5% slightly decremented the specific surface area to 138 m2 g−1 and the pore size also showed an increase to 4 nm compared to the sample prepared with 1.5% of CTAB. The specific surface area obtained in this study was significantly greater than the value (7.9 m2 g−1) reported by Zhang and co-workers.48 Assuming spherical particles with uniform size distribution (which is not far from reality in this research), eqn (3) can be employed to estimate the particle size regarding the specific surface area determined by the BET method.
 | (3) |
Adsorption isotherms are mathematical models used to describe the relationship between the amount of adsorbate (gas or solute) adsorbed on an adsorbent surface and the equilibrium pressure or concentration of the adsorbate. There are several types of adsorption isotherms, including: Langmuir, BET (Brunauer–Emmett–Teller), BJH (Barrett–Joyner–Halenda) and t-plot isotherms. The Langmuir isotherm assumes monolayer adsorption on a homogeneous surface with a limited number of identical adsorption sites. It assumes that adsorption is reversible and that there is no interaction between adsorbed molecules. The Langmuir equation is often used for systems where adsorption occurs on a surface with limited sites. The BET isotherm is specifically designed for the analysis of gas adsorption on solid surfaces with multilayer adsorption. It assumes the formation of a monolayer on the surface with subsequent layers exhibiting lower adsorption energies. The BET model is commonly used for mesoporous materials to determine surface area, pore size distribution, and adsorption capacity. In mesoporous nanoparticles, the BET isotherm is often used due to its ability to describe the multilayer adsorption behavior on porous surfaces. Mesoporous materials have a high surface area and well-defined pore structures, making the BET model suitable for characterizing their adsorption properties. The BET model allows for the determination of specific surface area, pore volume, and pore size distribution, which are important parameters in understanding the adsorption capacity and performance of mesoporous nanoparticles in various applications. Additionally, the BET model provides insights into the surface properties and accessibility of the adsorption sites in mesoporous materials, making it a valuable tool for optimizing the design and application of mesoporous nanoparticles in fields such as water treatment, environmental remediation, and separation processes. The BJH isotherm is used to analyse the pore size distribution in mesoporous materials. It is based on the desorption branch of the nitrogen adsorption isotherm, where the adsorbed nitrogen is gradually desorbed from the material at various relative pressures. By analysing the desorption data, the BJH model can provide information about the size distribution of the pores in the material, including the mesopores. The t-plot model is another method used to analyse the pore size distribution, specifically for microporous and mesoporous materials. It is based on the analysis of the adsorption branch of the nitrogen adsorption isotherm. The t-plot model calculates the thickness of the adsorbed nitrogen layer at different relative pressures and uses this information to estimate the pore size distribution. This model is particularly useful for materials with narrow pore size distributions. Table 4 compares the specific surface area determined by these various methods (BET, BJH, Langmuir, and t-plot).
Magnetic properties of the synthesized nanoparticles
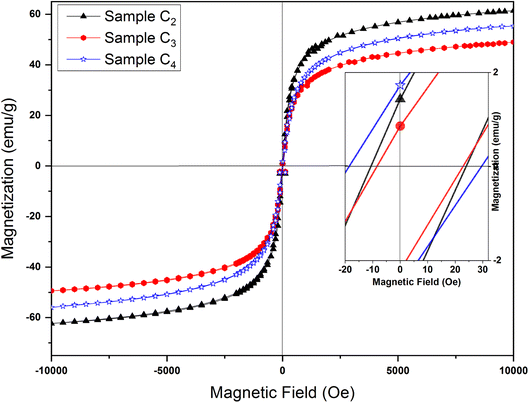 | ||
| Fig. 12 Magnetic hysteresis loops of samples synthesized in the presence of 1.5%, 3% and 5% CTAB calcined at 250 °C for 24 h. Magnified hysteresis loops are presented on the inset. | ||
Hc and Ms values for samples prepared with different amount of CTAB are presented in Table 5. Maximum saturation magnetization at the external field of 10 kOe is 61.06 emu g−1 (C2 sample), which is smaller than the saturation magnetization of bulk γ-Fe2O3 (74 emu g−1).52 Such a low value compared to bulk samples can be assigned to the high surface-to-volume ratio of mesoporous nanoparticles. A large percentage of their atoms are located on the surface, which causes changes such as the formation of crystal lattice vacancies, breakage of chemical bonds, water adsorption on the particle surface, and redistribution of cations all of which lead to a decrease in the saturation magnetization. The surface effects also lead to the formation of a dead magnetic layer on the surface of the particles, which can ultimately reduce the saturation magnetization of nanoparticles compared to their bulk materials.53 As one can see from the Table 4, the saturation magnetization for C3 and C4 samples is low compared to C2 sample, which can be related to the decrease in particle size with the increase in CTAB amount.
| Sample | CTAB% | Magnetization saturation Ms (emu g−1) | Coercivity Hc (Oe) | Particle size estimation DEBT (nm) |
|---|---|---|---|---|
| C2 | 1.5 | 61.06 | 23.83 | 20 (from TEM image) |
| C3 | 3 | 49.06 | 22.78 | 11 (from TEM image) |
| C4 | 5 | 55.33 | 29.43 | 14 (from SEM image) |
First-order reversal curve (FORC) diagram method
Hysteresis loops can offer a general and direct insight into the magnetic behaviour of the sample. Advanced methods such as the first-order reversal curve (FORC) diagram method have been recently developed for an accurate and detailed understanding of the properties and magnetic behaviour of materials.54 In particular, FORC diagrams offer the possibility of evaluating the distribution of the coercive forces and magnetostatic interactions in the investigated sample.55 The FORC distribution can be calculated as the second-order complex derivative of the magnetization (M) in terms of the magnetic field (H) and the reversal field (Hr) according to the following equation.56
 | (4) |
 | (5) |
 | (6) |
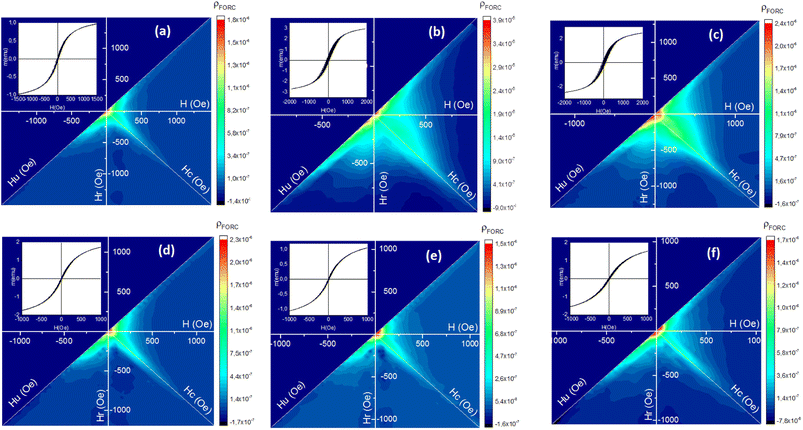
Fig. 13 shows the FORC diagrams of the mesoporous γ-Fe2O3 nanoparticles prepared in the presence of 1.5, 3, and 5% CTAB before (S2, S3 and S4 samples) and after calcination (C2, C3 and C4 samples) for 24 h at 250 °C. Elongation (non-elongation) along the Hu axis could suggest the presence (absence) of magnetic interactions between the particles. The Hc shows the coercive force distribution of magnetic particles, and the elongation of the FORCs diagram along this axis can be the sign of the presence of nanoparticles with different coercive forces as result of large particle size distribution in the sample.
Since superparamagnetic particles have an almost zero coercive field, FORC-diagrams for them usually have main peak with highest ρ in the close to zero Hc region. The distribution of ρ on FORC-diagrams of all samples can be divided into two different regions - one is characterized by close to zero coercive forces and relatively wide distribution along the Hu axis, and the other represents elongated distribution along the Hc axis with almost no interactions.58 The intensities of these two regions are different before and after calcination, it also varies with CTAB content variations.
The ridge analysis of ρ of the FORC diagram showed higher broadening along the Hc axis in the uncalcined samples (Fig. 13(b) and (c)) when compared to the calcined ones (Fig. 13(d)–(f)). As one can see, maximum HFORCc on the half-height for uncalcined samples can reach up to 500 Oe, a rather large coercive force characteristic for single-domain nanoparticles with bigger sizes. After the calcination Hc distribution shrinks notably, with decreasing of maximum HFORCc to 100 Oe, signifying the domination of superparamagnetic phase. TEM and SEM results of the nanoparticles before calcination also showed wider size distribution of the particles compared to the calcined samples. The only exception is S2 sample (1.5% of CTAB) FORC-diagram which does not changes notably.
A significant elongation can be observed along the Hu axis for the uncalcined samples due to their large particle size and particle agglomeration because of the presence of CTAB. This indicates higher magnetostatic interactions in the uncalcined samples.59 After the calcination, the distance between the γ-Fe2O3 particles increases due to the post-calcination porosity which naturally decreases the magnetostatic interaction and results in shortening of Hu distribution on FORC-diagram for calcinated samples. Table 6 shows the average coercivity forces (HFORCc), interaction fields (Hu), squareness ratio (Mr/Ms) obtained from FORC-diagrams.
| Samples | CTAB% | HFORCc (Oe) | Hu (Oe) | Mr/Ms | |
|---|---|---|---|---|---|
| Uncalcinated (Fe3O4) | S2 | 1.5 | 40 | 161 | 0.047 |
| S3 | 3 | 132 | 295 | 0.118 | |
| S4 | 5 | 170 | 221 | 0.104 | |
| Calcinated (γ-Fe2O3) | C2 | 1.5 | 18 | 150 | 0.031 |
| C3 | 3 | 14 | 120 | 0.022 | |
| C4 | 5 | 20 | 191 | 0.026 | |
Application of mesoporous magnetite nanoparticles as lead ion adsorbent
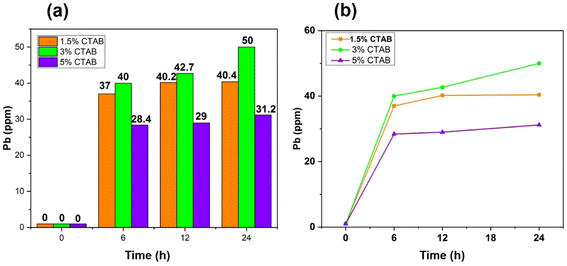
Heavy metals have been distributed in the environment as a result of human activities. People can be exposed to these metals by consuming food or contaminated water. The gradual accumulation of these metals in the body leads to adverse effects. Lead is one of the most dangerous heavy metals in food which can damage the respiratory and immune systems. This metal is highly toxic for children due to its destructive influence on their nervous systems. No organ of a child's body is immune to the effects of lead poisoning.60–62 In the present research, synthesized mesoporous γ-Fe2O3 nanoparticles were used to remove Pb2+ from an aqueous solution.To investigate the effect of the surface activator (CTAB) content used during the synthesis of superparamagnetic mesoporous γ-Fe2O3 nanoparticles on the lead adsorption efficiency, three C2, C3 and C4 (calcined for 24 h) were selected. The effect of contact time of synthesized nanoparticles with the lead ion-containing solution on the Pb2+ adsorption efficiency was explored by preparing three solutions of 100 mg of Pb2+ per litter (50 mL) at a pH of 5. For this purpose, 0.1 g of C2, C3 and C4 samples were added to each container containing lead ions and placing them on the shaker for 6, 12, and 24 h. After separating the superparamagnetic nanoparticles from the suspensions, the secondary concentration of lead ion was measured by atomic adsorption. Table 7 shows the initial and final concentration of lead ions in the suspensions containing nanoparticles of C2, C3 and C4 samples after 6, 12, and 24 h of contact with nanoparticles. The influence of the CTAB content on the adsorption capacity of nanoparticles is shown in Fig. 14(a). The general trend shows a rise in lead ion adsorption by enhancing the CTAB content due to the increase in the porosity of the synthesized nanoparticles. This trend can be seen in the case of nanoparticles of C2 and C3 samples with 1.5 and 3% of CTAB, respectively. But nanoparticles synthesized with 5% of CTAB (sample C4) exhibited the opposite behaviour as their lead ion adsorption declined despite an increase in CTAB percentage and possibly the increment in porosity. The reason could be improper CTAB removal from the pores of the synthesized particles during the calcination process. This sample needs longer calcination for improvement of the result.63
| Sample | CTAB% | Initial concentration of Pb in solution (mg L−1) | Pb concentration in solution after 6 h (mg L−1) | Pb concentration in solution after 12 h (mg L−1) | Pb concentration in solution after 24 h (mg L−1) |
|---|---|---|---|---|---|
| C2 | 1.5 | 100 | 63 | 59.8 | 60.6 |
| C3 | 3 | 100 | 60 | 57.3 | 49.9 |
| C4 | 5 | 100 | 71.6 | 71 | 68.8 |
The effect of the contact time of synthesized nanoparticles on the adsorption percentage of lead ions in the solution is depicted in Fig. 14(b). As can be seen, an increase in the contact time of nanoparticles with lead ions enhanced the percentage of adsorbed lead ions. The equilibrium adsorption capacity of lead ions can be calculated by eqn (7).64
 | (7) |
In which, qe is the equilibrium adsorption capacity (mg g−1); v shows the volume of solution (L); C0 and Ce represent the initial and equilibrium concentration of lead ion in the solution (mg L−1), respectively; and m is the mass of synthesized nanoparticles. Equilibrium adsorption capacity was employed to compare the results of the present research with previous studies as listed in Table 8. According to Table 8, among the created superparamagnetic mesoporous γ-Fe2O3 nanoparticles in the current investigation, sample C2 has the highest equilibrium lead ion adsorption capacity, surpassing that of the Fe3O4 nanospheres made by Kumari et al.65
| No. | Nanoparticles used | Synthesis method | Equilibrium adsorption capacity of the mentioned element (mg g−1) | Ref |
|---|---|---|---|---|
| 1 | γ-Fe2O3 | Using CTAB and co-precipitation method | Pb2+(1.5% CTAB): 20.7 | This work |
| Pb2+(3% CTAB): 25 | ||||
| Pb2+(3% CTAB): 15.6 | ||||
| 2 | Fe3O4 nanospheres | One-step solvothermal method | Pb2+: between 6.64 and 8.90 | 65 |
| 3 | ϒ-Fe2O3 | Sol – Gel | Cr4+: 19.2 | 66 |
| 4 | ϒ-Fe2O3 | Sol – Gel | Cu2+: 26.8 | 67 |
| 5 | Hematite | Co-precipitation | Cu2+: 84.46 | 68 |
| 6 | Core (Fe3O4)-Shell (Al–Mn) | Hydrothermal and chemical self-assembly process | Cr4+: 150 | 69 |
| 7 | Fe3O4@APS@AA-co-CA MNPs | Co-precipitation/free-radical polymerization | Zn2+: 43.4 – Cd2+: 29.6 – Pb2: 166.1 | 70 |
| 8 | γ-Fe2O3 | Wet chemical | Zn2+: 4.49 – Cd2+: 1.75 – Pb2: 10.55 | 71 |
| 9 | γ-Fe2O3 | Co-precipitation | Pb2: 25 | 72 |
| 10 | γ-Fe2O3 | Hydrothermal | Arsenic ions: 73.2 | 73 |
Conclusions
Iron oxide nanoparticles based on spinel ferrite were synthesized by the co-precipitation method in the presence of different contents of CTAB as a micellular surfactant. The XRD patterns revealed that the synthesized samples were composed of the magnetite (Fe3O4) phase before to calcination, but following calcination at 250 °C, it was entirely converted into maghemite (γ-Fe2O3). FESEM and TEM images confirmed the formation of nanoparticles with the mesoporous structure after calcination process. To investigate the impact of calcination duration on the removal of surfactant and the formation of mesoporous γ-Fe2O3 structure and also to study its magnetic properties, Fe3O4 nanoparticles were calcined at constant temperature of 250 °C for 5, 10, 15 and 24 h. The obtained results showed that the CTAB content used in the synthesis of nanoparticles, as well as the calcination duration, had a significant effect on the particle size, particle size distribution, pore size, and specific surface area of the final nanoparticles. The optimal amount of surface activator was 3% as the sample prepared in the presence of 3% of CTAB showed the highest specific surface area (140 m2 g−1). Increasing the calcination time improved the mesoporous structure due to enhancing CTAB removal from the nanoparticle microstructure. The investigation of magnetic properties of the calcined samples showed an s-shaped hysteresis, with close to zero coercivity and remnant magnetization. In combination with sizes of the nanoparticles, it can be assumed that nanoparticles are in superparamagnetic state with good approximation. The non-zero values of coercive force can be assigned to the wide size distribution of the synthesized particles as well as the incomplete removal of CTAB from the nanoparticle microstructure, which act as pinning sites. The lowest coercive force (8 Oe) was related to mesoporous nanoparticles synthesized with 3% of CTAB, therefore, this sample had the best magnetic properties for the proposed usage. The FORC diagrams showed that uncalcined samples are characterized with high interaction fields and coercivity due to their large particle size and particle agglomeration because of the presence of CTAB. After the calcination process, the width of the coercivity force and interaction field decreased significantly due to the formation of a mesoporous structure and overall decrease of nanoparticles' sizes. Furthermore, mesoporous nanoparticles with 3% of CTAB exhibited the highest lead ion adsorption. Such a high adsorption capacity can be attributed to their mesoporous structure and large specific surface area.Author contributions
Farzad Nasirpouri: conceptualizing and initiating of the project, administration and supervision of the project, funding acquisition, validation of synthesis of nanoparticles, formal analysis of data, writing-original draft; Soheila Fallah: investigation, methodology of synthesis of nanoparticles, examinations and analysis (TEM, SEM, XRD, FTIR, BET, VSM), data; Ghader Ahmadpour: investigation, data curation, visualization (SEM, TEM, XRD, EDX, VSM, FORC diagram method), writing-original draft; Elnaz Moslehifard: investigation, data curation, writing-original draft; Aleksei Yu Samardak: investigation, data curation, visualization and writing (VSM, FORC diagram method); Vadim Yu Samardak: investigation, data curation, writing-original draft; Alexey V. Ognev: investigation, data curation, visualization (TEM); Alexander S. Samardak: validation, formal analysis, visualization, writing (magnetic properties, FORC-diagram analysis).Conflicts of interest
There are no conflicts to declare.Acknowledgements
The Iranian authors are grateful to the Sahand University of Technology (SUT) for their assistance with this project. Iranian Nanotechnology Council award is also acknowledged. The Russian authors are grateful to the Russian Ministry of Science and Higher Education for state support of scientific research conducted under the supervision of leading scientists in Russian institutions of higher education, scientific foundations, and state research centers (Project No. 075-15-2021-607) in performing TEM observations, magnetic properties and FORC-diagram analyses. A. V. O. and A. Yu. S. thank the support within the state task (Project No. FZNS-2023-0012).References
- W. Li and D. Zhao, An overview of the synthesis of ordered mesoporous materials, Chem. Commun., 2013, 49(10), 943–946 RSC.
- S. Varghese, A. Kumawat and C. Ghoroi, Mesoporous silica nanoparticle core-shell matrix (MSN CSM) engineered by green approach for pH triggered release of anticancer drugs, Adv. Powder Technol., 2022, 33(11), 103830 CrossRef CAS.
- Y. Zhang, et al., Mesoporous carbon in biomedicine: Modification strategies and biocompatibility, Carbon, 2023, 118121 CrossRef CAS.
- T. Wu, G. Deng and C. Zhen, Metal oxide mesocrystals and mesoporous single crystals: synthesis, properties and applications in solar energy conversion, J. Mater. Sci. Technol., 2021, 73, 9–22 CrossRef CAS.
- T. Mohammadlou, A. A. Babaluo and A. B. Khoshfetrat, Preparation of high flux mesoporous γ-alumina membranes for whey proteins isolation: Peptizing agent (acetic acid) and binder (PEG) effects, Ceram. Int., 2022, 48(15), 21235–21244 CrossRef CAS.
- Y. Liang, et al., Novel hollow and yolk–shell structured periodic mesoporous polymer nanoparticles, Chem. Commun., 2016, 52(12), 2489–2492 RSC.
- D. Liu, et al., Mesoporous metal–organic frameworks: synthetic strategies and emerging applications, Small, 2018, 14(37), 1801454 CrossRef PubMed.
- M. N. Shaikh, et al., Facile hydrogenation of N-heteroarenes by magnetic nanoparticle-supported sub-nanometric Rh catalysts in aqueous medium, Catal. Sci. Technol., 2018, 8(18), 4709–4717 RSC.
- C. Xu, et al., Dendritic mesoporous nanoparticles: structure, synthesis and properties, Angew. Chem., 2022, 134(12), e202112752 CrossRef.
- S. C. N. Tang and I. M. C. Lo, Magnetic nanoparticles: essential factors for sustainable environmental applications, Water Res., 2013, 47(8), 2613–2632 CrossRef CAS PubMed.
- T. Kimura, Evaporation-induced self-assembly process controlled for obtaining highly ordered mesoporous materials with demanded morphologies, Chem. Rec., 2016, 16(1), 445–457 CrossRef CAS PubMed.
- J. R. Bruckner, et al., Mechanisms and intermediates in the true liquid crystal templating synthesis of mesoporous silica materials, J. Phys. Chem. B, 2021, 125(12), 3197–3207 CrossRef CAS PubMed.
- N. C. King, et al., The preparation by true liquid crystal templating of mesoporous silicates containing nanoparticulate metals, Chem. Commun., 2006,(32), 3411–3413 RSC.
- S. G. Wainwright, et al., True liquid crystal templating of SBA-15 with reduced microporosity, Microporous Mesoporous Mater., 2013, 172, 112–117 CrossRef CAS.
- D. Gu and F. Schüth, Synthesis of non-siliceous mesoporous oxides, Chem. Soc. Rev., 2014, 43(1), 313–344 RSC.
- Z. Fu, et al., Preparation and application of ordered mesoporous metal oxide catalytic materials, Catal. Surv. Asia, 2020, 24, 38–58 CrossRef CAS.
- M. Vallet-Regí, et al., Engineering mesoporous silica nanoparticles for drug delivery: where are we after two decades?, Chem. Soc. Rev., 2022, 51, 5365–5451 RSC.
- X. Sha, et al., The opportunities and challenges of silica nanomaterial for atherosclerosis, Int. J. Nanomed., 2021, 16, 701 CrossRef PubMed.
- M. N. Shaikh, et al., Magnetic nanoparticle-supported ferrocenylphosphine: a reusable catalyst for hydroformylation of alkene and Mizoroki–Heck olefination, RSC Adv., 2016, 6(48), 41687–41695 RSC.
- N. Griffete, et al., Preparation of water-soluble magnetic nanocrystals using aryl diazonium salt chemistry, J. Am. Chem. Soc., 2011, 133(6), 1646–1649 CrossRef CAS PubMed.
- R. Mittal, et al., Removal of Chromium (VI) using Spirulina assisted Synthesized Mesoporous Iron Oxide Nanoparticles, Inorg. Chem. Commun., 2023, 110881 CrossRef CAS.
- S. Rajput, C. U. Pittman Jr and D. Mohan, Magnetic magnetite (Fe3O4) nanoparticle synthesis and applications for lead (Pb2+) and chromium (Cr6+) removal from water, J. Colloid Interface Sci., 2016, 468, 334–346 CrossRef CAS PubMed.
- E. T. Talgatov, et al., Co-precipitation synthesis of mesoporous maghemite for catalysis application, J. Porous Mater., 2020, 27(3), 919–927 CrossRef CAS.
- M. N. Shaikh, et al., Co3O4/nitrogen-doped graphitic carbon/Fe3O4 nanocomposites as reusable catalysts for hydrogenation of quinoline, cinnamaldehyde, and nitroarenes, ACS Appl. Nano Mater., 2021, 4(4), 3508–3518 CrossRef CAS.
- A. N. Kalanthoden, et al., Palladium Nanoparticles Supported on Cellulosic Paper as Multifunctional Catalyst for Coupling and Hydrogenation Reactions, Chem.–Asian J., 2022, 17(3), e202101195 CrossRef CAS PubMed.
- M. Ahmadi, M. H. Niari and B. Kakavandi, Development of maghemite nanoparticles supported on cross-linked chitosan (γ-Fe2O3@CS) as a recoverable mesoporous magnetic composite for effective heavy metals removal, J. Mol. Liq., 2017, 248, 184–196 CrossRef CAS.
- J. Song, H. Kong and J. Jang, Adsorption of heavy metal ions from aqueous solution by polyrhodanine-encapsulated magnetic nanoparticles, J. Colloid Interface Sci., 2011, 359(2), 505–511 CrossRef CAS PubMed.
- D. N. Srivastava, et al., Sonochemical synthesis of mesoporous iron oxide and accounts of its magnetic and catalytic properties, J. Phys. Chem. B, 2002, 106(8), 1878–1883 CrossRef CAS.
- D. T. K. Dung, et al., Preparation and characterization of magnetic nanoparticles with chitosan coating, J. Phys.: Conf. Ser., 2009, 12036 CrossRef.
- R. Zandipak and S. Sobhanardakani, Novel mesoporous Fe3O4/SiO2/CTAB–SiO2 as an effective adsorbent for the removal of amoxicillin and tetracycline from water, Clean Technol. Environ. Policy, 2018, 20(4), 871–885 CrossRef CAS.
- A. Mitra, et al., Soft-templating approach for the synthesis of high surface area and superparamagnetic mesoporous iron oxide materials, Microporous Mesoporous Mater., 2010, 131(1–3), 373–377 CrossRef CAS.
- S. Asuha, et al., Synthesis of mesoporous maghemite with high surface area and its adsorptive properties, Solid State Sci., 2012, 14(7), 833–839 CrossRef CAS.
- P. I. P. Soares, et al., Effects of surfactants on the magnetic properties of iron oxide colloids, J. Colloid Interface Sci., 2014, 419, 46–51 CrossRef CAS PubMed.
- J. A. R. Guivar, et al., Preparation and characterization of cetyltrimethylammonium bromide (CTAB)-stabilized Fe3O4 nanoparticles for electrochemistry detection of citric acid, J. Electroanal. Chem., 2015, 755, 158–166 CrossRef.
- Y. Zhang, et al., Synthesis, structure and electromagnetic properties of mesoporous Fe3O4 aerogels by sol–gel method, Mater. Sci. Eng. B, 2014, 188, 13–19 CrossRef CAS.
- E. Saksornchai, et al., Simple wet-chemical synthesis of superparamagnetic CTAB-modified magnetite nanoparticles using as adsorbents for anionic dye Congo red removal, Mater. Lett., 2018, 213, 138–142 CrossRef CAS.
- X. Wei, et al., Highly water-soluble nanocrystal powders of magnetite and maghemite coated with gluconic acid: Preparation, structure characterization, and surface coordination, J. Colloid Interface Sci., 2011, 354(1), 76–81 CrossRef CAS PubMed.
- J. A. Cuenca, et al., Study of the magnetite to maghemite transition using microwave permittivity and permeability measurements, J. Phys.: Condens. Matter, 2016, 28(10), 106002 CrossRef PubMed.
- D.-M. Smilgies, Scherrer grain-size analysis adapted to grazing-incidence scattering with area detectors, J. Appl. Crystallogr., 2009, 42(6), 1030–1034 CrossRef CAS PubMed.
- L. Chen, et al., Direct synthesis and characterization of mesoporous Fe3O4 through pyrolysis of ferric nitrate-ethylene glycol gel, J. Alloys Compd., 2011, 509(1), L1–L5 CrossRef CAS.
- A. Ruíz-Baltazar, et al., Effect of the surfactant on the growth and oxidation of iron nanoparticles, J. Nanomater., 2015, 16(1), 202 Search PubMed.
- J. Sarkar, et al., An eco-friendly route of γ-Fe2O3 nanoparticles formation and investigation of the mechanical properties of the HPMC-γ-Fe2O3 nanocomposites, Bioproc. Biosyst. Eng., 2017, 40(3), 351–359 CrossRef CAS PubMed.
- O. Riski, et al., The effect of crystallization time and H2O/CTAB ratio in the synthesis of mesoporous alumina from bauxite residue (red mud), Malays. J. Fundam. Appl. Sci., 2019, 15(1), 93–98 CrossRef.
- M. Singh, et al., Vapour phase approach for iron oxide nanoparticle synthesis from solid precursors, J. Solid State Chem., 2013, 200, 150–156 CrossRef CAS.
- S.-W. Cao, et al., Hierarchically nanostructured magnetic hollow spheres of Fe3O4 and γ-Fe2O3: preparation and potential application in drug delivery, J. Phys. Chem. B, 2008, 112(6), 1851–1856 CrossRef CAS PubMed.
- A. Akbarzadeh, et al., Synthesis, characterization and in vitro studies of doxorubicin-loaded magnetic nanoparticles grafted to smart copolymers on A549 lung cancer cell line, J. Nanobiotechnol., 2012, 10, 46 CrossRef CAS PubMed.
- A. S. Poyraz, et al., A general approach to crystalline and monomodal pore size mesoporous materials, Nat. Commun., 2013, 4(1), 1–10 Search PubMed.
- S. Zhang, et al., Preparation and characterization of spindle-like Fe3O4 mesoporous nanoparticles, Nanoscale Res. Lett., 2011, 6(1), 1–9 Search PubMed.
- D. Do Van, et al., A heterogeneous mesoporous silica-supported cyclopentadienyl ruthenium (II) complex catalyst for selective hydrosilylation of 1-hexyne at room temperature, Appl. Catal., A, 2015, 503, 203–208 CrossRef CAS.
- W. Wu, et al., Recent progress on magnetic iron oxide nanoparticles: synthesis, surface functional strategies and biomedical applications, Sci. Technol. Adv. Mater., 2015, 16(2), 23501 CrossRef PubMed.
- A. V. Samrot, et al., A review on synthesis, characterization and potential biological applications of superparamagnetic iron oxide nanoparticles, Current Res. Green Sustain. Chemi., 2021, 4, 100042 CrossRef CAS.
- H. Shokrollahi, A review of the magnetic properties, synthesis methods and applications of maghemite, J. Magn. Magn. Mater., 2017, 426, 74–81 CrossRef CAS.
- S. Dudziak, et al., Pseudo-superparamagnetic behaviour of barium hexaferrite particles, RSC Adv., 2020, 10(32), 18784–18796 RSC.
- A. P. Roberts, C. R. Pike and K. L. Verosub, First-order reversal curve diagrams: A new tool for characterizing the magnetic properties of natural samples, J. Geophys. Res., 2000, 105(B12), 28461–28475 CrossRef.
- I. Ursachi, et al., Magnetic properties of magnetite nanoparticles coated with mesoporous silica by sonochemical method, Mater. Res. Bull., 2011, 46(12), 2468–2473 CrossRef CAS.
- A. R. Yasemian, M. A. Kashi and A. Ramazani, Exploring the effect of Co concentration on magnetic hyperthermia properties of CoxFe3−xO4 nanoparticles, Mater. Res. Express, 2020, 7(1), 16113 CrossRef CAS.
- A. R. Muxworthy and A. P. Roberts, First-Order Reversal Curve (FORC) Diagrams, in Encyclopedia of Geomagnetism and Paleomagnetism, ed. Gubbins, D. and Herrero-Bervera, E., Springer, Dordrecht, 2007, DOI:10.1007/978-1-4020-4423-6_99.
- K. Heydaryan, M. A. Kashi and A. H. Montazer, Tuning specific loss power of CoFe2O4 nanoparticles by changing surfactant concentration in a combined co-precipitation and thermal decomposition method, Ceram. Int., 2022, 48(12), 16967–16976 CrossRef CAS.
- C. Carvallo, D. J. Dunlop and Ö. Özdemir, Experimental comparison of FORC and remanent Preisach diagrams, Geophys. J. Int., 2005, 162, 747–754 CrossRef.
- W. Tang, et al., Superparamagnetic magnesium ferrite nanoadsorbent for effective arsenic (III, V) removal and easy magnetic separation, Water Res., 2013, 47(11), 3624–3634 CrossRef CAS PubMed.
- S. Adeyeye Nafiu, et al., Biogenic synthesis of gold nanoparticles on a green support as a reusable catalyst for the hydrogenation of nitroarene and quinoline, Chem.–Asian J., 2021, 16(14), 1956–1966 CrossRef CAS PubMed.
- U. Klekotka, et al., Magnetic Nanoparticles as Effective Heavy Ion Adsorbers in Natural Samples, Sensors, 2022, 22(9), 3297 CrossRef CAS PubMed.
- D. Chen, et al., Functionalized magnetic Fe3O4 nanoparticles for removal of heavy metal ions from aqueous solutions, E-Polymers, 2016, 16(4), 313–322 CrossRef CAS.
- X. Chen, et al., Synthesis of highly selective magnetic mesoporous adsorbent, J. Phys. Chem. B, 2009, 113(22), 9804–9813 CAS.
- M. Kumari, C. U. Pittman Jr and D. Mohan, Heavy metals [chromium (VI) and lead (II)] removal from water using mesoporous magnetite (Fe3O4) nanospheres, J. Colloid Interface Sci., 2015, 442, 120–132 CrossRef CAS PubMed.
- M. Hua, et al., Heavy metal removal from water/wastewater by nanosized metal oxides: a review, J. Hazard Mater., 2012, 211, 317–331 CrossRef PubMed.
- J. Hu, G. Chen and I. M. C. Lo, Selective removal of heavy metals from industrial wastewater using maghemite nanoparticle: performance and mechanisms, J. Environ. Eng., 2006, 132(7), 709–715 CrossRef CAS.
- Y.-H. Chen and F.-A. Li, Kinetic study on removal of copper (II) using goethite and hematite nano-photocatalysts, J. Colloid Interface Sci., 2010, 347(2), 277–281 CrossRef CAS PubMed.
- H. Zhang, et al., Highly efficient removal of Cr (VI) from wastewater via adsorption with novel magnetic Fe3O4@C@MgAl-layered double-hydroxide, Chin. Chem. Lett., 2015, 26(9), 1137–1143 CrossRef CAS.
- F. Ge, et al., Effective removal of heavy metal ions Cd2+, Zn2+, Pb2+, Cu2+ from aqueous solution by polymer-modified magnetic nanoparticles, J. Hazard Mater., 2012, 211, 366–372 CrossRef PubMed.
- A. Ahmadi, et al., Optimization of heavy metal removal from aqueous solutions by maghemite (γ-Fe2O3) nanoparticles using response surface methodology, J. Geochem. Explor., 2014, 147, 151–158 CrossRef CAS.
- B. Tsedenbal, et al., Removal of Lead Contaminants with γ-Fe2O3 Nanocrystals, Sci. Adv. Mater., 2020, 12(3), 422–426 CrossRef CAS.
- Y.-F. Lin and J.-L. Chen, Synthesis of mesoporous maghemite (γ-Fe2O3) nanostructures with enhanced arsenic removal efficiency, RSC Adv., 2013, 3(35), 15344–15349 RSC.
| This journal is © The Royal Society of Chemistry 2023 |

