 Open Access Article
Creative Commons Attribution 3.0 Unported Licence
Effect of ionic strength on aggregation of nile red and coumarin 30 in aqueous medium: primary kinetic salt effect or salting-out effect?†
Nitin Chattopadhyay * and
Arindam Das
Department of Chemistry, Jadavpur University, Kolkata, 700 032, India. E-mail: nitin.chattopadhyay@yahoo.com
First published on 23rd August 2023
Abstract
The effect of ionic strength on the aggregation of planar dyes like nile red (NR) and coumarin-30 (C30) in aqueous medium has been explored. The dyes are known to undergo dimerization, resulting in fading of their respective colors in the visible range. The present study demonstrates that the fading process is accelerated appreciably upon increasing ionic strength of the solution through addition of soluble salts. Experiments consist of variation of cations (Na+, Mg2+ and Al3+) with different valencies in a series of salts keeping the anion same and a similar set with a variation of anions (NO3−, SO42− and PO43−), keeping the cation same. The question of involvement of ‘primary kinetic salt effect’ or ‘salting-out effect’ for accelerating the aggregation process has also been resolved. Using Na+, K+ and NH4+ ions with the same counterpart NO3−, our experimental results do not show any differential effect, in terms of making the aggregation process faster, and hence rule out any effect of Hofmeister series on the self-aggregation process. The detailed study explicitly establishes that it is the ‘primary kinetic salt effect’ and not the ‘salting-out effect’ that is involved in the present case.
Introduction
Fading of color of a planar dye in water due to aggregation is a well-known phenomenon. We have previously discussed the self-aggregation of dyes like coumarin-30 (C30), coumarin-7 (C7) and nile red (NR) in aqueous medium.1,2 In these reports, apart from pinpointing dimerization through non-covalent interactions to be the self-aggregation process and responsible for the observed color fading, we have further established that the self-aggregation process in aqueous medium can be controlled using cyclodextrins of proper dimension.1,2 Although considering its wide applications in diverse domains3–6 the importance of self-aggregation is now recognized, extension of the field addressing to its mechanistic aspect is still rare. Thus, whether or not the rate constant of the self-aggregation process depends on the ionic strength of aqueous salt solutions following the theories of Brønsted–Bjerrum and Debye–Hückel7 remains an open question requiring a thorough and explicit investigation. With this poor background, in the present work we intended to explore the effect of ionic strength on the aggregation process of the aforementioned dyes. It is evident from the experimental observations that with the addition of salts at low concentrations (where the Debye–Hückel limiting law stands) in aqueous solutions of the dyes, rate constant of the aggregation process increases significantly. This observation, however, invites two plausible and competing theories, namely, ‘primary kinetic salt effect’ and/or ‘salting-out effect’ for its explanation. Since none of the reacting species (NR and C30) are weak electrolytes, we did not consider a ‘secondary kinetic salt effect’. In this work we have successfully endeavored to resolve the issue, and that is the essence of our present investigation.While the ‘primary kinetic salt effect’ is basically the effect of electrolyte concentration on the activity coefficients and thereby on the rate of a reaction, ‘salting-out’ is a phenomenon when the solubility of a nonelectrolyte substance in water decreases with increasing salt concentration in the solution.8,9 Contrary to the ‘salting-out’, in ‘salting-in’ the solubility of a nonelectrolyte in water increases with increasing salt concentration. The dye molecules under study being nonelectrolytes, logically one may invoke either of the effects depending on the experimental situation. Since the dye solutions are extremely dilute (in the range of 10−5 M) and we see only accelerated fading of the color of either of NR or C30 with the addition of dilute solutions of salts, we can easily rule out the possibility of ‘salting-in’. Nevertheless, we cannot rule out the possible involvement of ‘salting-out’ effect in a straight-forward manner. Anyway, since we are working only with solutions of low ionic strength, feasibility of it seems to be poor since ‘salting-out’ is significant only in a solution of high salt concentration (≥10−1 M). Through a series of experiments, the present report establishes that it is the ‘primary kinetic salt effect’ and not the ‘salting-out’ effect that is operative behind the faster fading of NR and C30 dyes in aqueous medium upon addition of dilute (∼10−5 M) solutions of salts.
Effects of ionic activity are best understood in dilute solutions because coulombic interactions between ions dominate in dilute solutions. For this reason we have studied only in dilute solutions where salt concentrations are restricted in the range of 10−5 M. However, even at these low concentrations of added salts there is a possibility of a change of pH (considering salt hydrolysis, wherever applicable). Keeping this factor in mind, from our studied systems C7, C30 and NR, we have prudently chosen the latter two dyes (Scheme 1) as probes for the present study, leaving the first one (C7). Coumarin 7 (C7) possesses a dissociable hydrogen, which is sensitive to the pH of the medium, while for the chosen two probes this is not the case. Hence pH factor is not supposed to play a significant role in the present study. With the passage of time NR and C30 exhibit fading of color (reduction in their respective monomeric absorbance) signifying aggregation in aqueous medium, as reported before.1,2 From a preliminary experiment we also made an observation that with the addition of NaCl in solution, C7 and C30 dyes would prefer to form H-dimer to overcome the effect of ionic strength compared to the situation in pure water.1 Through the present work, we report a vivid pertaining study on the aspect of effect of ionic strength using several water soluble salts adopting simple absorption and fluorescence techniques. We have selected salts like NaNO3, Mg(NO3)2, Al(NO3)3, Na2SO4 and Na3PO4 to get two series where variation of cationic and anionic charge remains at +1, +2, +3 and −1, −2, −3 (monovalent → divalent → trivalent) respectively keeping the other ion same. Besides, we have also used another series, namely NaNO3, KNO3 and NH4NO3, where cation is varied keeping the charge (+1) and the anion (NO3−) same to check the role of Hofmeister series and therefrom the involvement of salting-out effect.
Experimental section
Materials
NR, C30 and all the anhydrous salts (purity min. 99.5%) used were purchased from TCI, India while spectroscopic grade methanol was purchased from Sigma-Aldrich (USA). All the chemicals were of good quality and were used without further purification. Milli-Q (Millipore) water was used throughout the experiment for performing the studies in aqueous medium.Methods
A Shimadzu UV-2450 absorption spectrophotometer (Shimadzu Corporation, Japan) was used to carry out absorption experiments. Fluorometric measurements were performed in a Horiba Jobin Yvon Fluoromax-4 spectrofluorometer.Concentrated stock solutions of NR and C30 dyes were prepared separately in methanol as were done earlier.1,2 Small amount of stock solution of a dye was added to a cuvette with adequate amount of millipore water. It was then homogenised to perform the experiments. Volume of methanol in the final experimental solutions was kept below 2%.
For absorption and fluorometric measurements in the presence of salts, stock solutions of high concentrations (in the range of 10−2 M) of the desired salts were made. Using micropipette, calculated volumes of the salt solutions were added as per requirement directly to 3 mL of freshly prepared dye solutions taken in a fluorescence cuvette to make the salt concentrations in the range of 10−5 M. Absorption and fluorescence spectra were recorded as and when required. For the kinetic measurements absorbance or fluoresce intensity of the dye solution in the absence or presence of added salts were taken at corresponding λmax for absorption and fluorescence spectra.
Results and discussion
Although a text book topic, for the benefit of the general researchers and new entrants in this domain we would like to make a brief discussion on the basics relevant to the present study. Ionic strength of a solution (I) is a function of concentration of all the ions present in a solution, i.e.,
 | (1) |
 | (2) |
 | (3) |
 | (4) |
 | (5) |
Eqn (5) is Brønsted–Bjerrum equation, represented in logarithmic form. Eqn (5) implies that a plot of  versus
  should be linear passing through origin when primary kinetic salt effect is operative in a reacting system. The nature of slope is dictated by the product of charges on the species involved in the rate-limiting step. If the rate-limiting step involves species of like charges, a positive slope is expected. When the reaction is between opposite charges, it results in a negative slope.14,15 If one of the reactants is a neutral molecule (ZAZB = 0), the rate constant is expected to be independent of ionic strength.
On the other hand, the relative effectiveness of salting-out is usually calculated by the use of Setschenow equation16 (eqn (6)) in which S0 is the solubility of the solute in pure water, S is the solubility in the presence of salt, KS is the salting-out or Setschenow constant, and C is the molar concentration of the salt. KS will be positive when salting-out occurs and negative when salting-in occurs.17,18
 | (6) |
Using Debye–Hückel equation one can arrive at the following expression linking between solubility of a solute in aqueous medium and ionic strength of the solution in the presence of a salt at high ionic strength:13,19,20
 | (7) |
 , we arrive at the following eqn (8);
 | (8) |
Eqn (8) implies that plot of  versus
  should be linear with a negative slope K/ and an intercept −A|ZAZB|.
We know that salting-out effect is observed at considerably high (≥10−1 M) salt concentrations.11 At higher salt concentrations, specific ion effects are also reported.21–23 The extent of specific ion effect depends on the following characteristics of the nonelectrolyte or the dye and it increases with (1) higher polarizability, (2) larger molecular size/volume and (3) lower polarity.17 The high valence electrical charges and small radii of ions are effective for salting-out according to Hofmeister series which is a foundational basis for selecting the correct salt for suitable salting-out effect.24,25 Generally high ionic charge in aqueous solution, because of its large Gibbs free energy of hydration, favor salting-out process.26 The reason behind salting-out is the combined effect of electronic repulsion and enhancement of the hydrophobic effect for dissolved cations or anions. We know that during nonelectrolyte solute/dye aggregation, increasing hydrophobic effect in pure water at the highly ordered solute–water interface diminishes the entropy. Likely, in the presence of salts of high charge density, similar surface associates are more ordered, suffering a large entropy reduction. This drop in entropy is overcome by the increase in entropy when large number of water molecules get free while de-solvating the solute. Therefore, highly water-solvated states of dyes are disfavored, instigating them to aggregate and then to leave the aqueous phase.27,28
Absorption study
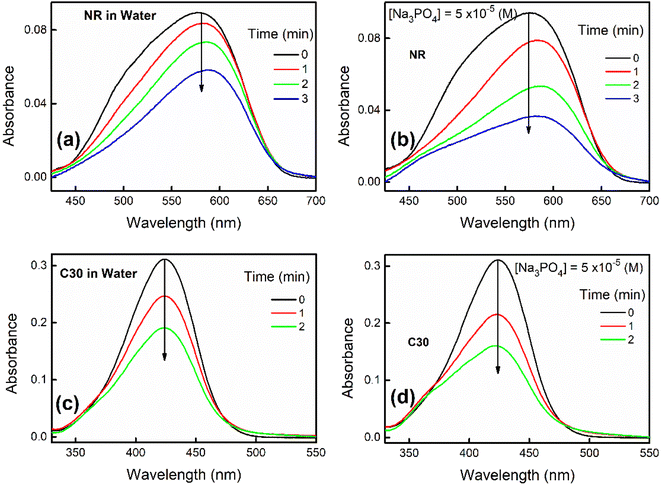
With passage of time NR and C30 display a decrease in their respective monomeric absorbance suggesting formation of H-dimer in aqueous medium as described in our previous contributions.1,2 Now, addition of a particular salt like Na3PO4 (10−5 M) results in a drastic enhancement in the rate of decrease in the absorbance as shown in Fig. 1.We have also visibly observed the fading of color of NR and C30 in presence of different salts in water which are shown in Fig. S1–S4 in ESI.† To make a better perception, only selected sets (Fig. S1–S4†) are presented for color fading of aqueous solutions of NR (and C30) in the absence and presence of salts like Al(NO3)3 and Na3PO4, where the effect of ionic strength is found to be maximum, as expected. Thus, increase in ionic strength of solution is responsible for a faster decrease of absorbance or color fading of these dyes in aqueous medium.
Fluorescence study
We have also looked at the fluorescence and fluorescence excitation spectra at different times to investigate self-association of these dyes in aqueous solutions and the effect of added salts on the rate of this process. Observation of a substantial decrease in the fluorescence intensities of NR and C30 with time in the presence of salt solutions compared to those in an aqueous medium (Fig. S5 in the ESI†), parallel to the absorption data, is attributed to self-aggregation of the dyes. Fluorescence excitation spectra of NR are resolved to get two very different spectra corresponding to the monomer and H-dimer species with λmax 595 nm and 510 nm respectively. This is in gross agreement with the absorption results (being 580 nm and 475 nm respectively). Fluorescence excitation spectra of C30 in water are also resolved into two, resulting in λmax 420 nm corresponding to the monomer and 370 nm for the dimer, in concurrence with the results obtained from resolution of the relevant absorption spectra (430 nm and 370 nm respectively). A set of such pictures for C30 are provided in Fig. S6 in the ESI,† as a sample, to demonstrate that the rate of aggregation process of the dye increases in the presence of salts. From these data it is clear that for both the dyes in aqueous solution with progress of time contribution of the monomer decreases and that of the dimer increases as observed earlier.1,2 At a fixed time, formation of the dimer follows the order: water < Na+ < Mg2+ < Al3+ and water < NO3−< SO42− < PO43− for salts with a common anion and a common cation respectively.Kinetic studies from absorption and fluorescence measurements
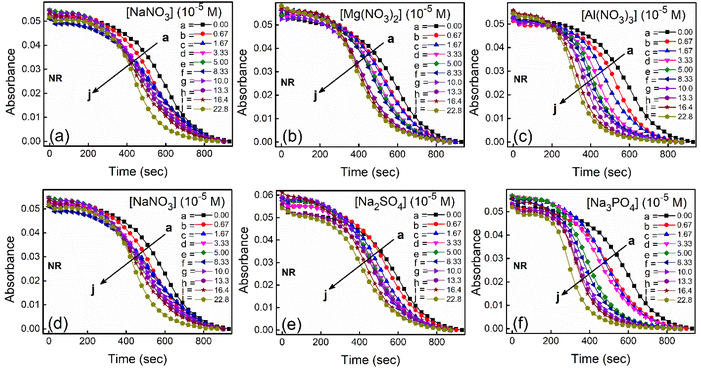
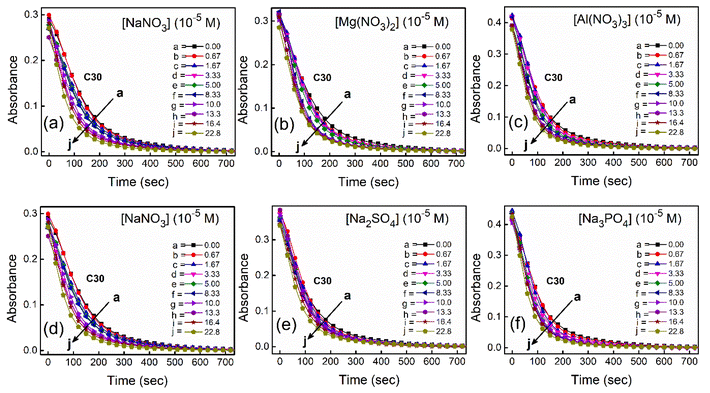
To study the kinetics of aggregation of NR and C30 in aqueous medium in the absence and presence of different salts from absorption measurements, absorbance values of the monomer of the dyes (at 580 nm for NR and 435 nm for C30) were monitored against time at a fixed dye concentration. A similar and parallel study was also performed monitoring the fluorescence intensities at the respective emission maxima of the dyes (660 nm and 500 nm for NR and C30 respectively) in the presence of different salts.With increasing time, absorbance values of the dyes were found to decrease in water as well as in aqueous salt solutions. In the presence of salt solutions (∼10−5 M) the absorbance decays were faster compared to the decays in water for both the dyes. With increasing salt concentration the absorbance decays were gradually faster as shown in Fig. 2 for NR and in Fig. 3 for C30. As we moved from Na+ → Mg2+ → Al3+ the decays became progressively faster at a particular concentration of salt. Similarly, as we moved from NO−3 → SO2−4 → PO3−4 the decays were progressively faster. This observation was evident from the faster visible decolorization of these dyes in aqueous salt solutions as we moved from Na+ → Mg2+ → Al3+ and NO3− → SO42− → PO43−.
Half-life (t1/2) values were determined from the decays of both the dyes in different solutions taking the absorbance values at the respective λmax. Since for a second order reaction t1/2 depends on the initial concentration of the reactant, for a relativistic study for our purpose, we determined t1/2 s keeping the dye concentration fixed for all the solutions. Hence at a fixed reactant (dye) concentration  turns out to be
  , i.e.,
  ; where (t1/2)0 and (t1/2) denote the half-life of the dye molecule in solution in the absence and in the presence of salt respectively. Now eqn (5) becomes
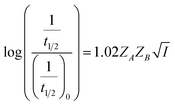 | (9) |
 | (10) |
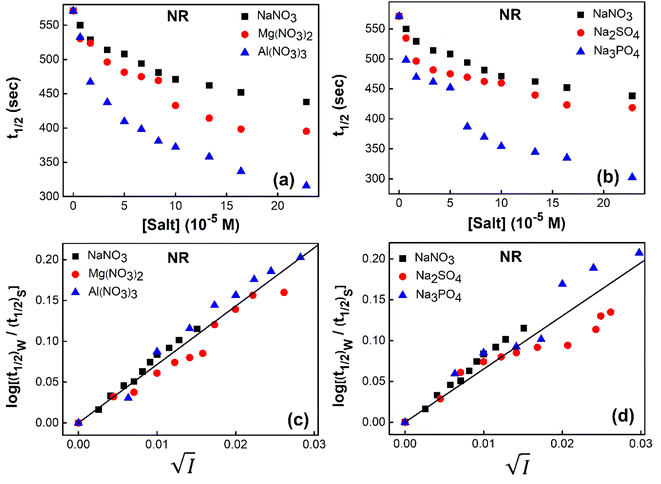 | ||
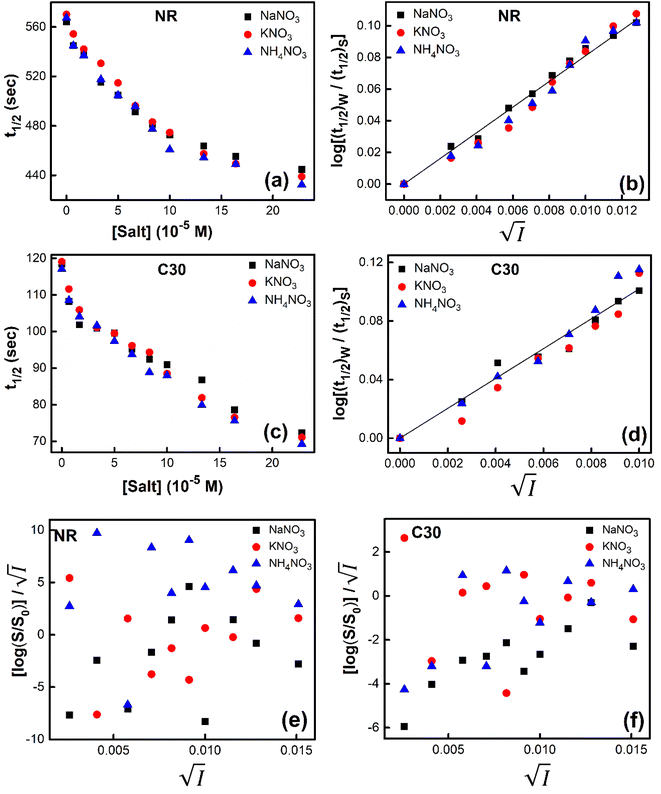
Fig. 4 Variation of half-life (t1/2) vs. salt concentration for NR with a variation of (a) cation and (b) anion; (c) and (d) gives plots of log(k/k0) vs.  for NR, where k/k0 = (t1/2)W/(t1/2)S. for NR, where k/k0 = (t1/2)W/(t1/2)S. | ||
Now, plots of  versus
  (eqn (10)) for NR are presented in Fig. 4(c) and (d); former corresponding to cation variation (Na+ → Mg2+ → Al3+) while the latter to anion variation (NO3− → SO42− → PO43−). Although scattered, the plots are found to follow linearity (passing through origin) implying that Brønsted–Bjerrum equation (eqn (5)) is obeyed for both the series of salts. Similar plots for C30 are depicted in Fig. S7(c) and (d) in the ESI.† For a wider perception we have plotted
  versus
  for NR and C30 with all the five salts NaNO3, Mg(NO3)2, Al(NO3)3, Na2SO4 and Na3PO4 together revealing that the entire data set follows linearity passing through the origin (Fig. 5(a) and (c) respectively).
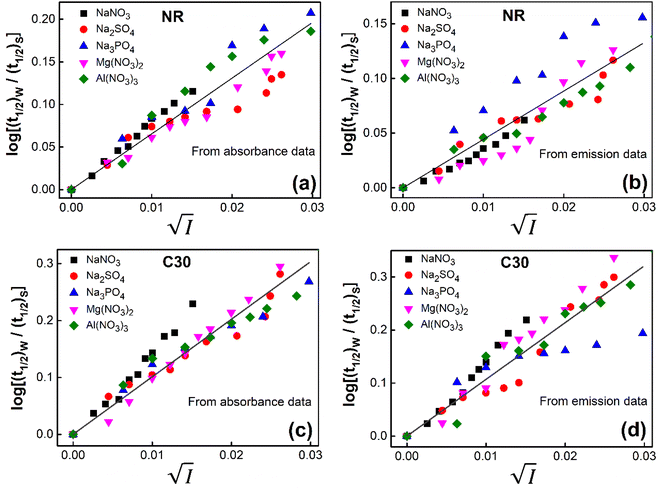 | ||
Fig. 5 Plot of log(k/k0) vs.  of NR in water with variation of salts from (a) absorbance data and (b) emission data, where k/k0=(t1/2)w/(t1/2)S. (c) and (d) represent similar plots for C30. of NR in water with variation of salts from (a) absorbance data and (b) emission data, where k/k0=(t1/2)w/(t1/2)S. (c) and (d) represent similar plots for C30. | ||
To validate reliability of the absorption based kinetic data, fluorescence decays of the probes were also followed. The results of the fluorometric study are presented pictorially in Fig. S8 and S9 in the ESI† for NR and C30 respectively.  vs.
vs.  plots have been made independently from fluorescence kinetic data following the similar procedure as adopted with absorption based kinetic study. These are presented in Fig. 5(b) and (d), together with the corresponding plots developed from the absorption kinetic data. It is evident from these figures that within experimental limits the absorption and fluorescence kinetic data sets corroborate one another.
Thus, all our experimental results, based on absorption and fluorescence kinetic data, conform to Brønsted–Bjerrum theory (eqn (5)) and thereby substantiate the involvement of primary kinetic salt effect in the present study ratifying a faster rate of aggregation of NR and C30 with an increase in salt concentration in the dye solutions in aqueous medium.
Since we were restricted to addition of only very dilute solutions of salts (∼10−5 M) to the dye solutions, involvement of salting-out effect seems unrealistic. However to eliminate its possible involvement completely, we have followed two approaches.
Firstly, we intended to plot  versus
  to see whether eqn (8), relevant for the salting-out effect, is followed or not. For the purpose, we have taken the following strategy. Accepting validity of Beer's law, meaning concentration of a soluble entity is proportional to its absorbance (optical path length being the same, here 1 cm), we have taken ratio of the absorbance value of a fixed concentration of a dye (monomer) in water to the same in the presence of a known concentration of the added salt as S0/S, ratio of the respective concentrations. Both the absorbance values were taken after attainment of equilibrium (for both NR and C30, 15.0 minutes after making the solution), when absorbance attained a steady value in each case. To monitor the change in absorbance of the monomer species of an individual dye in the absence and presence of the added salt, we chose wavelengths corresponding to the maximum (λmax) in the respective absorption spectrum, namely 580 nm and 435 nm for NR and C30 respectively. Then
  was plotted against
  for all individual salts added (Fig. 6). The figure depicts no definite pattern followed by the different salts, revealing clearly that eqn (8) is not obeyed for the present systems. This experiment, therefore, rules out involvement of salting-out effect for the cases studied.
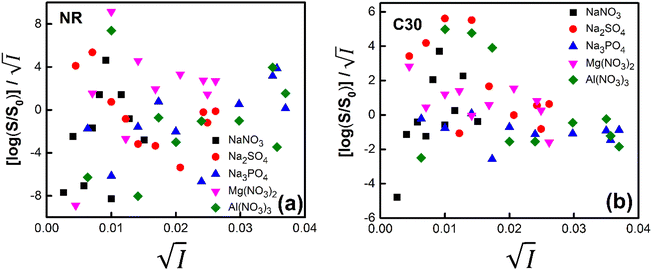 | ||
Fig. 6 Plot of  vs. vs.  for (a) NR and (b) C30 in water with variation of salts from absorption measurements. for (a) NR and (b) C30 in water with variation of salts from absorption measurements. | ||
Secondly, we tried to check the validity of Hofmeister series,24 which is a signature of the involvement of salting-out effect in the process under consideration. For the purpose, we chose monovalent cations like Na+, K+ and NH+4 with the monovalent and same anion (NO3−) using NaNO3, KNO3 and NH4NO3 salts. We studied the problem from two angles. From kinetic point of view, variation of t1/2 with a change of concentration of these salts added individually in aqueous solutions of NR and C30 respectively were noted (Fig. 7).
The figure reveals that at a particular concentration all these salts (both the constituent ions being monovalent) affect the aggregation process to the same extent. It was further clarified from the plot of  against
  taking the absorption kinetic data of the two dyes with the added salts at various concentrations (Fig. 7). The figure reveals that the experimental data points with all the three salts could be fitted on a single straight line passing through the origin revealing that there is hardly any differential effect of Na+, K+ and NH+4 ions in terms of accelerating the color fading of the dyes. By the way, an apparent biexponential nature observed in Fig. 7(c) is presumably associated with the inherent experimental error. There is no logic for the pattern observed in Fig. 7(c) to be different from that in Fig. 7(a). This, of course, does not affect anyway the overall outcome of this experiment as evident from Fig. 7(b) and (d). Following the strategy as stated in the previous paragraph, we have also plotted
  against
  for gradual addition of these three salts (Fig. 7(e) and (f)). Here also we could not notice any differential effect nor there was a pattern of the data points as one expects from eqn (8), had there been salting-out effect operative. Both these experiments raise question on the applicability of Hofmeister series for the present problem of self-aggregation of NR and C30. Involvement of salting-out effect was therefore ruled out for the present systems leaving no room other than to accept the exclusive involvement of primary kinetic salt effect to accelerate the aggregation process of the two studied dyes leading to the color fading in the presence of added salts.
Thus, all our experimental results portray primary kinetic salt effect to be responsible for the faster color fading of aqueous solutions of the studied dyes (NR and C30) in the presence of salts and eliminate involvement of salting-out effect during the process. It is pertinent to mention here that the present study opens up an interesting issue to think on. Apparently, for the present cases both the molecules of NR (or C30), taking part in the dimerization reaction, are uncharged; i.e., ZA and ZB are both zero. As has been discussed above, for non-ionic reactants slope of a plot corresponding to eqn (5) is expected to be zero (ZA and/or ZB being 0). In contrast, our absorption and emission based experimental results (Fig. 5) reveal clear positive slopes, indicating that somehow there is development of partial charges on the reacting species during reaction. Although our reactants (monomers of NR or C30) appear non-ionic, they are dipolar in nature. Keeping in mind self-aggregation of the studied dyes (monomer → dimer) as the reaction, we feel that this dipolar nature of the individual dyes plays a crucial role in the process. Further, from a qualitative point of view, a higher slope of plots of  vs.
vs.  in case of C30 as compared to that for NR (evident from a comparative glance on Fig. 5, i.e., ratio of slopes for C30 and NR is 1
![[thin space (1/6-em)]](https://www.rsc.org/images/entities/char_2009.gif) :
:![[thin space (1/6-em)]](https://www.rsc.org/images/entities/char_2009.gif) 0.7 from absorption measurements, 1
0.7 from absorption measurements, 1![[thin space (1/6-em)]](https://www.rsc.org/images/entities/char_2009.gif) :
:![[thin space (1/6-em)]](https://www.rsc.org/images/entities/char_2009.gif) 0.45 from emission measurements and 1
0.45 from emission measurements and 1![[thin space (1/6-em)]](https://www.rsc.org/images/entities/char_2009.gif) :
:![[thin space (1/6-em)]](https://www.rsc.org/images/entities/char_2009.gif) 0.57 from the average of slopes obtained from the two measurements) gets a qualitative support from a higher value of the calculated dipole moment of C30 (12.1807 D) as to that of NR (9.9851 D) obtained from the respective optimized structures. A more detail study on various molecular systems is, however, invited in this line to really resolve the issue.
0.57 from the average of slopes obtained from the two measurements) gets a qualitative support from a higher value of the calculated dipole moment of C30 (12.1807 D) as to that of NR (9.9851 D) obtained from the respective optimized structures. A more detail study on various molecular systems is, however, invited in this line to really resolve the issue.
Conclusions
Effect of ionic strength of solution on the self-aggregation (dimerization) process of two dyes, NR and C30, leading to color fading of their aqueous solutions, has been studied in detail through simple absorption and fluorescence based measurements. For the purpose, dilute solutions of various salts were used to make series like Na+, Mg2+ and Al3+ as well as NO3−, SO42− and PO43− (in the former case character of the cation and in the latter case that of the anion varies keeping the counter ion same in each series). The detailed study revealed that Brønsted–Bjerrum equation is obeyed by salts of both the series signifying primary kinetic salt effect to be operative. Experimental data points with all the different salts could be fitted on the same straight line. On the other hand, possible involvement of salting-out effect was ruled out from absorption and fluorescence based data as well as from the absence of any differential effect of Na+, K+ and NH4+ on the process, implying that Hofmeister series, which is a signature of salting-out effect, is not operative during the aggregation process of these dye systems. All the experimental observations portray exclusive involvement of primary kinetic salt effect on the self-aggregation process of both the studied dyes ruling out any role of salting-out effect.Author contributions
NC conceptualized and supervised the project and analyzed the experimental data. AD performed all the experiments.Conflicts of interest
The authors declare no conflict of interest.Acknowledgements
Financial support from the Council of Scientific and Industrial Research, Government of India [Project 01(3065)/21/EMR-II] is gratefully acknowledged. A.D. thanks U.G.C. for awarding Dr D. S. Kothari Postdoctoral Fellowship [F.4-2/2006 (BSR)/CH/19-20/0101].References
- A. Das, S. Das, A. Biswas and N. Chattopadhyay, J. Phys. Chem. B, 2021, 125, 13482–13493 CrossRef CAS PubMed.
- A. Ray, S. Das and N. Chattopadhyay, ACS Omega, 2019, 4, 15–24 CrossRef CAS PubMed.
- S. Sengupta and F. Würthner, Acc. Chem. Res., 2013, 46, 2498–2512 CrossRef CAS PubMed.
- K. Li, X. Duan, Z. Jiang, D. Ding, Y. Chen, G. -Q. Zhang and Z. Liu, Nat. Commun., 2021, 12, 1–9 CrossRef PubMed.
- P. Verma and H. Pal, J. Phys. Chem. A, 2014, 118, 6950–6964 CrossRef CAS PubMed.
- F. Xu, T. T. Testoff, L. Wang and X. Zhou, Molecules, 2020, 25, 4478 CrossRef CAS PubMed.
- M. Fedoseeva, P. Fita, A. Punzi and E. Vauthey, J. Phys. Chem. C, 2010, 114, 13774–13781 CrossRef CAS.
- M. Randall and C. F. Failey, Chem. Rev., 1927, 4, 285–290 CrossRef CAS.
- P. M. Gross, Chem. Rev., 1933, 13, 91–101 CrossRef CAS.
- C. Zhang, Y. Qu, X. Zhao and Q. Zhou, Clean: Soil, Air, Water, 2015, 43, 223–228 CAS.
- P. Atkins, P. W. Atkins and J. C. de Paula, Atkins' Physical Chemistry, Oxford University Press, 2014 Search PubMed.
- S. Logan, Trans. Faraday Soc., 1967, 63, 3004–3008 RSC.
- P. Hofer, U. P. Fringeli and W. H. Hopff, Biochem, 1984, 23, 2730–2734 CrossRef CAS PubMed.
- S. Jonnalagadda and N. Gollapalli, J. Chem. Educ., 2000, 77, 506–509 CrossRef CAS.
- G. Alibrandi, S. Coppolino, S. D'Aliberti, P. Ficarra, N. Micali and A. Villari, J. Pharm. Sci., 2003, 92, 1730–1733 CrossRef CAS PubMed.
- J. Setschenow, Z. Phys. Chem., 1889, 4, 117–125 CrossRef.
- A. M. Hyde, S. L. Zultanski, J. H. Waldman, Y.-L. Zhong, M. Shevlin and F. Peng, Org. Process Res. Dev., 2017, 21, 1355–1370 CrossRef CAS.
- V. Sergeeva, Russ. Chem. Rev., 1965, 34, 309–318 CrossRef.
- M. Brunet, OER by Discipline Guide, University of Ottawa Library, 2010, v. 1.0–June 2021 Search PubMed.
- C. R. Dennis, I. Potgieter and S. Basson, React. Kinet., Mech. Catal., 2010, 99, 63–68 CAS.
- R. Leberman, FEBS Lett., 1991, 284, 293–294 CrossRef CAS PubMed.
- D. J. Tobias and J. C. Hemminger, Science, 2008, 319, 1197–1198 CrossRef CAS PubMed.
- M. Görgényi, J. Dewulf, H. Van Langenhove and K. Héberger, Chemosphere, 2006, 65, 802–810 CrossRef PubMed.
- F. Hofmeister, Arch. Exp. Path. Pharm., 1888, 24, 247–260 CrossRef.
- W. Kunz, J. Henle and B. W. Ninham, Curr. Opin. Colloid Interface Sci., 2004, 9, 19–37 CrossRef CAS.
- H. S. Wu and Y. J. Wang, Ind. Eng. Chem. Res., 2012, 51, 10930–10935 CrossRef CAS.
- P. K. Grover and R. L. Ryall, Chem. Rev., 2005, 105, 1–10 CrossRef CAS PubMed.
- G. Graziano, Chem. Phys. Lett., 2010, 491, 54–58 CrossRef CAS.
Footnote |
| † Electronic supplementary information (ESI) available. See DOI: https://doi.org/10.1039/d3ra03829g |
| This journal is © The Royal Society of Chemistry 2023 |


