 Open Access Article
Direct laser writing of hydrophobic and hydrophilic valves in the same material applied to centrifugal microfluidics†
Matheus J. T. Vargas *abc,
Michel K. Nieuwoudtbc,
Rakesh Arulbe,
David E. Williams
 ac and
M. Cather Simpsonabd
aOrbis Diagnostics Ltd, 14 West Street, Eden Terrace, Auckland, 1010, New Zealand. E-mail: matheus@orbisdiagnostics.com; david.williams@auckland.ac.nz; c.simpson@auckland.ac.nz
bPhoton Factory, University of Auckland, 38 Princes St, Auckland, 1010, New Zealand
cSchool of Chemical Sciences, University of Auckland, Bldg. 302, 23 Symonds St, Auckland 1010, New Zealand
dDepartment of Physics, University of Auckland, 38 Princes Street, Auckland, 1010, New Zealand
eCavendish Laboratory, Department of Physics, University of Cambridge, JJ Thompson Avenue Cambridge, CB3 0HE, UK
First published on 25th July 2023
Abstract
In this study, we utilize nanosecond and femtosecond direct laser writing for the generation of hydrophobic and hydrophilic microfluidic valves on a centrifugal microfluidic disk made of polycarbonate, without the need for wet-chemistry. Application of a femtosecond (fs) laser at 800 nm resulted in an increased contact angle, from ∼80° to ∼160°, thereby inducing the formation of a hydrophobic surface. In contrast, employing a nanosecond (ns) laser at 248 nm led to the formation of superhydrophilic surfaces. Morphological studies identified the enhancement in the surface roughness for the hydrophobic surfaces and the creation of smooth patterns for the hydrophilic surfaces. Chemical modifications in the laser-ablated samples were confirmed via Fourier-transform infrared spectroscopy (FTIR) and X-ray photoelectron spectroscopy (XPS) analysis. These spectroscopic examinations revealed an increase of hydrophilic chemical groups on both surfaces, with a more pronounced increase on the nanosecond laser-modified surface. Furthermore, these surfaces were used as a case study for centrifugal microfluidic valves. These modified surfaces demonstrated peculiar pressure responses. Specifically, the hydrophobic valves necessitated a 29% increase in pressure for droplet passage through a microchannel. On the other hand, the superhydrophilic valves exhibited enhanced wettability, decreasing the pressure requirement for fluid flow through the modified area by 39%. However, similarly to the hydrophobic valves, the fluid exiting the hydrophilic valve area required an increased pressure. Overall, our study shows the potential for tailoring valve functionality in microfluidic systems through precise surface modifications using laser technology.
Introduction
In the late 1990s, polymers supplanted silicon and glass as the material of choice for the fabrication of micro (μ) total analysis systems (μTAS) and lab-on-a-chip devices.1 Thermoplastic polymers enabled research facilities to rapidly prototype devices and transfer the technology to industrial applications.2,3 These polymeric materials are densely crossed-linked, mouldable, optically clear, durable, have low raw material costs and well-established manufacturing methods, making them attractive for mass production.4,5 One of the main thermoplastics used for microfabrication is poly (bisphenol A carbonate), also known as polycarbonate (PC).6The selection of an appropriate polymer substrate for a microfluidic device relies heavily on its physicochemical characteristics. Some of PC's characteristics, high chemical stability, poor surface absorbability and adhesion to other films and coatings (great for bioassay microchips), make this polymer a candidate to be integrated into μTAS devices.7–10 However, these characteristics carry some challenges when dealing with microfluidics, where many times it is necessary to fine tune its properties for better fluidic control. Several studies have tried to tune the PC's dielectric properties,11 create surface modifications (and wettability)7 on devices, study the effect of chemical modification using laser ablation12 and even ways to construct micropatterning13 on surfaces. These current strategies to modify bare polymer surfaces mainly include chemical14 and plasma15 treatments, but direct laser surface modification is emerging as a more flexible technique due to its ability to perform surface patterning at high precision.
In order to reduce chemical waste and achieve greater reproducibility and precision in surface modifications for the creation of hydrophobic surfaces, researchers have explored the use of femtosecond pulsed laser irradiation. This technique has been seen in various applications, including micro hole drilling, micro patterning, and lens arrays16–18 as well as on polycarbonate surfaces.19 Furthermore, the use of different lasers, such as UV lasers applied on polymers, to create hydrophilic surfaces are quite scarce as most studies focus on chemical treatments or plasma treatments that lead to less control of the modified surface area.20–22 Currently, there are no detailed studies on directly application of femtosecond nor nanosecond laser modifications to thermoplastic microfluidic devices. Especially in systems that do not use actuated pumps to control fluids, (e.g. paper microfluidics,23 centrifugal microfluidics,24,25 suspended microfluidics,26 and digital microfluidics27), hydrophilic and hydrophobic circuit sections become elegant tools to control fluid flow via capillary forces, adhesion, and hydrophobicity.
In this study, we present techniques to modify the surface properties of polycarbonate, specifically Makrofol DE 1-1, in specific regions of a centrifugal microfluidic device. By employing femtosecond and nanosecond laser pulses at different wavelengths, we can precisely transform designated areas into either hydrophobic or hydrophilic surfaces. This capability allows for fine-tuning the fluid flow within different sections of the same device, all using the same material.
Nanosecond and femtosecond surface modification
Nanosecond pulses created by an excimer laser at UV wavelengths have been widely used to treat polymers. Makrofol PC, polymethylmethacrylate (PMMA), polystyrene (PS), polyethylene terephthalate (PET) display high absorbance at this wavelength.28–30 When exposed to UV radiation, these materials undergo linear absorption, leading to energy deposition and subsequent heat generation as a form of energy relaxation.31 The outcomes for this process are the thermal, thermo-oxidative, or mechanical breakdown, leading to vaporization of the polymer into oligomeric fragments or larger particles of the polymer and filler.31 One of the main chemical groups in polycarbonate (Makrofol® DE 1-1) is the reactive carbonyl group, which can induce the photodegradation of the polymer when irradiated with ultraviolet radiation.32 Nanosecond pulsed excimer lasers operating in the UV range have the ability to induce chemical modifications in polycarbonate (PC) substrates. These modifications result in the introduction of hydrophilic functional groups, including C–OH and COOH groups, along with the formation of inter-chain bonds.28 Moreover, the laser irradiation can trigger photo-Fries rearrangement, leading to the generation of hydroxyl groups on the aromatic rings of the polymer.33 These structural changes contribute to the enhanced hydrophilicity of the treated PC surfaces.28,33Femtosecond laser ablation of polymeric materials at 800 nm (1.55 eV) occurs through a different mechanism compared to the longer-pulse nanosecond laser. With femtosecond irradiation at 800 nm, the near-infrared photons are nonlinearly absorbed through multiphoton absorption.34 This type of absorption at femtosecond time scale generates energy that is sufficient to enable laser processing at wavelengths at which the material is non-absorbent or transparent. For example, near-infrared wavelengths can be used to ablate polymers that are non-absorbent at the used laser wavelength.35 Multiphoton absorption is thought to be followed by avalanche mechanisms, leading to photodegradation of materials.36 Femtosecond pulsed lasers thus can induce non-thermal37 structural and morphological changes in the ablated material, avoiding mostly of the material oxidation when ablated in open air. In addition, the use of femtosecond lasers can induce the formation of periodic structures or high roughness in polymers, which are well-known to generate efficient hydrophobic surfaces.38–40
Centrifugal microfluidics, hydrophilic and hydrophobic effects
The ability to tune the wettability of surfaces is a useful tool for precise fluid control in centrifugal microfluidic disks. Hydrophobic valves, usually made with carbon-based ink coating, have been used to control the burst speed (rotational speed at which the fluid opens the valve and move to another reservoir) or to stop capillary action and therefore allow better sample metering and avoidance of cross contamination between chambers in microfluidic devices.41,42 In the case of hydrophilic surfaces, an increased capillary force can be used to displace fluid back to the center of microfluidic disks allowing for the use of timed valves and siphons.43,44 This work aims to use these laser surface modifications to manipulate the burst frequency and pressure in channels.The burst frequency in centrifugal microfluidics is dependent on the pressure the fluid exerts in the channel. The main factors controlling this pressure when a centrifugal disk is in stationary position are the dimensions of the channels, given by width (w) and height (h), the contact angles on the walls corresponding to the width and height, respectively, θw related to the top and bottom of the channels and θh corresponding to the side walls of the channel, and the surface tension of the liquid (σ). eqn (1) gives the pressure change across the meniscus.
 | (1) |
Since we are working with a centrifugal microfluidic device for this study, we can use an equation to estimate the pressure (Pω) related to the centrifugal force (Fc) during disk rotation:
| Fc = ρω2R | (2) |
 | (3) |
![[R with combining macron]](https://www.rsc.org/images/entities/i_char_0052_0304.gif) is their average. This equation has been used before by different groups to calculate the burst pressure as an approximation, as it accounts only for uniform flow velocity.45–47
is their average. This equation has been used before by different groups to calculate the burst pressure as an approximation, as it accounts only for uniform flow velocity.45–47
As the disk spins and the fluid encounters a capillary, hydrophobic or hydrophilic section it needs more force to pass these barriers. A centrifugal force-actuated valve is open when Pω is higher than the Pcap. The frequency or rotational speed at which the valve is opened has been reported by is given by different groups, including Lu et al., Ouyang et al., and Madou et al.41,43 Eqn (4) shows the burst frequency fo in revolutions per minute (RPM) based on their studies:
 | (4) |
The burst pressure to overcome the capillary force, using angular speed in RPM units is:
 | (5) |
By employing appropriate equations, we can identify the effectiveness of hydrophobic or hydrophilic modifications in a microchannel holding a fluid.
Materials and methods
Microfluidics, hydrophilic and hydrophobic effects
Modified surfaces were made upon 100 μm PC films (Makrofol). Hydrophilic PC surfaces were fabricated using nanosecond UV laser machining (248 nm, 5 ns pulse duration, 500 Hz repetition rate; Xantos XS, Coherent Inc., USA) using a micromachining system (IX-100C, JPSA Inc., USA). Creation of a flat-top beam profile was achieved with a square shaped physical mask. The optimized settings were found to be 100 μm2 spot sizes (10 μm × 10 μm, square shaped); 1 μm spacing between shots (ablation) and 8, 10 and 12 μm spacing between the centre of the shots (see ESI†). The power used for the nanosecond laser experiments was 0.5 mW.Hydrophobic PC surfaces were fabricated with femtosecond laser irradiation (800 nm, 100 fs pulse duration, 1 kHz, Legend Elite, Coherent Inc., USA) using the same machining stage as the nanosecond laser system and a square mask. The optimized femtosecond laser settings used were 2500 μm2 square spot sizes (50 μm × 50 μm, square shaped); 1 μm spacing between shots and 40, 45, 50, 55 μm spacing between lines and powers of 5 and 13 mW. The total surface area machined using both laser systems was 6 × 6 mm as to ensure coverage of the channel and any possibility of dealignment. The reproducibility of the method was tested by using 15 replicates for each ablation setting variation. Before surface characterization, samples were sonicated with Milli-Q water for 10 minutes and air dried.
Characterization of sample morphology and influence of surface chemical modification
The modified surface morphology was characterized using scanning electron microscopy (SEM; JCM-6000PLUS NeoScope Benchtop) and optical profilometry (Bruker Contour GT-K – Coherent Inc., USA). These methods were used to measure the morphology and dimensional profile of material ablated by the laser treatments. Milli-Q water and a goniometer (KSV CAM100) were used to measure the static, advancing and receding contact angles. Chemical modifications at the surface, caused by the laser treatments, were measured using FTIR spectroscopy (PerkinElmer Spectrum 400 spectrophotometer) and X-ray photoelectron spectroscopy. XPS spectra were acquired on an Axis ultraDLD (Kratos Ltd, UK), using a monochromatic Al Kα X-ray source and core level scan pass energies of 20 eV. The data were fitted with Gaussian–Lorentzian peaks in CasaXPS (Casa Software Ltd, USA). A gold sputter coater (Quorum Technologies – Q150R) was used to create a blocking layer of 300 nm on the samples for separately testing the influence of the morphology and the surface chemistry on the wettability ablated samples.Microfabrication
The most hydrophobic and most hydrophilic surfaces on laser modified PC, found in the surface characterization process, were used to create hydrophobic and hydrophilic valves in centrifugal microfluidic disk channels. The centrifugal microfluidic disks were manufactured using 100 μm thick PC film (Makrofol®), 125 μm thick pressure sensitive adhesive (AR-MH-90106), 150 μm thick commercially available polyethylene film (OfficeMax Overhead Projector Transparency Film) and 2 mm thick PMMA (PSP Plastics). The PC film was cut using the nanosecond laser system with a 110 μm diameter spot size, 0.8 μm spacing, 380 mW and two passes. The location of the start and end of the valves (surface modified areas) relative to the centre of the disk were 30.00 mm and 31.27 mm. The channel average size was 685 ± 51 μm. The microfluidic circuit was formed by two pressure sensitive adhesive (PSA) layers sandwiching a polyethylene terephthalate (PET) sheet. These 3 layers were attached and cut as a single piece. The nanosecond laser was used to cut the polycarbonate pieces that contain the top and bottom walls of the microfluidic circuit. The settings used were 100 μm diameter circle spot size, 0.8 μm spacing between shots and 335 mW and 3 passes. The beam shapes were formed by using an iris to avoid losing laser power.PMMA sheets were attached to a sheet of PSA and laser cut to form the base and top of the disk. These PMMA layers also contained the air release outputs and sample input ports. The laser system used for cutting the PMMA and PSA layers was a continuous wave CO2 laser (Universal Laser Systems, VLS3.50, 30 W, 10.6 μm) with 30 W and scan speed of 12.5 mm s−1. Three-point alignment was used to align the disks. A manual cold roll laminator was used to join all the disk layers and better seal the disks, forming the microfluidic disk (Fig. 1A). The ESI† shows the different layers and disk assembly cross-section view of the assembled disk.
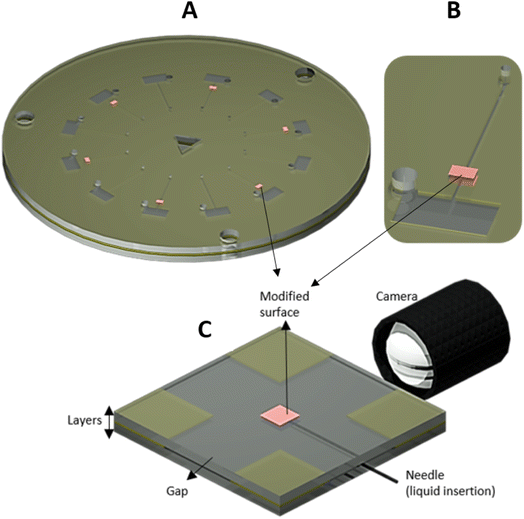 | ||
| Fig. 1 (A) The assembled disk showing the circuits with valves and control circuits. (B) The zoomed circuit. (C) The microfluidic device made to measure the contact angle inside the channel. See ESI† for dimension details. | ||
A microfluidic device with modified top and bottom surfaces was created to measure the contact angle of the droplets being compressed by the top and bottom walls, mimicking a microfluidic channel containing the top and bottom modified surfaces. The device dimension was a square 50 × 50 mm, made using the same layering of the disks. This mimicking device had four corners that each contained opening “gaps” of 20 mm (Fig. 1C) used to add the fluid to the device. The modified surface dimensions in this device were 6 × 6 mm (top and bottom) and located at the centre of the device. A flat-top needle was used to insert the sample (Milli-Q water) at 90° relative to the light source and camera. The goniometer used in the previous section was used to verify the contact angle inside the device. See ESI† for device dimensions.
Centrifugal microfluidic platform, replicates, and spin settings
The disk spin run settings employed a constant acceleration of 500 rpm per s and the angular speed was incremented 10 rpm towards each trial of 10 seconds starting from 100 rpm. The video was recorded at 30 frames per second. A total of 12 replicates of control and 12 replicates of each type of valve were used.Results and discussion
Hydrophobic surface morphology and wettability
The initial contact angle of untreated PC was measured to be 79 ± 3°. However, through the application of femtosecond laser treatment, the surface underwent a transformation into a highly hydrophobic state, resulting in static contact angles exceeding 136 ± 2°. The hydrophobicity was found to be dependent on the spacing between laser lines, highlighting the influence of these variables. Using the same spot sizes of 50 μm2 and the central distances from each line as 40, 45, 50, 55 μm, the contact angles increased as these spaces were increased. Furthermore, the measure of advancing and receding contact angles for the 55 μm line spacing demonstrated a superhydrophobic behaviour (above 150°) and hysteresis equal to 9.9°. As seen in Fig. 2 the largest increase in hydrophobicity occurred in the largest spacing used (55 μm); the lowest hydrophobicity was observed with 40 μm spacing.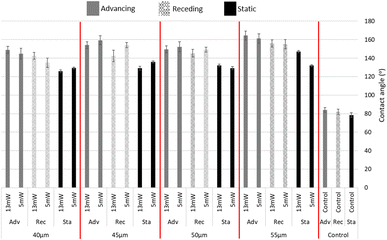 | ||
| Fig. 2 Advancing (Adv), Receding (Rec) and Static (Sta) contact angles of surface modifications with different spacings and control (numerical table in Appendix E†). | ||
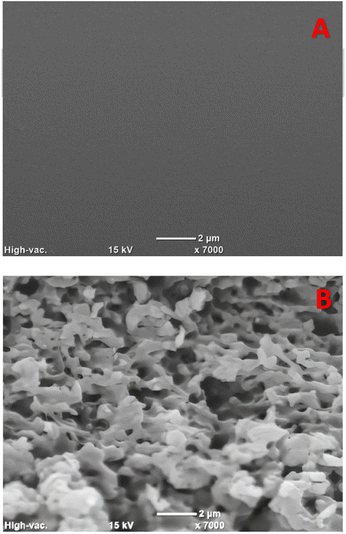
The surface morphology was investigated using a SEM. The hydrophobic surface demonstrated a high increase in roughness (Fig. 3). The main cause for this roughness was the non-linear absorption by the PC of the high-intensity near-infrared femtosecond laser pulse.34 It is important to note that the non-thermal mechanism of femtosecond laser treatment should generate a minimal polymer melting and reflow, as the heating generated during the process should be insufficient to melt the polymer.
In addition to the SEM analysis, the utilization of an optical profiler system revealed clear images showcasing the formation of uniform crests of identical height on the non-ablated area created by the larger line spacings. These crests were seen in all but the 40 μm spacing as seen in Fig. 4. Furthermore, it was verified that the lower spacing ablation generated an irregular surface that varied approximately 4 μm in height. The highest ablation spacing (55 μm), which generated the highest hydrophobicity, using 13 mW power generated 20 ± 3 μm grooves whilst 5 mW power gave 15 ± 2 μm. This change in power had minimal impact on the hydrophobicity of the advancing and receding contact angles, suggesting that the hydrophobic components and the depth of these crests created by varying power levels had limited influence. In addition, the results from the optical profiler indicated that the dimensions of the crest tops did affect the hydrophobicity and worked as organized micropatterns that are well-known to create hydrophobic surfaces.
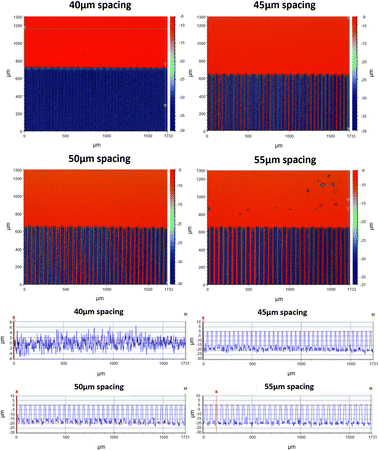 | ||
| Fig. 4 Optical profile measurements on top view and cross-section view for hydrophobic surfaces at different line spacing for 13 mW laser power. | ||
Hydrophilic surface morphology and wettability
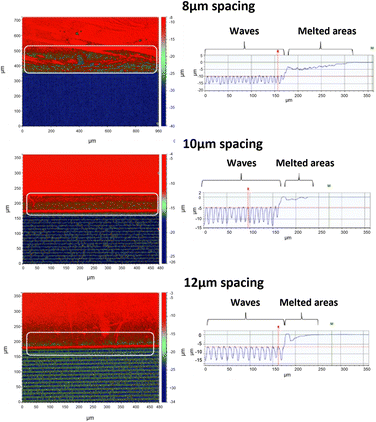
The second approach we used for surface tailoring was the nanosecond laser treatment. Using 248 nm pulses under 3 different ablation conditions (spacings) generated similar crests observed when using the hydrophobic (femtosecond laser) surface modification. However, with nanosecond laser surface treatment, the ablated area was much smoother. As mentioned in our introduction, the nanosecond laser ablation with UV irradiation occurs through a thermal degradation process.32 Consequently, the laser-induced heating melts the polymer, triggering a re-flow of the molten material and ultimately resulting in the smooth surface, as depicted in Fig. 5. This heating and re-flow process also smoothened out the crests and valleys in the treated surface, creating a smoother wave-like pattern.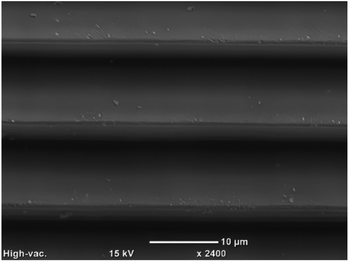 | ||
| Fig. 5 Super hydrophilic surface created on PC, showing the crests and smooth surface produced by the nanosecond laser. | ||
The samples ablated using smaller spacing (8 μm) showed smaller wave patterns than the larger spacing lines as seen in Fig. 6. The wave top formed during ablation for the 8, 10 and 12 μm were 10.0 ± 0.7, 5.5 ± 0.8 and 6.0 ± 1.0 μm below the ablation surface, and the bottoms of the waves were at 15.0 ± 1.0, 12.0 ± 0.8 13.0 ± 1.0 μm.
The grooves in the waves lead to the formation of smooth open capillaries, which were approximately 10 μm in width and 5.0, 6.5 and 7.0 μm in depth. The formation of these open micro-channels capillaries within the ablated area maybe one of the factors responsible for creating the capillary force that pulls the liquid into the surface, contributing to the effectively zero-contact angle of the sample. Similar capillary like effects can be seen in literature as fluid can follow paths in structured surfaces.48 A small qualitative experiment was performed, where a droplet was added to a nanosecond modified surface and top images were taken over time. The images show that we can produce capillaries made with the nanosecond laser, hence showing the fluid pull and direction on open surfaces (see ESI†). Fig. 7 shows the super hydrophilicity of the surface modified by the nanosecond laser compared to the control untreated PC and the hydrophobic surface created by femtosecond laser treatment.
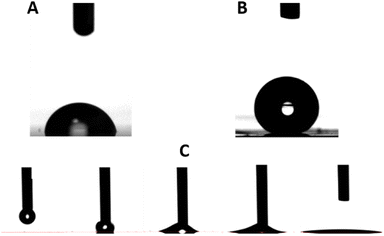 | ||
| Fig. 7 (A) PC unmodified surface (78.5°), (B) femtosecond laser modified surface (145°) and (C) nanosecond laser modified surface and its hydrophilic wetting behaviour. | ||
The last wettability characterisation explored the influence of the laser induced chemical modification through a possible insertion of chemical groups (hydrophobic or hydrophilic) that may have affected the interaction in the solid–liquid interface. The modified surfaces were coated with gold at few nanometre thickness in order to hinder the hydrophilic effects due to the change in surface chemistry, turning the hydrophilic surfaces into hydrophobic ones (Fig. 8). The static contact angle for 8,10 and 12 μm spacing samples were respectively 99 ± 3°, 128 ± 3°, 144 ± 4°. Therefore, this increase in contact angle confirmed that the hydrophilicity was due to the chemical change of the material (studied in the next section). Furthermore, the airgap caused by the waves induced a Cassie-state of wettability, where the air pockets, located within the waves crests, induced the increase in contact angle seen after the hydrophilic groups were covered by gold.49
Chemical analysis of surface modifications
The hydrophobic and hydrophilic surfaces can have both morphological and chemical components. This section shows the chemical effect of the different laser treatments. The ATR-FTIR spectra of the PC sample were measured before laser treatment and then again after nanosecond and femtosecond laser treatments (Fig. 9). The spectra were normalized to the same height for the 2966 cm−1 band (C–H stretch mode for the methyl group) to more easily visualize differences in the intensities of bands relating to changes in the C–O and C![[double bond, length as m-dash]](https://www.rsc.org/images/entities/char_e001.gif) O functional groups, which are bands correlated with hydrophilic surface behaviour.
O functional groups, which are bands correlated with hydrophilic surface behaviour.
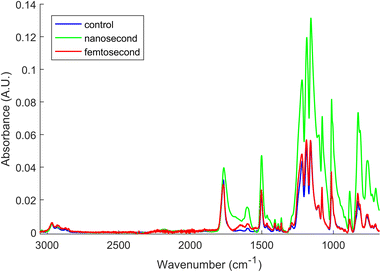 | ||
| Fig. 9 ATR-FTIR spectra of the three PC surfaces, normalized to the same height for the CH 2996 cm−1 and overlaid for comparison. | ||
The main peaks visible in the spectra are the C–H stretch modes coming from the methyl groups between 2800 to 3000 cm−1, the sharp carbonyl stretch around 1770 cm−1, the sharp phenol ring stretch at 1501 cm−1, the carbon–oxygen stretch (C(O)C) modes appearing as a broad, multicomponent band at 1220 cm−1, the sharp C–O–C stretches at 1011 cm−1 and 840–900 cm−1, the out-of-plane deformations of the para-disubstituted phenol rings at 830 cm−1 with their C–H deformation modes at 695–765 cm−1 and the CH3 rocking modes between 910–970 cm−1.50,51 Smaller bands due to the C–H stretch modes of the phenol rings are present at 3100–3000 cm−1.52
Notable distinctions can be observed in terms of relative intensities, bandwidths, and shifts within certain spectral bands subsequent to the laser treatment of the surface. These changes indicate surface chemistry modification resulting from thermal degradation, particularly for the nanosecond-lasered surface. In the nanosecond treated surfaces, there is a clear broadening and increase in the relative intensities of the C![[double bond, length as m-dash]](https://www.rsc.org/images/entities/char_e001.gif) O and O(C)O stretch modes around 1770 cm−1 and 1218–1011 cm−1, respectively. Similar changes were also observed for the deformation and twisting bonds for the chains (CH2). This could be explained by a greater thermal degradation of the PC structures resulting in scission of the polymer chains followed by branching, eventually leading to crosslinking and gelation or reflow of the surface material.53,54 This drastic change may have increased branching and disorder of the structure accompanying degradation of the carbonate groups with formation of branched products, as shown in the reactions (6) and (7) below.53 Thermal degradation of PC has been shown to involve a finely balanced competition between scission and X-linking processes.53,54
O and O(C)O stretch modes around 1770 cm−1 and 1218–1011 cm−1, respectively. Similar changes were also observed for the deformation and twisting bonds for the chains (CH2). This could be explained by a greater thermal degradation of the PC structures resulting in scission of the polymer chains followed by branching, eventually leading to crosslinking and gelation or reflow of the surface material.53,54 This drastic change may have increased branching and disorder of the structure accompanying degradation of the carbonate groups with formation of branched products, as shown in the reactions (6) and (7) below.53 Thermal degradation of PC has been shown to involve a finely balanced competition between scission and X-linking processes.53,54
 | (6) |
 | (7) |
Increased hydrogen bonding from the crosslinking would also explain the slight red shifting and broadening of the C![[double bond, length as m-dash]](https://www.rsc.org/images/entities/char_e001.gif) O stretching mode at 1770 cm−1 for the nanosecond laser treated samples. For the femtosecond treatment a slight broadening and increase in frequency and intensity were observed in the CO stretch modes at 1221 cm−1. Furthermore, a small broadening in these bands indicated a structural change due to a small thermal effect, but in considerably lower effects than the nanosecond treatment. In addition, a small increase occurred in intensity of the C
O stretching mode at 1770 cm−1 for the nanosecond laser treated samples. For the femtosecond treatment a slight broadening and increase in frequency and intensity were observed in the CO stretch modes at 1221 cm−1. Furthermore, a small broadening in these bands indicated a structural change due to a small thermal effect, but in considerably lower effects than the nanosecond treatment. In addition, a small increase occurred in intensity of the C![[double bond, length as m-dash]](https://www.rsc.org/images/entities/char_e001.gif) C stretch mode for the aromatic ring. The changes to the femtosecond ablated surface are far smaller than those induced by the nanosecond uv laser as the thermal damage by the infrared femtosecond laser technique is small.
C stretch mode for the aromatic ring. The changes to the femtosecond ablated surface are far smaller than those induced by the nanosecond uv laser as the thermal damage by the infrared femtosecond laser technique is small.
The different degradation conditions experienced during nano- and femto-second laser treatments resulted in different surface modifications of the two PC samples. Both show an increase in the hydrophilic groups, significantly larger for the nanosecond laser treatment. This observation supports an earlier finding that a slight alteration in degradation conditions can drastically change the overall mechanism of breakdown and breakdown products.54
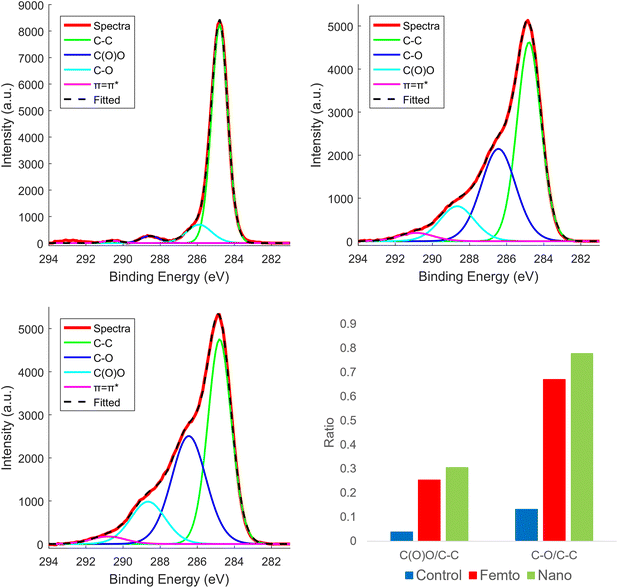
Another characterisation technique used to measure the differences in hydrophobic and hydrophilic groups can be obtained from XPS peak ratios, as shown in Fig. 10. The spectra were fitted based on peak assignments determined from Smith et al.,55 with well-known binding energies for each carbon functionality. Overall, the XPS showed an increase in the carbonyl (C![[double bond, length as m-dash]](https://www.rsc.org/images/entities/char_e001.gif) O) and C–O functionalities (C(O)O) relative to pure C–C or C
O) and C–O functionalities (C(O)O) relative to pure C–C or C![[double bond, length as m-dash]](https://www.rsc.org/images/entities/char_e001.gif) C functionalities with a slight increase in surface oxygenation with nanosecond compared to femtosecond laser treatment. This apparent discrepancy compared to the FTIR results can be understood by the highly surface sensitive nature of XPS, which only collects photoelectron signals from within the first few nanometres of a surface.56 Therefore, the femtosecond laser treated region could have a highly oxidised surface layer, but a much less thermally damaged/perturbed interior, as FTIR probes the surface composition to a depth at the low micron range.57 The combined evidence then points to nanosecond laser treatment inducing a large increase in the oxygen content, with femtosecond lasers only changing the surface oxygen content (at least a few nm deep) while leaving most of the laser interaction volume free from additional oxidation. Table 1 shows the functional group percent ratio in the analysed surface. The π
C functionalities with a slight increase in surface oxygenation with nanosecond compared to femtosecond laser treatment. This apparent discrepancy compared to the FTIR results can be understood by the highly surface sensitive nature of XPS, which only collects photoelectron signals from within the first few nanometres of a surface.56 Therefore, the femtosecond laser treated region could have a highly oxidised surface layer, but a much less thermally damaged/perturbed interior, as FTIR probes the surface composition to a depth at the low micron range.57 The combined evidence then points to nanosecond laser treatment inducing a large increase in the oxygen content, with femtosecond lasers only changing the surface oxygen content (at least a few nm deep) while leaving most of the laser interaction volume free from additional oxidation. Table 1 shows the functional group percent ratio in the analysed surface. The π![[double bond, length as m-dash]](https://www.rsc.org/images/entities/char_e001.gif) π* signal due to the aromatic rings shows s a small increase for the femtosecond laser treatment compared to control and nanosecond.
π* signal due to the aromatic rings shows s a small increase for the femtosecond laser treatment compared to control and nanosecond.
| Area% | C–C | C–O | C(O)O | π![[double bond, length as m-dash]](https://www.rsc.org/images/entities/char_e001.gif) π* π* |
C(O)O/C–C | C–O/C–C |
| Control | 84.66 | 11.17 | 3.24 | 0.93 | 0.04 | 0.13 |
| Femtosecond | 50.43 | 33.77 | 12.79 | 3.01 | 0.25 | 0.67 |
| Nanosecond | 46.81 | 36.41 | 14.27 | 2.51 | 0.30 | 0.78 |
Likewise, the ratio of the hydrophobic component C–C is higher for the femtosecond compared to the nanosecond treatment, where both have less C–C component than the control. The ratio for the hydrophilic groups C(O)C and C–O are increased for the laser treatments, having higher values for the nanosecond laser treatment. Therefore, a higher surface oxidation occurs for the nanosecond laser ablation, confirming the effect of surface modification that led to the formation of the highly hydrophilic surfaces seen in the previous sections.
Brief discussion on surface modifications
Different studies have demonstrated that surfaces incorporating hydrophilic groups can exhibit super hydrophobic characteristics, underscoring the pivotal role of microstructures in determining the hydrophobicity of a surface.58–61 In line with these findings, our experimental results for the femtosecond laser modified surfaces provide further support as we showcase that the generation of highly roughened surfaces added to wave like periodic patterns can generate hydrophobic surfaces even when showing the incorporation of hydrophilic groups, as shown by our XPS results.Moreover, the application of a nanosecond laser pulse, in addition to ensuring a smooth surface, facilitated the creation of super hydrophilic surfaces by inducing a higher concentration of hydrophilic groups. This process relied predominantly on the localized heating and subsequent material removal through vaporization or melting, as evident in the observed melting characterisation seen in the optical profile section (Fig. 6). Unlike the femtosecond process, the use of a slower laser pulse with a highly absorbed wavelength allowed material removal and surface modification, without causing significant roughness or microstructure formation. Additionally, the reflow of the polymer further contributed to the attainment of a smooth surface and hence, to the maintenance of the superhydrophilic properties of the chemical groups.
The creation of laser-modified surfaces is influenced by various factors, including the instrument's precision and the specific settings employed. For instance, Liu et al.7 utilized a UV laser with higher wavelengths (355 nm) and fluences that were 100-fold greater than those utilized in our experiment, resulting in the generation of hydrophilic rough surfaces. Conversely, Meunier et al.17 achieved smooth lenses by employing femtosecond lasers with low laser excitation at the nanojoule level beneath the surface. These studies demonstrate that laser settings, such as power, wavelength, speed, and other variables, can generate surfaces with different morphologies, chemistries, and wettability properties.
In our study, we successfully generated smooth surfaces using a nanosecond UV laser and rough surfaces using femtosecond IR laser settings, both of which exhibited highly defined patterns. This showcases different methods for creating hydrophobic and hydrophilic surfaces. Notably, our technique offers advantages in terms of precision, with precise wave patterns, smooth surfaces, and modified area reproducibility. However, similar to other existing direct laser modification techniques, its current limitation lies in the speed required for mass production applications, such as in the fabrication of microfluidic chips. Even having some limitations, these techniques serve as valuable prototyping methods to demonstrate concepts, as exemplified in our subsequent section, and hold the potential to pave the way for the future of precise microfluidic and nanofluidic device fabrication.
It is worth noting that the field of microfluidics is increasingly converging towards nanofluidics, necessitating improved fluid control in microfluidic chips. Therefore, enhancing the speed of these systems may define the next phase in microfluidics' development. Good candidates such as spatial light modulators may one day be used to speed these processes.62,63
Valve testing
The ability to have high fluid control in microchannels is critical in order to further miniaturize microfluidic circuits. In centrifugal microfluidics, the fluid can be mainly controlled by using the forces derived from the disk spin, and the capillary force due to the dimensions of the channels and wall wettability. In these experiments, the behaviour of the fluid being compressed inside a micro channel demonstrated that the modified hydrophobic surface displayed a Wenzel state, meaning that the droplets were in full contact with the rough surface.64 Hence, the compression of fluid between two walls induces wetting at the machined area, as observed in Fig. 11, where more hydrophilic like menisci are seen for both types of laser-ablated surfaces. Our hydrophobic surface phenomenon, characterized by the coexistence of hydrophilic groups and hydrophobic behaviour, finds support in the behaviour of fluids within the microfluidic device containing the hydrophobic valves. These valves effectively retained water droplets, even during the transition from the modified to the unmodified surface.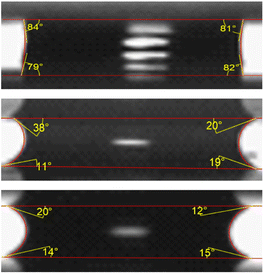 | ||
| Fig. 11 Inner view of the fluid behaviour within different top and bottom surfaces. (top) Untreated surface, (middle) hydrophobic and (bottom) hydrophilic surfaces and their wettability angles. | ||
The experimental setup ensured the channels' walls and dimensions remained constant throughout the study (Fig. 12). Calculations were based on the advancing contact angles observed, which closely resemble the behaviour of droplets passing through the modified patches. Comparing the effects of different surface treatments (nanosecond and femtosecond laser) to the control group revealed unique and distinct impacts on the behaviour of liquid droplets.
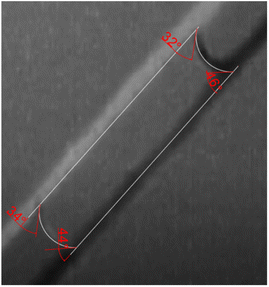 | ||
| Fig. 12 Top view of the microfluidic channel with fluid showing θh, where the angles are shown in red. | ||
The hydrophobic valves showed an increase in the necessary burst frequency from 649 ± 50 to 818 ± 35 rpm, leading to an experimental pressure (using eqn (5)) increase from 349 ± 55 to 490 ± 42 Pa, an increase of approximately 29% in the pressure required to burst the hydrophobic valves compared to the control. The theoretical pressure was calculated by applying eqn (5). The results were respectively 352 ± 25 and 488 ± 20 Pa, for the control and hydrophobic valve, agreeing with the experimental values. One important finding was the fluid stoppage that occurred on the initial part of the modified surface patch, creating an initial hydrophobic barrier, followed by slow constriction of the fluid until it reaches the end part of the modified surface.
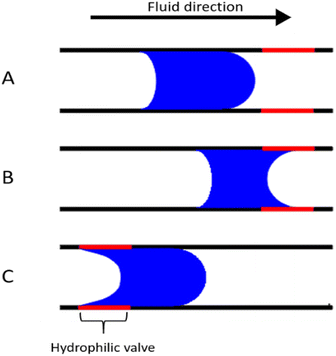
The fluid movement behaviour on the hydrophilic surface showed distinct fluid movement phases when passing through the hydrophilic valve. The first stage consisted of a “speed lane”, which happened as a droplet touched the modified surface. The presence of a high surface energy on the hydrophilic patch promptly pulled the droplet, facilitating its motion until it reached the boundary where the unmodified area began. Hence, the pressure necessary to move the droplet decreased, due to the high surface energy created by the chemical modification. However, as soon as the droplet touched the lower surface energy, unmodified area, it needed more pressure to overcome the hydrophilic patch as the water gets held by the high surface energy of the hydrophilic patch. In practical application, the hydrophilic valve demonstrated comparable efficacy in retaining a water droplet when compared to the hydrophobic valve. Fig. 13 shows these stages.
The fluid entered the hydrophilic patch at 663 ± 48 rpm, which was approximately the same speed necessary to burst the control channel. The calculated burst pressure using the contact angle and dimension measurements resulted in 223 ± 20 Pa. However, as soon as the droplet meniscus began to overcome the valve, the fluid was held by the highly hydrophilic surface (as seen in Fig. 13C) and 803 ± 39 rpm was required to burst the valve, resulting in extra 140 ± 29 rpm for the burst frequency to burst the surface modified area. This difference applied to the the calculated burst pressure resulted in 213 ± 35 Pa, a decrease of approximately 39% in the pressure required to move the droplet through the channel. Hence, the droplet entering the channel had a reduced pressure, however, leaving the channel the force exerted needed to be increased by increasing the RPM. The results are summarized in Table 2.
| Control | Hydrophobic | Hydrophilic | |
|---|---|---|---|
| θw (°) | 80 ± 2 | 158 ± 5 | 17 ± 2 |
| θh (°) | 41 ± 4 | 41 ± 4 | 41 ± 4 |
| W (μm) | 679 ± 40 | 710 ± 35 | 666 ± 38 |
| H (μm) | 375 ± 15 | 375 ± 15 | 375 ± 15 |
| Burst frequency (rpm) | 649 ± 50 | 818 ± 35 | In: 663 ± 48 |
| Out: 803 ± 39 | |||
| Theoretical P (Pa) | 352 ± 25 | 488 ± 20 | 223 ± 20 |
| Experimental P (Pa) | 349 ± 55 | 490 ± 42 | In: 213 ± 35 |
| Out: 480 ± 43 |
The results revealed two main distinct potential applications for the hydrophobic valves. Firstly, they can effectively halt the flow of fluids during the initial sample insertion into the microfluidic device, enabling enhanced precision in sample measurements. Secondly, as microfluidic circuits continue to decrease in size and channel dimensions become smaller, capillary force can intensify, leading to a potential fluid leakage issue in subsequent chambers before the appropriate time. These valves can be used to prevent these fluid leaks happening from chamber to chamber or even the fluid entering a channel.
Similarly, to the hydrophobic valves, the hydrophilic valves have also increased the burst pressure necessary to allow fluid movement. However, due to its different fluidic behaviour, one possibility to be investigated is the use of its liquid engulfing as means to increase the strength of the mixing force applied in open droplets. Therefore, as centrifugal microfluidic miniaturizes even further, hydrophilic patches could be used to hold microdroplets in position, whilst applying a higher acceleration and deceleration (Euler force) and take advantage of mixing at micro or nanoscale.65 An additional potential application to explore is their utilization as a platform to expedite and direct the transfer of liquids between microfluidic chambers. By employing a hydrophilic surface on both the channel and chamber in one configuration, and leaving another channel and chamber unmodified, the modified channel and chamber can receive the liquid before reaching the pressure threshold required to induce fluid movement through the unmodified surfaces. Finally, one of the fields in microfluidics that can take advantage of such hydrophilic surfaces is the open-air microfluidic circuits that need fluids to use capillary force and at the same time need the fluid to be held by such capillaries.25
Conclusion
The results of our study have culminated in the development of a unique, laser-based method facilitating direct surface modification of polycarbonate, employing both nanosecond and femtosecond lasers. As a cost-effective thermoplastic material, polycarbonate represents a practical substrate for microfluidic device fabrication. Our methodology induces significant alterations in the wettability properties of the polycarbonate substrate. In-depth analyses using various instrumental techniques revealed substantial morphological and chemical transformations occurring at the modified surface of the polycarbonate. These properties were evaluated within a centrifugal microfluidic platform. Preliminary results confirmed these modified areas' proficiency in liquid retention, thereby establishing their functionality as microfluidic barriers.Conflicts of interest
There are no conflicts to declare.Acknowledgements
We would like to express our gratitude to the University of Auckland, Photon Factory, and Orbis Diagnostics Limited for their funding and provision of essential facilities.Notes and references
- C. W. Tsao, Polymer microfluidics: Simple, low-cost fabrication process bridging academic lab research to commercialized production, Micromachines, 2016, 7(12), 255 CrossRef PubMed.
- C. D. Chin, V. Linder and S. K. Sia, Commercialization of microfluidic point-of-care diagnostic devices, Lab Chip, 2012, 12, 2118 RSC.
- D. Konstantinou, A. Shirazi, A. Sadri and E. W. K. Young, Combined hot embossing and milling for medium volume production of thermoplastic microfluidic devices, Sens. Actuators, B, 2016, 234, 209–221 CrossRef CAS.
- E. Berthier, E. W. K. Young and D. Beebe, Engineers are from PDMS-land, Biologists are from Polystyrenia, Lab Chip, 2012, 12, 1224 RSC.
- J. M. Goddard and J. H. Hotchkiss, Polymer surface modification for the attachment of bioactive compounds, Prog. Polym. Sci., 2007, 32, 698–725 CrossRef CAS.
- H. Becker and L. E. Locascio, Polymer microfluidic devices, Talanta, 2002, 56(2), 267–287 CrossRef CAS PubMed.
- J. Liu, S. Wang, M. Lv and X. Zeng, Surface modification of bisphenol A polycarbonate material by ultraviolet Nd:YVO 4 laser high-speed microprocessing technology, J. Micromech. Microeng., 2014, 24, 85002 CrossRef CAS.
- Y. Kong, H. Chen, Y. Wang and S. A. Soper, Fabrication of a gold microelectrode for amperometric detection on a polycarbonate electrophoresis chip by photodirected electroless plating, Electrophoresis, 2006, 27, 2940–2950 CrossRef CAS PubMed.
- Y. Zhang, H. N. Hansen, A. De Grave, P. T. Tang and J. S. Nielsen, Selective metallization of polymers using laser induced surface activation (LISA)—characterization and optimization of porous surface topography, Int. J. Adv. Manuf. Technol., 2011, 55, 573–580 CrossRef.
- Q. Zhou, H. Chen and Y. Wang, Region-selective electroless gold plating on polycarbonate sheets by UV-patterning in combination with silver activating, Electrochim. Acta, 2010, 55, 2542–2549 CrossRef CAS.
- T. A. Hanafy, Dielectric relaxation and Schottky conduction of IR laser irradiated Makrofol-DE polycarbonate, J. Appl. Polym. Sci., 2012, 124, 1–8 CrossRef CAS.
- M. Devalckenaere, A. Jadin, K. Kolev and L. D. Laude, Excimer laser ablation of polycarbonate-based plastic substrates, Nucl. Instrum. Methods Phys. Res., Sect. B, 1999, 151, 263–267 CrossRef CAS.
- K. Naessens, H. Ottevaere, R. Baets, P. Van Daele and H. Thienpont, Direct writing of microlenses in polycarbonate with excimer laser ablation, Appl. Opt., 2003, 42, 6349–6359 CrossRef CAS PubMed.
- P. Jankowski and P. Garstecki, Stable hydrophilic surface of polycarbonate, Sens. Actuators, B, 2016, 226, 151–155 CrossRef CAS.
- K. A. Vijayalakshmi, M. Mekala, C. P. Yoganand and K. Navaneetha Pandiyaraj, Studies on modification of surface properties in polycarbonate (PC) film induced by DC glow discharge plasma, Int. J. Polym. Sci., 2011, 2011, 1687–9422 Search PubMed.
- R. Guo, D. Yuan and S. Das, Large-area microlens arrays fabricated on flexible polycarbonate sheets via single-step laser interference ablation, J. Micromech. Microeng., 2011, 21, 15010 CrossRef.
- T. Meunier, A. B. Villafranca, R. Bhardwaj and A. Weck, Fabrication of microlens arrays in polycarbonate with nanojoule energy femtosecond laser pulses, Opt. Lett., 2012, 37, 4266–4268 CrossRef CAS PubMed.
- J. P. Hu and L. T. Qi, Experimental Investigation on Femtosecond Laser Ablation of Polycarbonate, in Advances in Materials and Materials Processing, Trans Tech Publications, 2013, pp. 2359–2362 Search PubMed.
- S. Baudach, J. Bonse, J. Kruger and W. Kautek, Ultrashort pulse laser ablation of polycarbonate and polymethylmethacrylate, Appl. Surf. Sci., 2000, 154, 555–560 CrossRef.
- E. Occhiello, F. Garbassi and V. Malatesta, A study of the chemical and morphological alterations of PS and PC surfaces induced by excimer laser treatments, J. Mater. Sci., 1989, 24, 569–572 CrossRef CAS.
- P. Jankowski and P. Garstecki, Stable hydrophilic surface of polycarbonate, Sens. Actuators, B, 2016, 226, 151–155 CrossRef CAS.
- F. Palumbo, R. Di Mundo, D. Cappelluti and R. Dagostino, SuperHydrophobic and SuperHydrophilic polycarbonate by tailoring chemistry and nano-texture with plasma processing, Plasma Processes Polym., 2011, 8, 118–126 CrossRef CAS.
- X. Li, D. R. Ballerini and W. Shen, A perspective on paper-based microfluidics: Current status and future trends, Biomicrofluidics, 2012, 6, 11301–11313 CrossRef PubMed.
- O. Strohmeier, M. Keller, F. Schwemmer, S. Zehnle, D. Mark, F. von Stetten, R. Zengerle and N. Paust, Centrifugal microfluidic platforms: advanced unit operations and applications, Chem. Soc. Rev., 2015, 44, 6187–6229 RSC.
- J. W. Martin, M. K. Nieuwoudt, M. J. T. Vargas, O. L. C. Bodley, T. S. Yohendiran, R. N. Oosterbeek, D. E. Williams and M. Cather Simpson, Raman on a disc: high-quality Raman spectroscopy in an open channel on a centrifugal microfluidic disc, Analyst, 2017, 142, 1682–1688 RSC.
- B. P. Casavant, E. Berthier, A. B. Theberge, J. Berthier, S. I. Montanez-Sauri, L. L. Bischel, K. Brakke, C. J. Hedman, W. Bushman, N. P. Keller and D. J. Beebe, Suspended microfluidics, Proc. Natl. Acad. Sci. U. S. A., 2013, 110, 10111–10116 CrossRef CAS PubMed.
- K. Choi, A. H. C. Ng, R. Fobel and A. R. Wheeler, Digital microfluidics, Annu. Rev. Anal. Chem., 2012, 5, 413–440 CrossRef CAS PubMed.
- E. Occhiello, F. Garbassi and V. Malatesta, A study of the chemical and morphological alterations of PS and PC surfaces induced by excimer laser treatments, J. Mater. Sci., 1989, 24, 569–572 CrossRef CAS.
- K. Callewaert, Y. Martelé, L. Breban, K. Naessens, P. Vandaele, R. Baets, G. Geuskens and E. Schacht, Excimer laser induced patterning of polymeric surfaces, Appl. Surf. Sci., 2003, 218–225 CrossRef CAS.
- J.-Y. Zhang, H. Esrom, U. Kogelschatz and G. Emig, Modification of polymers with UV excimer radiation from lasers and lamps, J. Adhes. Sci. Technol., 1994, 8, 1179–1210 CrossRef CAS.
- É. E. Said-Galiev and L. N. Nikitin, Ablation of polymers and composites when exposed to CO2 laser radiation (review), Mech. Compos. Mater., 1992, 28, 97–114 CrossRef.
- M. Ghazaly El and A. Aydarous, Photoluminescence emission spectra of Makrofol® {DE} 1-1 upon irradiation with ultraviolet radiation, Results Phys., 2017, 7, 333–337 CrossRef.
- A. Gupta, A. Rembaum and J. Moacanin, Solid State Photochemistry of Polycarbonates, Macromolecules, 1978, 11, 1285–1288 CrossRef CAS.
- G. D. Valle, R. Osellame and P. Laporta, Micromachining of photonic devices by femtosecond laser pulses, J. Opt. A: Pure Appl. Opt., 2009, 11, 13001 CrossRef.
- R. Suriano, A. Kuznetsov, S. M. Eaton, R. Kiyan, G. Cerullo, R. Osellame, B. N. Chichkov, M. Levi and S. Turri, Femtosecond laser ablation of polymeric substrates for the fabrication of microfluidic channels, Appl. Surf. Sci., 2011, 257, 6243–6250 CrossRef CAS.
- Z. K. Wang, H. Y. Zheng, C. P. Lim and Y. C. Lam, Polymer hydrophilicity and hydrophobicity induced by femtosecond laser direct irradiation, Appl. Phys. Lett., 2009, 95, 111110 CrossRef.
- S. S. Harilal, J. R. Freeman, P. K. Diwakar and A. Hassanein, Femtosecond Laser Ablation: Fundamentals and Applications, in Laser-Induced Breakdown Spectroscopy: Theory and Applications, ed. Musazzi S. and Perini U., Springer, Berlin, Heidelberg, 2014, pp. 143–166 Search PubMed.
- J. Kijlstra, K. Reihs and A. Klamt, Roughness and topology of ultra-hydrophobic surfaces, in Colloids and Surfaces A: Physicochemical and Engineering Aspects, 2002, pp. 521–529 Search PubMed.
- B. Bhushan, Y. Jung, and M. Nosonovsky, Lotus effect: surfaces with roughness-induced superhydrophobicity, self-cleaning, and low adhesion, Springer Handbook of Nanotechnology, 2010, pp. 1437–1524 Search PubMed.
- E. Rebollar, J. R. Vázquez de Aldana, J. A. Pérez-Hernández, T. A. Ezquerra, P. Moreno and M. Castillejo, Ultraviolet and infrared femtosecond laser induced periodic surface structures on thin polymer films, Appl. Phys. Lett., 2012, 100, 041106 CrossRef.
- Y. Ouyang, S. Wang, J. Li and P. Riehl, Rapid patterning of “tunable”hydrophobic valves on disposable microchips by laser printer lithography, Lab Chip, 2013, 13, 1762–1771 RSC.
- D. Mark, P. Weber, S. Lutz, M. Focke, R. Zengerle and F. Von Stetten, Aliquoting on the centrifugal microfluidic platform based on centrifugo-pneumatic valves, Microfluid. Nanofluid., 2011, 10, 1279–1288 CrossRef CAS.
- J. Siegrist, R. Gorkin, L. Clime, E. Roy, R. Peytavi, H. Kido, M. Bergeron, T. Veres and M. Madou, Serial siphon valving for centrifugal microfluidic platforms, Microfluid. Nanofluid., 2010, 9, 55–63 CrossRef.
- X. Meng, Y. Zhu, Y. Chen, Y. Lu, Y. Xu and J. Cheng, Conditional siphon priming for multi-step assays on centrifugal microfluidic platforms, Sens. Actuators, B, 2017, 242, 710–717 CrossRef CAS.
- C. Lu, Y. Xie, Y. Yang, M. M. C. Cheng, C. G. Koh, Y. Bai, L. J. Lee and Y. J. Juang, New valve and bonding designs for microfluidic biochips containing proteins, Anal. Chem., 2007, 79, 994–1001 CrossRef CAS PubMed.
- M. J. Madou, L. J. Lee, S. Daunert, S. Lai and C.-H. Shih, Design and fabrication of CD-like microfluidic platforms for diagnostics: microfluidic functions, Biomed. Microdevices, 2001, 3, 245–254 CrossRef CAS.
- Y. Ouyang, S. Wang, J. Li, P. S. Riehl and P. Landers, Rapid patterning of “tunable” hydrophobic valves on disposable microchips by laser printer lithography, Lab Chip, 2013, 13, 1762–1771 RSC.
- C. W. Extrand, I. M. Sung, P. Hall and D. Schmidt, Superwetting of structured surfaces, Langmuir, 2007, 23, 8882–8890 CrossRef CAS.
- T. M. Cai, Z.-H. Jia, H.-N. Yang and G. Wang, Investigation of Cassie-Wenzel Wetting transitions on microstructured surfaces, Colloid Polym. Sci., 2016, 294, 833–840 CrossRef CAS.
- G. Weibin, H. Shimin, Y. Minjiao, J. long and D. Yi, The effects of hydrothermal aging on properties and structure of bisphenol A polycarbonate, Polym. Degrad. Stab., 2009, 94, 13–17 CrossRef.
- K. W. Busch, H. Wang and G. W. Small, Book Review: Handbook of Near-Infrared Analysis. 2nd Edition, Infrared and Raman Characteristic Group Frequencies: Table and Charts. 3rd Edition, Fourier Transforms in Spectroscopy, Appl. Spectrosc., 2002, 52A–53A CrossRef.
- B. N. Jang and C. A. Wilkie, The thermal degradation of bisphenol a polycarbonate in air, Thermochim. Acta, 2005, 426, 73–84 CrossRef CAS.
- A. Davis and J. H. Golden, Competition between scission and cross-linking processes in the thermal degradation of a polycarbonate [11], Nature, 1965, 206, 4982 Search PubMed.
- A. Davis and J. H. Golden, Thermal degradation of polycarbonate, J. Chem. Soc. B, 1968, 45–47 RSC.
- M. Smith, L. Scudiero, J. Espinal, J. S. McEwen and M. Garcia-Perez, Improving the deconvolution and interpretation of XPS spectra from chars by ab initio calculations, Carbon, 2016, 110, 155–171 CrossRef CAS.
- J. F. Moulder, Handbook of X-ray photoelectron spectroscopy: a reference book of standard spectra for identification and interpretation of XPS data, Surf. Interface Anal., 1992, 16–28 Search PubMed.
- W. Urbaniak-domagala, The Use of the Spectrometric Technique FTIR-ATR to Examine the Polymers Surface, Adv. Apects Spectrosc., 2012, pp. 86–104 Search PubMed.
- X. Qian, T. Tang, H. Wang, C. Chen, J. Luo and D. Luo, Fabrication of hydrophobic Ni surface by chemical etching, Materials, 2019, 12(21), 3546 CrossRef CAS PubMed.
- Z. Chen, Y. Guo and S. Fang, A facial approach to fabricate superhydrophobic aluminum surface, Surf. Interface Anal., 2010, 42, 1–6 CrossRef CAS.
- T. Onda, S. Shibuichi, N. Satoh and K. Tsujii, Super-water-repellent fractal surfaces, Langmuir, 1996, 12, 2125–2127 CrossRef CAS.
- N. A. Patankar, Hydrophobicity of surfaces with cavities: Making hydrophobic substrates from hydrophilic materials?, in Superhydrophobic Surfaces, 2009, pp. 51–72 Search PubMed.
- X. Wang, H. Yu, P. Li, Y. Zhang, Y. Wen, Y. Qiu, Z. Liu, Y. P. Li and L. Liu, Femtosecond laser-based processing methods and their applications in optical device manufacturing: A review, Opt. Laser Technol., 2021, 135, 106687 CrossRef CAS.
- Z. Fang, T. Zhou, W. Perrie, M. Bilton, J. Schille, U. Löschner, S. Edwardson and G. Dearden, Pulse Burst Generation and Diffraction with Spatial Light Modulators for Dynamic Ultrafast Laser Materials Processing, Materials, 2022, 15(24), 9059 CrossRef CAS PubMed.
- R. N. Wenzel, Resistance of solid surfaces to wetting by water, Ind. Eng. Chem., 1936, 28, 988–994 CrossRef CAS.
- J. Ducrée, Centrifugal Microfluidics, in Encyclopedia of Microfluidics and Nanofluidics, ed. Li D., Springer, US, Boston, MA, 2013, pp. 1–18 Search PubMed.
Footnote |
| † Electronic supplementary information (ESI) available. See DOI: https://doi.org/10.1039/d3ra01749d |
| This journal is © The Royal Society of Chemistry 2023 |

