 Open Access Article
Impact fracture mechanism and heat deflection temperature of PLA/PEICT blends reinforced by glass fiber
Joo Hyung Lee†
ab,
Chang Kyu Park†a and
Seong Hun Kim *a
*a
aDepartment of Organic and Nano Engineering, Hanyang University, Seoul 04763, South Korea. E-mail: kimsh@hanyang.ac.kr
bThe Research Institute of Industrial Science, Hanyang University, Seoul 04763, South Korea
First published on 25th July 2023
Abstract
To enhance the crack propagation and initiation properties and heat deflection temperature of poly(lactic acid) (PLA), PLA/poly(1,4-cyclohexanedimethylene isosorbide terephthalate) (PEICT) blend systems were prepared and glass fibers (GF) were incorporated as reinforcements. Due to high shear force during extrusion and injection molding the length of GF was reduced and was oriented towards the flow direction. Although the reinforcing effect of the GF deviated from the theoretical values calculated by the Halpin–Tsai equation, both tensile and flexural properties were greatly enhanced with increasing GF content. Dynamic mechanical and thermal testing showed improved storage modulus throughout the entire temperature range showing outstanding reinforcing ability. By incorporating GF into the PLA/PEICT blend, the crack propagation and initiation properties were enhanced compared to pristine PLA. Such an increase in crack propagation properties was the result of enhanced modulus with the added GF. Moreover, because of the increased modulus, the heat deflection temperatures of the GF reinforced blends were drastically increased showing a value of 91.4 °C at 20 wt% GF loading. The high performance reached by the biomass-based composites developed in this research shows great possibility of replacing these conventional petroleum-based polymer systems.
1. Introduction
As one of the most important renewable polyesters, PLA has received considerable attention due to its excellent mechanical properties and biodegradability.1–3 In spite of this interest, PLA is severely limited in its development and application in a variety of fields due to its inherent brittleness, poor thermal stability and low ductility nature. To enhance the mechanical and thermal performance of PLA, modifications such as copolymerization,4,5 blending,6,7 plasticization,8 and the incorporation of reinforcements9,10 have been made. Among these, blending is one of the methods that can effectively improve the physical properties of PLA. Recently numerous studies have been conducted focusing on methods to improve the interfacial adhesion between two polymers. Wang et al. reported the PLA/poly(butylene adipate-co-terephthalate) (PBAT) having high strength and high toughness via a melting-reactive blending method with the use of a multi epoxy compatibilizer.11 In the study, they demonstrated an impact strength of 29.6 kJ m−2 for 60/40 blends of PLA and PBAT prepared via reactive compatibilization, which corresponds to 12.3 times that of PLA. Through the notched impact strength test, the authors confirmed the improvement in crack propagation properties, however, did not address crack initiation characteristics. In a previous study, we reported toughened PLA and poly(1,4-cyclohexanedimethylene isosorbide terephthalate) (PEICT) blends prepared via reactive compatibilization with the aid of glycidyl methacrylate oligomer (GMA).12 PEICT is a newly commercialized co-polyester containing isosorbide and 1,4-cyclohexane which result in transparency and high impact resistance. According to the results of our study, PLA achieved 44.11 kJ m−2 in an unnotched impact strength test, which was related to crack initiation, when it was reactively compatibilized with PEICT at a ratio of 60![[thin space (1/6-em)]](https://www.rsc.org/images/entities/char_2009.gif) :
:![[thin space (1/6-em)]](https://www.rsc.org/images/entities/char_2009.gif) 40.
40.
Short fiber reinforced polymers are cost effective and relatively easy to produce making them an attractive method in improving the properties of polymer materials.13,14 Short fiber reinforced polymers are conventionally produced using melt compounding or in situ polymerization which is advantageous for mass scale industrial applications. However, the performance of short fiber reinforced polymers is greatly altered by dimension and orientation of the fiber limiting their structural applications compared with continuous fiber reinforced composites. Short fiber reinforced composites are generally used to enhance the properties of high-performance commodity polymers to reach the performance of engineering plastics or to further enhance the properties of engineering plastics.
Synthetic fibers such as glass fibers or carbon fibers show outstanding mechanical properties and have been extensively studied as filler material for PLA.15,16 Although nano fibers such as carbon nanotubes and carbon nanofibers show superior mechanical properties, they are expensive in cost and aggregation in the polymer matrix remains a challenge. On the other hand, glass fibers have excellent mechanical properties and their dispersion in polymer matrix is relatively well established. Moreover, the glass fiber industry is highly developed giving glass fibers low costs and abundance in supply.17
Glass fiber reinforced PLA have been extensively studied for tissue engineering applications. For such applications phosphate glass fibers are used due to the similar compositions with bone structure.18 These studies focus on the cyto-compatibility and mechanical properties of the composites. In comparison the use of E-glass fibers (E-glass) are less reported in these studies the improvement of mechanical strengths to replace conventional industrial polymers was the main objective. Varsavs et al. investigated the enhanced ductility and toughness of glass fibers on PLA and thermoplastic polyurethane blends.19 Lin et al. PLA/PC blend reinforced with GF and reached 200% increased notched Izod impact strength.20 Lu et al. enhanced the tensile strength of PLA/HDPE blends.21 Wang et al. prepared PLA/GF composites with significantly increased impact strength and explored its foamability.22 However, no research has been conducted so far to improve both crack propagation and crack initiation properties of PLA.
Herein, improvements to the crack propagation and initiation properties and heat deflection temperature of PLA were attempted by using GF as reinforcements for PLA/PEICT blends. To ensure good interfacial adhesion organic silane sized GF targeted for polycarbonate, polybutylene terephthalate, and polyethylene terephthalate was selected. The PLA/PEICT/GF composites exhibited enhanced fracture failure and thermal properties showing a promising potential for replacing ABS/GF composites.
2. Experimental
2.1 Materials
PLA (Ingeo 2003D), PEICT (Ecozen T90), and GMA (JONCRYL ADR4468) was purchased from NatureWorks (USA), SK Chemicals (Korea), and BASF (Germany) respectively. Silane modified e-glass chopped fiber (GF) (CS321) was purchased from KCC. The average diameter and length of the pre-compounded GF was 10 μm and 3 mm.2.2 Preparation of PLA/PEICT/GF composites
To remove any moisture, PLA, PEICT, and GF were dried at 80 °C for 12 h prior to processing. After drying the components were melt compounded using a co-rotating twin screw extruder (BA-19, Bautek, Korea) with a length/diameter (L/D) ratio of 40 and a screw diameter of 19 mm. PLA, PEICT and GMA were fed through the main feeder and GF was fed separately through a side feeding system to ensure minimum shear breakage of GF. The ratio of the PLA/PEICT/GMA was fixed and the ratio of GF to the blend components were varied as listed in Table 1. The individual heating zones of the extruder were set to 190, 220, 230, 230, 230, 230, 220, and 210 °C from hopper to die. The screw speed was set at 100 rpm and a sufficient distance between the main feeding system and the side feeding system was calculated to ensure at least 80 seconds of residence time for the completion of in situ reaction. The extrudate strand was immediately cooled in a water bath and cut to appropriate size for further processing using a pelletizer.| Designations | PLA | PEICT | GMA | GF |
|---|---|---|---|---|
| PLA | 100 | 0 | 0 | 0 |
| PEICT | 0 | 100 | 0 | 0 |
| PLA/PEICT | 60 | 39.25 | 0.75 | 0 |
| PLA/PEICT/GF5 | 57 | 37.2875 | 0.7125 | 5 |
| PLA/PEICT/GF10 | 54 | 35.325 | 0.675 | 10 |
| PLA/PEICT/GF15 | 51 | 33.3625 | 0.6375 | 15 |
| PLA/PEICT/GF20 | 48 | 31.4 | 0.6 | 20 |
After compounding the prepared samples were dried in a convection oven at 80 °C for 12 h and sealed in vacuum bags till further analysis. For the preparation of test specimen, the samples were injection molded using WIZ50E (LS Mtron, Korea) 50 tons electric injection molding machine. A three-cavity mold with two rectangular bars with dimension 130 × 13 × 3 mm3 and a dumbbell shaped test specimen following ASTM D638 type I was employed. Injection molding parameters including melt temperature, mold temperatures injection speed, packing pressure, and packing time were 230 °C, 30 °C, 80 mm s−1, 88 MPa, and 7 s, respectively.
2.3 Characterization
The length of GF after melt processing were investigated by dissolving the PLA/PEICT/GF composite in chloroform. The solution was then observed using a Keyence USA VHX 5000 optical microscope. The length of at least 100 GF was measured for each sample using the internal software of the microscope. The mechanical performance of the PLA/PEICT/GF composites were evaluated by conducting tensile, flexural, and Izod impact tests at least ten specimens were tested for each test and the average values and standard deviations were acquired for each sample. Tensile tests conducted following ASTM D638 using a Instron 4465 (UK) universal testing machine fixed with 10 kN loadcell. The head speed rate of the tensile measurements was equal to the length of the tensile specimen described in ASTM D638 type I. Flexural tests were conducted by the three point bending method following ASTM D790 using MCT 1150 (AND, Japan) testing machine fitted with 500 N load cell due to limits set by the testing machine the tests were conducted with a crosshead speed of 10 mm min−1. Izod impact tests were conducted using WL2200D (Withlab Korea) testing machine with impact energy of 6 J and impact speed of 3.46 m s−1. For a thorough understanding of the impact failure mechanics both notched (ASTM D256 test method A) and reversed notched Izod impact tests (ASTM D256 test method E) were performed. The morphologies of the cryo-fractured surfaces and impact fractured surfaces were investigated using scanning electron microscopy (SEM) (JSM-6340F, JEOL, Japan). Dynamic mechanical analysis (DMA) was conducted in dual cantilever mode using a Q800 DMA apparatus (TA Instrument). The measurements were carried out through 25–140 °C with a heating rate of 2 °C min−1 at a constant frequency of 1 Hz with amplitude of 20 μm. The heat deflection temperatures (HDT) were determined from the storage modulus according to the correlations established by Takemori.23 Thermogravimetric analysis (TGA) was performed using a Pyris 1 TGA (PerkinElmer, USA) over a temperature range of 30–800 °C and a heating rate of 10 °C min−1. The thermal degradation was performed under a constant nitrogen flow of 100 mL min−1 to ensure a completely nonoxidative thermal degradation.3. Results and discussion
3.1. Morphology of PLA/PEICT/GF composites
The SEM images of the cryo-fractured surfaces of the PLA/PEICT/GF composites and the length distribution of the processed GF are shown in Fig. 1. The properties of polymer composites are highly affected by the dispersion of the fillers in the matrix. The SEM images show relatively well dispersed GF with no noticeable agglomerates even at high GF loadings. The uniform distribution of GF in the polymer matrix gives evidence that the silane-sized GF has good compatibility with the PLA/PEICT blend. Good compatibility between matrix and filler indicates low interfacial tension between two components, which could benefit the final properties of the composites.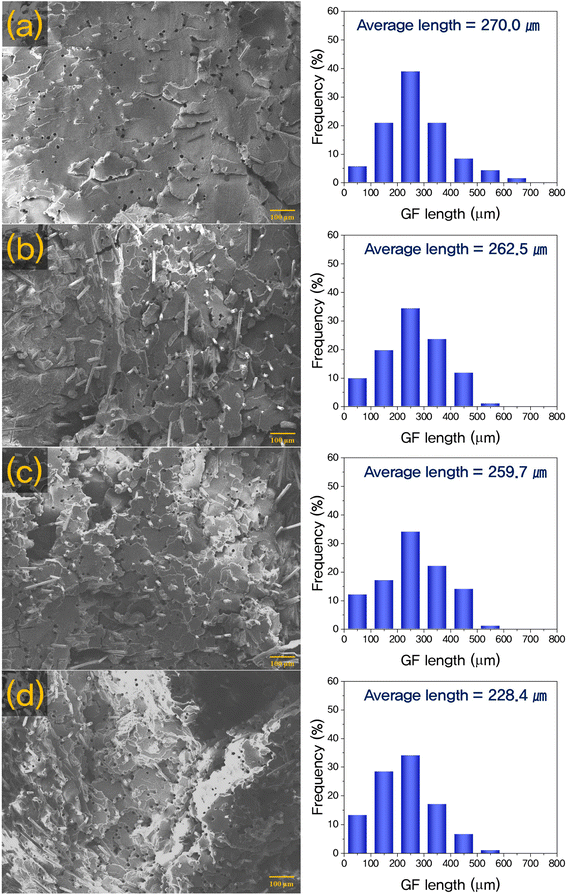 | ||
| Fig. 1 SEM images of cryo-fractured surfaces and GF length distribution of PLA/PEICT/GF 5 wt% (a), 10 wt% (b), 15 wt% (c), and 20 wt% (d) composites. | ||
The length by diameter ratio of the fiber in a fiber reinforced polymer composites is a key factor in the reinforcing ability of the fiber. As observable in the Fig. 1, the fiber length distribution of GF in the composites range from 10 to 600 μm. The distribution of fiber lengths shows that the majority of GF lengths range at 200–300 μm, while a significant increase in shorter fibers is observable at higher loadings. The average length of the GF at 5% loading is 270.0 μm and decreases gradually at higher loadings to 228.4 μm at 20% loading. The significant decrease in length from the original 3 mm to few hundred micrometers is due to the shear induced breaking during the twin screw extrusion. For higher loadings collision between the fibers may have accelerated the fiber breakage as reported in many studies.
3.2. Mechanical properties of PLA/PEICT/GF composites
The tensile properties of the GF reinforced PLA/PEICT composites are shown in Fig. 2(a)–(c). Both tensile strength and modulus increase linearly with the added GF content. As shown in Table 2, the tensile strength and modulus are increased to 96.39 MPa and 2.37 GPa at 20% loading from 62.75 MPa and 1.22 GPa of the pristine blends. The pronounced increase in the tensile properties is in good coherence with previous works19,22 where the strength and rigidity of the polymer matrix is greatly enhanced by GF. The reinforcing effect of the GF on the PLA/PEICT blends resulted from the decrease in mobility of the molecular chains and stress transfer from matrix to reinforcements. For such a reinforcing effect to come into play, sufficient interfacial adhesion between the matrix and reinforcing fiber is a prerequisite. Thus, showing that the silane sized GF had good compatibility with the PLA/PEICT blends.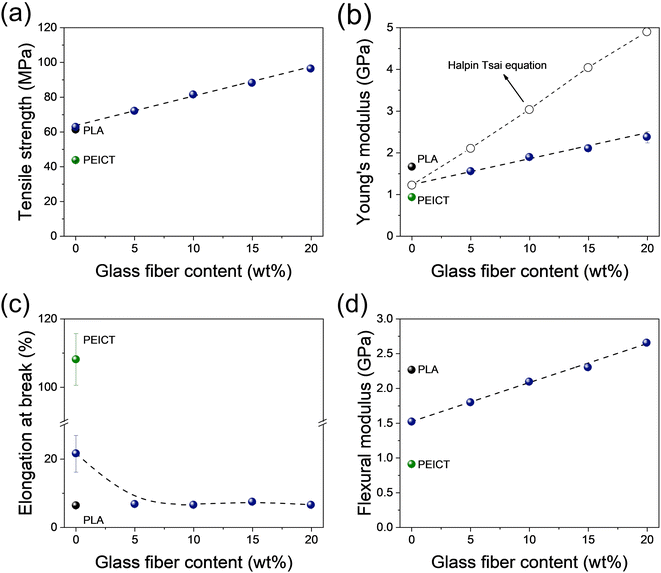 | ||
| Fig. 2 (a) Tensile strength, (b) Young's modulus, (c) elongation at break and (d) flexural modulus of PLA/PEICT/GF composites. | ||
| Young's modulus (GPa) | Tensile strength (MPa) | Elongation at break (%) | Flexural modulus (GPa) | |
|---|---|---|---|---|
| PLA | 1.66 ± 0.03 | 61.23 ± 0.61 | 6.32 ± 0.03 | 2.26 ± 0.01 |
| PEICT | 0.93 ± 0.01 | 43.59 ± 0.28 | 108.14 ± 7.58 | 0.91 ± 0.01 |
| PLA/PEICT | 1.22 ± 0.02 | 62.75 ± 0.68 | 21.58 ± 5.39 | 1.52 ± 0.01 |
| PLA/PEICT/GF5 | 1.55 ± 0.02 | 72.02 ± 0.26 | 6.72 ± 0.33 | 1.80 ± 0.04 |
| PLA/PEICT/GF10 | 1.89 ± 0.05 | 81.47 ± 0.58 | 6.49 ± 0.33 | 2.09 ± 0.02 |
| PLA/PEICT/GF15 | 2.10 ± 0.07 | 88.2 ± 0.68 | 7.39 ± 0.39 | 2.30 ± 0.02 |
| PLA/PEICT/GF20 | 2.37 ± 0.14 | 96.39 ± 1.43 | 6.48 ± 0.24 | 2.66 ± 0.02 |
Theoretical models on the reinforcing effect of fibers are an efficient method to predict the expected properties of composites. The Halpin–Tsai model includes the morphological properties of the reinforcements making it an adequate tool for GF reinforced composites. The Halpin–Tsai equation can be expressed as follows:24
where Ec, Em, and Er are the modulus of the composite, matrix, and reinforcements respectively. The shape factor ξ is expressed in the following equation
where l and d are the length and diameter of the reinforcement respectively. The volume fraction Vr of the reinforcement was estimated using the following equation and the volume taken up by void within the composite was neglected.
where wr is the weight fraction of the reinforcement, ρr and ρm are the densities of the reinforcements and matrix. Experimental values were used for the modulus of the matrix (Em) and the length of the reinforcements (l). The rest of the values were taken from known values ρr = 2.58 g cm−3, ρm = 1.24 g cm−3, and Er = 76 GPa.
The calculated theoretical values are compared with the experimental data in Fig. 2(b). Significant deviation is observable between the experimental values and theoretical predictions, which increases with GF content. However, both values show linear behavior and the difference between the two values is also linear. The cause for such results could be speculated from the imperfect stress transfer between the reinforcement and matrix.
The elongation at break of the PLA/PEICT/GF composites is described in Fig. 2(c). Typically, GF reinforced polymer composites show a tendency to lower elongation at break with increasing GF content. It is due to the fact that the rigid GF is not ductile compared to the polymer matrix, which restricts the composites from deforming before breaking.25 It is remarkable that the elongation at break decreased with the addition of GF to PLA/PEICT, while ductility still remained higher than that of PLA.
The flexural modulus of the PLA/PEICT/GF composites is depicted in Fig. 2(d). The flexural modulus of the blends linearly increases with the GF contents and the tendency is coherent with the tensile values. As shown in Table 2, at 20 wt% GF loading the flexural modulus of the blends reach up to 2.66 GPa which is 75% higher than that of the pristine blend. In addition, the flexural modulus surpasses that of pristine PLA 2.26 GPa from 15 wt% GF loading. The increase in flexural modulus of the blends can be attributed to the stiff nature of GF and mechanical anchoring effect.26 Furthermore, the high interfacial adhesion between the GF and PLA/PEICT blends contributed to stress transfer leading to enhanced flexural modulus.
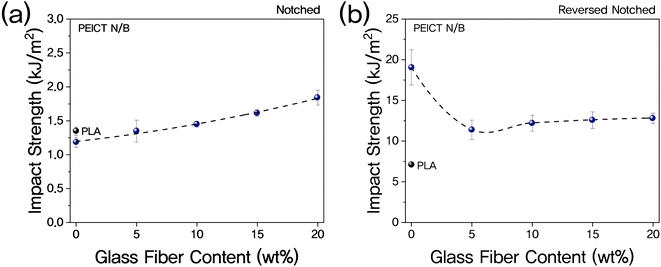
The fracture mechanics of the PLA/PEICT/GF composites were studied by notched and reversed notched Izod impact tests, as shown in Fig. 3. As observed in Fig. 3(a), the notched impact strength linearly increases with increasing GF contents. The notched impact strength shows similar linear increase behavior to the tensile properties. Such behavior could be related to the crack opening mode during crack propagation in fracture mechanics where the force is transferred toward the perpendicular direction (tensile load) of impact. Notched impact strength reached 1.841 kJ m−3 for at 20 wt% GF loading which is about 55% increase from 1.184 kJ m−3 of the pristine PLA/PEICT blends. This improvement related to crack deflection, debonding, and pull-out mechanism of fiber reinforcements, which reduce crack propagation rates. Comparing the pristine PLA/PEICT blend and PLA, it is observable that the crack propagation rates are clearly corelated to the Young's modulus, where the Young's modulus of PLA/PEICT blend is about 75% of the pristine PLA and the notched impact strength is about 85%. Even with the lower crack propagation performance of PLA/PEICT blends, the GF reinforced composites surpassed the notched impact strength of PLA from 10 wt% GF loading.
The reversed notched impact strength in Fig. 3(b) shows that the reversed notched impact strength of PLA/PEICT is 170% higher than that of PLA. This result which is consistent with our previous finding is due to the energy dissipation through the ductile PEICT in the blends.12 However, with the addition of GF the reversed notched impact strength decreases considerably from 19.083 kJ m−3 of the pristine blend to 11.379 kJ m−3 at 5 wt% GF loading. The reason for this drastic decrease in reversed notched impact strength of the PLA/PEICT/GF composites could be speculated from the rigidness and the relatively low compatibility of GF than PEICT. In addition, the GF fibers in the composite could have hindered the energy dissipation to PEICT. With higher GF loadings a linear increase in the reversed notched impact strength is observable. As both shear and tensile forces act in the reversed notched impact, this phenomenon could be attributed to the tensile component of the crack initiation.
The impact fractured surfaces of the PLA/PEICT/GF composites are shown in Fig. 4. The fracture surface was observed at the center of the specimen along the flow direction. The high shear force, resulting from high-speed flow during injection molding, causes the GF to align along the injection direction as shown in Fig. 4. Therefore, a perpendicular force is applied to the GF during impact fracture. However, the GF in Fig. 4 are parallel to the impact direction which is due to the weaker shear flow at the center.27,28 As the GF loading increases this phenomenon is more pronounced. The dominant flow associated at the center of the molds is fountain flow leading to this parallel orientation of GF. The fractured surfaces of PLA and PEICT show smooth clean surfaces, while the PLA/PEICT/GF composites show much rougher surfaces. These rough surfaces are more prominent along the GF which is caused by fiber pull-out during fracture. Fiber pull-out is one of the major components of energy consumption during fracture mechanics in fiber reinforced composites. In addition, the majority of the fibers have been pulled out of the PLA/PEICT matrix demonstrating that fiber pull-out is the main failure mechanism. For fibers that have not been pulled out it is noticeable that the polymer matrix around it show signs of tearing. This indicates the presence of strong interfacial adhesion between the PLA/PEICT blend and GF. Accordingly, it can be concluded that the silane sizing was effective in compatibilizing the GF with the matrix, in addition, the improved interfacial adhesion significantly enhanced the impact strength of the composites.
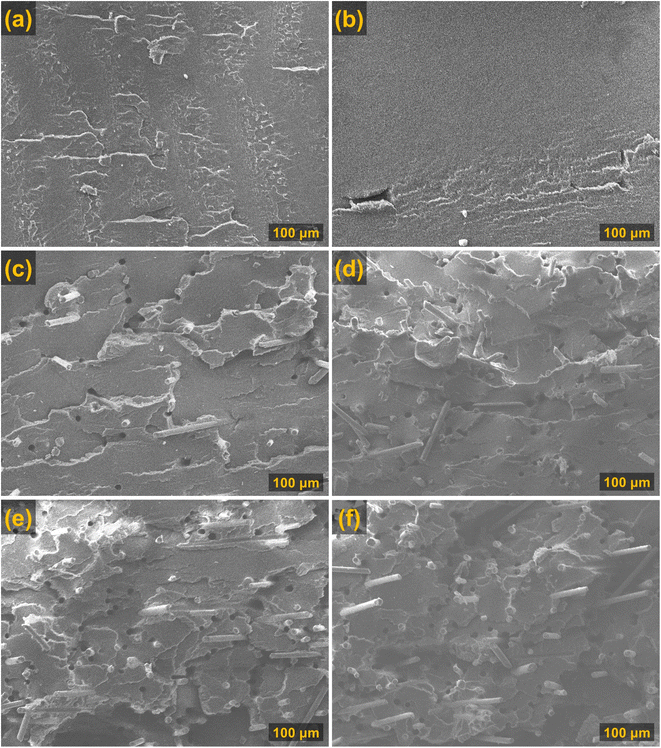 | ||
| Fig. 4 Impact fractured surfaces of (a) PLA, (b) PLA/PEICT, (c) PLA/PEICT/GF5, (d) PLA/PEICT/GF10, (e) PLA/PEICT/GF15, and (f) PLA/PEICT/GF20. | ||
3.3. Dynamic mechanical thermal analysis of PLA/PEICT/GF composites
Dynamic mechanical and thermal analysis were conducted on samples, and the storage modulus (G′) and loss tangent (tan δ) against temperature are plotted in Fig. 5. Initially all G′ values are at level at a relatively high value until reaching a certain temperature the G′ values show a drastic decrease. This decrease is more drastic for the pristine polymers PLA and PEICT where they reach the lowest G′ values. For the blend and their composites, the drastic decrease levels at about 70 °C and a plateau region is formed till 90 °C. At temperatures above 90 °C the G′ values decrease and reach a low-level plateau. These sudden drop in G′ indicates the transition from glassy to rubbery state. For the blended samples, these transitions appear for each polymer component.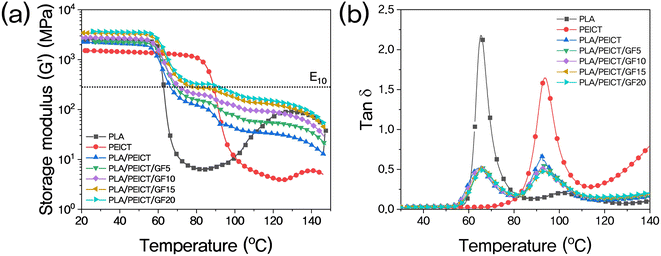 | ||
| Fig. 5 Storage modulus (G′) (a) and loss tangent (tan δ) (b) plotted against temperature of PLA, PEICT, PLA/PEICT blend, and PLA/PEICT/GF composites. | ||
The addition of GF increases the G′ in all temperature ranges showing that GF is an effective reinforcement. The enhanced G′ throughout the entire temperature range is due to the significantly higher transition temperature of GF than that of the polymer matrix. Furthermore, G′ is increases with increased GF content which is a synergetic effect of good dispersion of GF and good interfacial adhesion between the polymer matrix and GF. At lower temperatures, the increase in G′ is comparably greater when GF loading is increased from 10 wt% to 15 wt%. This phenomenon could be attributed to formation of GF network structures. As GF concentration increases to 20 wt% the increase in G′ is stalled giving further evidence to the formation of GF network and that the GF concentration has reached the percolation threshold.
In Fig. 5(b) the tan δ of the samples are presented, at low temperatures the internal damping remains at zero with tan δ values at zero. At elevated temperatures tan δ increases rapidly showing a transition from glassy to rubbery state. The temperature at tan δ peaks is commonly interpreted as glass transition temperatures (Tg). The Tg of PLA and PEICT appear at 65.5 °C and 94.0 °C respectively as shown in Table 3. For the PLA/PEICT blends and their composites the tan δ show two peaks corresponding to PLA and PEICT. For the PLA/PEICT/GF the Tg related to PLA appear at slightly elevated temperatures and the Tg related to PEICT appear at decreased temperatures with the addition of GF. However, comparing the size GF to the molecular segments related to Tg, GF is too macro to interfere with the molecular mobility.29 Although some reports take focus on the increase and decrease of Tg, the shifts appearing in this study are within error range. Therefore, these shifts could be inferred as results of difference in thermal conductivity of GF and the polymer matrix.
| Tg (°C) | HDT (°C) | ||
|---|---|---|---|
| PLA | PEICT | ||
| PLA | 65.5 | 63.0 | |
| PEICT | 94.0 | 89.2 | |
| PLA/PEICT | 64.7 | 92.4 | 66.5 |
| PLA/PEICT/GF5 | 66.1 | 94.2 | 69.3 |
| PLA/PEICT/GF10 | 65.3 | 92.8 | 71.2 |
| PLA/PEICT/GF15 | 65.9 | 93.6 | 78.3 |
| PLA/PEICT/GF20 | 66.1 | 93.5 | 91.4 |
The heat deflection temperature (HDT) was calculated using the correlations established by Takemori from the storage modulus operated at dual cantilever mode.23 According to Takemori the HDT values of a standard ASTM HDT specimen could be interpreted as the temperature where the tensile modulus (E10) reaches 0.75 GPa. This value can be extrapolated to the shear modulus (G′) of dual cantilever DMTA by using the following equation.
| E = 2(1 + v)G |
The established HDT values of PLA, PEICT, PLA/PEICT blend, and PLA/PEICT/GF composites are shown in Table 3, and their relations are plotted in Fig. 6. It can be observed that the PLA/PEICT blends show a slight increase in HDT compared to PLA, which is the effect of PEICT's higher transition temperature. The addition of GF increases the HDT of the blends with increasing GF contents. At 20 wt% GF loading the HDT reaches 91.4 °C, considering the HDT of pristine PLA, PEICT, and PLA/PEICT are 63.0 °C, 89.2 °C, and 66.5 °C respectively, this value is quite significant. The increase in the HDT by GF is the result of the rigid fibers resisting the deformation under load.30 According to Wang et al. PLA/GF composites with 20 wt% GF increased the HDT of pristine PLA increased the HDT by 3 °C. This result is comparable to PLA/PEICT/GF20 composites where the HDT is increased by 28 °C from pristine PLA. This result is due to the enhancement in storage modulus by GF for both PLA and PEICT dominant regions as observed in Fig. 5. Moreover, these results show that the silane sized GF had good interaction with both PLA and PEICT.
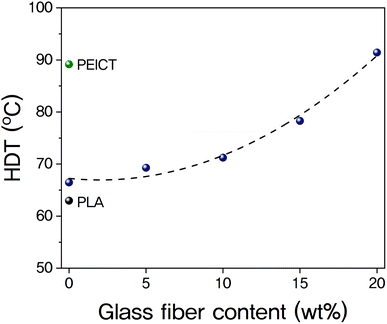 | ||
| Fig. 6 HDT of PLA, PEICT, PLA/PEICT blend, and PLA/PEICT/GF composites determined by Takemori's correlation. | ||
3.4. Thermal degradation properties of PLA/PEICT/GF composites
The thermal stability of the PLA/PEICT/GF composites was investigated using TGA (Fig. 7). The precise weight percent of the loaded GF can be determined using TGA due to the high degradation temperature of GF. The residual mass of the PLA/PEICT/GF in Fig. 7(a) show that the blend compositions were relatively precise leaving respective residual mass for each loading. This result also demonstrates that the GF was well dispersed in the matrix. The maximum degradation temperatures of the specimens are listed in Table 4. The blends show two maximum degradation rates representing the degradation of PLA and PEICT. With the addition of GF the temperature at peak degradation rate tends to shift to higher temperature than the pristine blends. This phenomenon is independent of the GF content, therefore could have been the result of a difference in thermal conductivity.31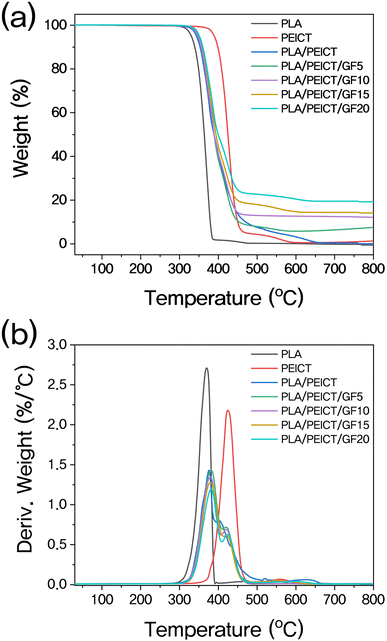 | ||
| Fig. 7 TGA (a) and DTGA (b) thermograms of PLA, PEICT, PLA/PEICT blend, and PLA/PEICT/GF composites. | ||
| Tdm (°C) | ||
|---|---|---|
| Step 1 | Step 2 | |
| PLA | 371.2 | |
| PEICT | 425.7 | |
| PLA/PEICT | 377.5 | 405.5 |
| PLA/PEICT/GF5 | 382.6 | 421.5 |
| PLA/PEICT/GF10 | 381.6 | 421.7 |
| PLA/PEICT/GF15 | 380.5 | 422.4 |
| PLA/PEICT/GF20 | 383.0 | 425.4 |
4. Conclusion
The PLA/PEICT/GF composites were prepared by in situ reactive melting compounding and injection molding. Due to the high shear force generated during the processing process, the glass fibers were oriented in the direction of flow. As predicted by the Halpin–Tsai equation, glass fiber generally reinforced the PLA/PEICT matrix. As the glass fiber content increased, the tensile and flexural properties of the PLA/PEICT/GF composites improved, and DMTA analysis revealed that the storage modulus increased in all temperature ranges. It was confirmed that the relatively large size of the glass fiber did not influence molecular motion, since no change in the temperature of the glass transition was observed in the PLA/PEICT/GF composites. In terms of impact resistance, it was confirmed that the addition of glass fibers reduced crack initiation force, but was effective at suppressing crack propagation, which could be attributed to the improved modulus of elasticity. GF reinforced composites, however, showed improved crack propagation and initiation characteristics compared to pristine PLA. Moreover, the addition of glass fiber greatly improved the heat deflection temperature of the PLA/PEICT blend, which reached the maximum value of 91.4 °C in PLA/PEICT/GF20 sample. The PLA/PEICT/GF composite newly presented in this study demonstrated high impact strength and thermal properties that were comparable to high impact strength polystyrene (HIPS) and acrylonitrile butadiene styrene copolymer (ABS). As these polymers are actively used in the automobile and electronics industries, the biomass-based polymer composite prepared in this study has considerable potential as a substitute for petrochemical-based polymers.Author contributions
J. H. L. conceptualized this work, analyzed the data, prepared the figures, and wrote the manuscript. C. K. P. performed the experiments and measured performances and wrote the manuscript. S. H. K. managed the concept and supervised this work.Conflicts of interest
There are no conflicts to declare.Acknowledgements
This research was supported by Basic Science Research Program through the National Research Foundation of Korea (NRF) funded by the Ministry of Education (2016R1A6A1A03013422, 2021R1A6A3A01086560, and RS-2023-00249477).References
- J. H. Lee, S. H. Park and S. H. Kim, Macromol. Res., 2014, 22, 424–430 CrossRef CAS.
- J. H. Lee, S. H. Park and S. H. Kim, Macromol. Res., 2013, 21, 1218–1225 CrossRef CAS.
- X. Yu, X. Wang, Z. Zhang, S. Peng, H. Chen and X. Zhao, Polym. Test., 2019, 78, 105980 CrossRef.
- H. Xu, J. Zhou, K. Odelius, Z. Guo, X. Guan and M. Hakkarainen, ACS Appl. Polym. Mater., 2021, 3, 1973–1982 CrossRef CAS.
- N. Zhang, M. Zhao, G. Liu, J. Wang, Y. Chen and Z. Zhang, J. Mater. Sci., 2022, 57, 8687–8700 CrossRef CAS.
- H. Liu, N. Chen, C. Peng, S. Zhang, T. Liu, P. Song, G. Zhong and H. Liu, Macromolecules, 2022, 55, 7695–7710 CrossRef CAS.
- J. L. Olmedo-Martínez, L. Porcarelli, G. Guzmán-González, I. Calafel, M. Forsyth, D. Mecerreyes and A. J. Müller, ACS Appl. Polym. Mater., 2021, 3, 6326–6337 CrossRef.
- W. Xuan, K. Odelius and M. Hakkarainen, Eur. Polym. J., 2021, 157, 110649 CrossRef CAS.
- J. H. Lee, S. H. Park and S. H. Kim, Polymers, 2020, 12, 178 CrossRef CAS PubMed.
- J. H. Lee, S. H. Park, S. H. Kim and H. Ito, Polym. Test., 2020, 83, 106321 CrossRef CAS.
- X. Wang, S. Peng, H. Chen, X. Yu and X. Zhao, Composites, Part B, 2019, 173, 107028 CrossRef CAS.
- C. K. Park, D. J. Jang, J. H. Lee and S. H. Kim, Polym. Test., 2021, 95, 107136 CrossRef CAS.
- Y. Yuryev, A. K. Mohanty and M. Misra, Composites, Part B, 2017, 130, 158–166 CrossRef CAS.
- M. Yang, W. Li, Y. He, X. Zhang, Y. Li, Z. Zhao, P. Dong, S. Zheng and L. Wang, Compos. Sci. Technol., 2021, 213, 108905 CrossRef CAS.
- W. Ye, H. Dou, Y. Cheng, D. Zhang and S. Lin, Polym. Compos., 2022, 43, 7428–7437 CrossRef CAS.
- A. Moslehi, A. Ajji, M. C. Heuzey, A. Rahimizadeh and L. Lessard, J. Appl. Polym. Sci., 2022, 139, 51934 CrossRef CAS.
- G. Yang, M. Park and S.-J. Park, Compos. Commun., 2019, 14, 34–42 CrossRef.
- L. He, X. Liu and C. Rudd, Polymers, 2021, 13, 270 CrossRef CAS PubMed.
- S. D. Varsavas and C. Kaynak, Compos. Commun., 2018, 8, 24–30 CrossRef.
- L. Lin, C. Deng, G.-p. Lin and Y.-h. Wang, Polym.–Plast. Technol. Eng., 2014, 53, 613–625 CrossRef CAS.
- X. Lu, L. Tang, L. Wang, J. Zhao, D. Li, Z. Wu and P. Xiao, Polym. Test., 2016, 54, 90–97 CrossRef CAS.
- G. Wang, D. Zhang, G. Wan, B. Li and G. Zhao, Polymer, 2019, 181, 121803 CrossRef CAS.
- M. T. Takemori, Polym. Eng. Sci., 1979, 19, 1104–1109 CrossRef CAS.
- J. H. Affdl and J. Kardos, Polym. Eng. Sci., 1976, 16, 344–352 CrossRef.
- M. Delgado-Aguilar, F. Julián, Q. Tarrés, J. Méndez, P. Mutjé and F. Espinach, Composites Part B, 2017, 125, 203–210 CrossRef CAS.
- D. S. Cousins, C. Lowe, D. Swan, R. Barsotti, M. Zhang, K. Gleich, D. Berry, D. Snowberg and J. R. Dorgan, J. Appl. Polym. Sci., 2017, 134, 1–12 CrossRef.
- F. Ansari, L. A. Granda, R. Joffe, L. A. Berglund and F. Vilaseca, Composites, Part A, 2017, 96, 147–154 CrossRef CAS.
- G. Wang, G. Zhao and X. Wang, Mater. Des., 2013, 46, 457–472 CrossRef CAS.
- A. N. Frone, S. Berlioz, J.-F. Chailan and D. M. Panaitescu, Carbohyd. Polym., 2013, 91, 377–384 CrossRef CAS.
- T. Yu, J. Ren, S. Li, H. Yuan and Y. Li, Composites Part A, 2010, 41, 499–505 CrossRef.
- D. J. Jang, J. H. Lee, J. J. Lee, J. E. Hyun and S. H. Kim, Polymer, 2022, 125597 Search PubMed.
Footnote |
| † Both authors contributed equally to this work. |
| This journal is © The Royal Society of Chemistry 2023 |


