DOI:
10.1039/D3RA01762A
(Paper)
RSC Adv., 2023,
13, 12100-12113
In situ hydrogen production from hydrocarbon reservoirs – modelling study
Received
17th March 2023
, Accepted 31st March 2023
First published on 18th April 2023
Abstract
The use of hydrogen is gaining reputation because of its many beneficial properties to the environment in comparison to hydrocarbon not minding its net energy requirement for production challenges. With most countries adopting a strategy to achieve their net-zero emissions targets, it becomes much more important to find affordable, low-carbon ways of producing hydrogen. An innovative method of producing hydrogen from hydrocarbon reservoirs while keeping the associated by-products in the reservoir has been demonstrated researchers from the University of Calgary. However, in this study, a framework for designing an in situ combustion model that considers four key hydrogen forming reactions – steam reforming, partial oxidation, autothermal reforming and pyrolysis, was developed. A set of non-linear equations obtained from chemical equilibrium analysis of the hydrogen forming reactions were solved using a Newton-Jacobi interation. Analysis of the change in Gibbs free energy of each reaction were then used as a screening tool for implementing a numerical model. Results obtained from the combustion model were then validated against results obtained from thermal reservoir simulator CMG STARS. Results from the model reveal an upward trending sinusoidal relationship between steam-carbon ratio and the amount of hydrogen yield from an in situ hydrogen production study. The combustion model could be used as a framework to design experimental analysis.
1 Introduction
Hydrogen can be obtained by converting the hydrocarbons in situ through thermal combustion reactions taking place at the reservoir conditions.1–3 This process also known as in situ hydrogen production (IHP) and is an adaptation of the technology pioneered by researchers at the University of Calgary and commercialized by Proton Technologies Canada Inc.4 The word “in situ” means on site and denotes that the conversion process occurs at the hydrocarbon reservoir. Hydrogen produced by this technology is termed Aqua hydrogen. Aqua as a colour is obtained when green and blue colour are mixed. As the name implies, the aqua hydrogen pathway involves hydrogen production from hydrocarbon, but in a process that is entirely different from blue hydrogen pathway. During in situ hydrogen production, oxygen-enriched air, is injected into a hydrocarbon-bearing reservoir, and because of the elevated temperature of the reservoir the air–oil mixture is ignited to begin combustion.5,6 Ignition can be achieved by a variety of mechanisms or processes, including auto-ignition, gas burners, electrical heaters, and chemical reactions.7–10 This reaction produces heat which leads to further hydrogen forming reactions: aquathermolysis, thermolysis, coke gasification, the water–gas shift reaction and methanation.11
Hydrogen and other valuable gas are then extracted from the subsurface through permeable membranes leaving CO2 and other unwanted gases in the reservoir. The strongest appeal of this pathway is that the CO2 produced are separated from source point and dedicated facilities for CO2 transport and storage are not required.12 However, the compromise for this advantage is that conversion efficiency can be very low and there is little control over the chemical reactions taking place at the subsurface. Another important limitation of this technique is that significant heat is lost to the surrounding reservoir. The process description of the technique developed by Gates & Wang, (2017)1 is captured in Fig. 1. The set-up consists of two horizontal Wells; one of the Wells serve as an Injection Well while the other as a Production Well. The penetration depth of the Production Well is designed to be lower than that of the Injection Well. In the first stage, oxygen is introduced into the reservoir through the Injection Well, while the Production Well remains shut. The injected oxygen initiates combustion reactions at the reservoir. In stage 2, both Wells are shut-in to allow further hydrogen forming reactions (water–gas shift, aquathermolysis and gasification) to develop. As these reactions continue at the reservoir, hydrogen formed (being lighter in density) migrates towards the Production Well. In stage 3, electromagnetic/radio frequency waves are used to propagate the combustion zone and extend reactions happening in stage 2. Then the Production Well (fitted with membrane) is opened to allow for hydrogen production.
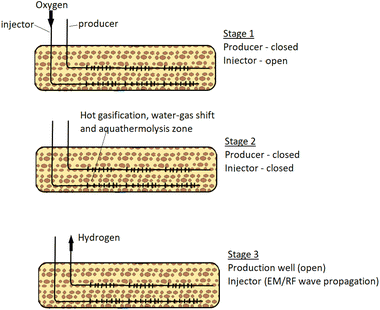 |
| | Fig. 1 In situ hydrogen production process adapted from (Gates & Wang, 2017).1 | |
2 Chemistry of in situ hydrogen production
To understand how this technique can be applied for light oil reservoirs, the chemistry of reactions favouring hydrogen production needs to be appreciated. All hydrogen production from hydrocarbons requires the presence of some or all of these three keys elements: water (steam), oxygen and heat.1,13 At reservoir conditions, water exist in combination other salts in the form of brine, heat is present but not in sufficient quantity to initiate hydrogen forming reactions while oxygen is absent. When oxygen is introduced to the reservoir, the following hydrogen forming reactions are anticipated during in situ combustion.
2.1 Partial oxidation (POX)
Partial oxidation reaction generates hydrogen by partially burning hydrocarbons in the presence of oxygen and steam.14 It is an exothermic reaction because the heat produced during the reaction is supplied by oxidizing some of the hydrocarbon. If sufficient oxygen is introduced, complete combustion will yield principally CO2 and H2O. Consequently, by controlling the quantity of oxygen injected, incomplete oxidation occurs and chemical equilibrium favours production of H2 and CO. For all hydrocarbons, the partial oxidation reaction is idealized in two parts. The first part is given by eqn (1)| |
 | (1) |
For an ideal product mixture of CO and H2, it is deduced that the optimum oxygen to carbon ratio is 0.5 i.e., one mole of hydrocarbon requires approximately 1/2 moles of oxygen. The second part involves reaction with steam to oxidize the CO into CO2. The amount of steam added to the product gas from eqn (1) is designed to attain a steam to carbon ratio of approximately 1 as shown in eqn (2).
| |
 | (2) |
2.2 Steam reforming (SR)
Steam reforming involves reaction between steam and hydrocarbon in the presence of heat. Steam reforming is strongly endothermic meaning that an external heat source is required. Steam reforming of hydrocarbons is the most used method of hydrogen production accounting for about 96% of all hydrogen produced.15,16 Although, catalysed steam reforming operates at much lower temperature, uncatalyzed steam reforming generally occurs at a temperature range of 820–880 °C. The most significant difference between POX and SR is that in SR the oxygen to carbon ratio is approximately zero whereas in POX is almost 0.5. In addition to this, for SR the steam to carbon ratio is much higher (almost double) than that required for POX reaction. The SR process can be ideally modelled by eqn (3):| |
 | (3) |
2.3 Autothermal reforming (ATR)
The combination of Steam Reforming (SR) and Partial Oxidation (POX) leads to Autothermal Reforming. In POX, hydrocarbon is first oxidized before reacting with steam, also SR, the hydrocarbon reacts with steam at high temperature to yield hydrogen. However, in ATR, all three components (steam, hydrocarbon, and oxygen) react at the same time. Hypothetically, the oxygen-to-carbon ratio in an ATR ought not to exceed 1 while the steam-to-carbon ratio ought not to exceed 2. ATR reactions are temperature and composition sensitive. This implies that under certain conditions of temperature, and steam/oxygen composition, thermo-neutral condition of the ATR of hydrocarbons can occur. The general reaction for the ATR process is given by eqn (4).| |
 | (4) |
ATRs generally have the advantage of lower operating costs than other processes and the near thermodynamic neutral reaction makes it better alternative for reforming gas to liquid hydrocarbons.15,17 In addition, CO2 generated during the ATR process can be easily separated out and studies reports that CO2 capture rates up to 90%.18
2.4 Pyrolysis (PY)
In pyrolysis, hydrogen is produced by the decomposition of hydrocarbon into its constituent elements (solid carbon and hydrogen) under high temperature. At surface conditions, the pyrolytic process can be catalytically initiated, but at reservoir conditions focus on the uncatalyzed reactions. Although deposition of solid carbon in the form of Coke has the potential to alter reservoir rock property, it is anticipated that hydrogen produced via this process eliminates the need for secondary reactions. For heavier hydrocarbon undergoing pyrolytic process, the first products are usually smaller components of hydrocarbon.19 Because water and air are not involved in the pyrolysis process, CO or CO2 are not formed. This reduces the overall contribution to CO2 trapped within the subsurface during the in situ hydrogen process. The general equation for the pyrolysis reaction is given by eqn (5).| |
 | (5) |
A summary of the hydrogen forming reactions available during in situ hydrogen production process is captured in Fig. 2.
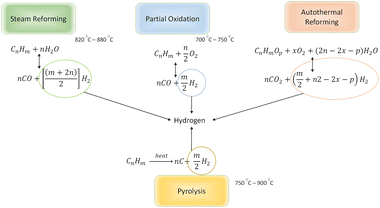 |
| | Fig. 2 Summary of hydrogen forming reactions for hydrocarbons. | |
3 Reservoir model
To investigate the feasibility of producing hydrogen in situ on a full-field reservoir model, a reservoir model was adapted from an initial model based on Kenyon (1987).20 Reservoir simulation facilitates understanding of fluid flow behaviour in the reservoir and can be used as a tool to predict production rate under diverse conditions.
A 3D reservoir grid model was built for the reservoir study (Fig. 3) using a cartesian styled framework with 9 cells in the x-direction, 9 cells in the y-direction and 4 layers in the z-direction i.e., 9 × 9 × 4 grids. The layers are homogenous with a constant porosity of 0.13 whereas the permeability and thickness of each layer varied as captured in Table 1. Kenyon's model was originally designed for gas cycling, but for this study the injection parameters have been modified to reflect oxygen injection. The initial conditions for the location of the gas/water contact and the capillary pressure data generate a water/gas transition zone extending into the pay layers. Relative permeability data for the gas and liquid phase in the model was based on the simple assumption that it depends on the saturation of that phase. Phase saturation is dependent on the wettability of the rock, capillary pressure, and saturation history. For the gas condensate fluid model being used for the analysis, condensate is immobile up to 24% saturation and gas relative permeability (krg) is reduced from 0.74 to 0.40 as condensate builds to this saturation with irreducible water present. To minimize pressure-decline during production, water is injected at layer 4 which has a high permeability of 150 mD.
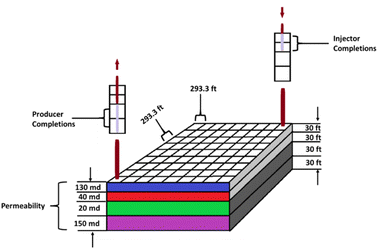 |
| | Fig. 3 Reservoir grid model based on Kenyon (1987).20 | |
Table 1 Reservoir grid data
| Parameter (unit) |
Value |
| NX = NY = 9, NZ = 4 |
|
| DX = DY |
293.3ft |
| Datum (subsurface), ft |
7500 ft |
| Porosity (at initial reservoir pressure) |
0.13 |
| Gas/water contact, ft |
7500 ft |
| Water saturation at contact |
1.0 |
| Capillary pressure at contact |
0 psia |
| Initial pressure at contact |
3550 psia |
| Water density at contact |
63.0 lbm ft−3 |
| Water compressibility |
3.0 × 10⁻⁶ psi−l |
| PV compressibility |
4.0 × 10⁻⁶ psi−l |
| Layer |
Horizontal permeability |
Vertical permeability |
Thickness (ft) |
Depth to center (ft) |
| 1 |
130 |
13 |
30 |
7330 |
| 2 |
40 |
4 |
30 |
7360 |
| 3 |
20 |
2 |
50 |
7400 |
| 4 |
150 |
15 |
50 |
7450 |
3.1 PVT data
PVT data used in this study were adapted to match fluid composition used for experimental analysis in the previous sub-section. The PVT data include hydrocarbon sample analyses, constant composition expansion data, constant-volume depletion data and experimental data. To reconstruct the fluid model given by Kenyon (1987),20 the synthetic condensate sample used for our experimental analysis21 is combined with a synthetic gas sample based on the GOR. For this study, the target composition is known, and the liquid composition is also known, however the gas composition that would be used to reconstruct the target composition is unknown. This means that the composition of the gas that would blend with the liquid needs to be calculated on the basis of the composition and properties of the known sample. The gas composition is calculated using eqn (6) and taking V as 0.96.where; Zi – known composition of the reservoir fluid Xi – known composition of the separator liquid (equivalent to the liquid used for the experimental analysis), Yi – unknown separator gas composition needed to blend the liquid into reservoir fluid. V – mole fraction gas based on the GOR stated in Kenyon (1987).20 The calculated gas composition recombined to create the reservoir well-stream for depletion study is given in Table 2.
Table 2 Reservoir fluid composition
| Component |
Xi, mol (%) |
Yi, mol (%) |
Zi, mol (%) |
| Carbon dioxide, CO2 |
0.05% |
1.26% |
1.21% |
| Nitrogen, N2 |
0.01% |
2.03% |
1.94% |
| Methane, CH4 |
0.34% |
69.08% |
65.99% |
| Ethane, C2H6 |
0.39% |
9.08% |
8.69% |
| Propane, C3H8 |
0.49% |
6.17% |
5.91% |
| Butane, C4H10 |
0.97% |
5.37% |
5.17% |
| Pentane, C5H12 |
54.82% |
0.23% |
2.69% |
| Hexane, C6H14 |
9.58% |
1.44% |
1.81% |
| Heptane, C7H16 |
10.00% |
1.04% |
1.44% |
| Octane, C8H18 |
10.28% |
1.09% |
1.50% |
| Decane, C10H22 |
10.96% |
0.25% |
0.73% |
| Undecane plus, C11H24 |
2.11% |
2.96% |
2.92% |
| Total |
100.00% |
100.00% |
100.00% |
3.2 Reservoir modelling with thermal simulator
STARS – a thermal simulator developed by Computer Modelling Group (CMG) software was used to model the reservoir and PVT data described in the previous subsection. The reservoir grid was developed using a cartesian grid covering an estimated area of 7 × 106 ft2. Fig. 4 gives a rendition of the reservoir model produced by the CMG STAR simulator. Vertical heterogeneity is captured by defining four layers with permeabilities ranging from 2 to 15 mD. Based on data reported in Kenyon (1987),20 reservoir porosity was given as 0.13, initial reservoir pressure as 3550 psi, temperature of 200 °F, and rock compressibility of 3.60 × 10⁶ 1 psi−1. The initial reservoir conditions are listed in Table 3. Two wells were completed in the model in a position similar to that given Fig. 3 and production simulated for a total of fifteen years.
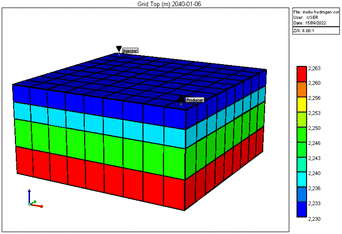 |
| | Fig. 4 Reservoir grid layout generated by CMG STARS. | |
Table 3 Initial reservoir conditions
| Parameter |
Unit |
Value |
| Total bulk reservoir volume |
Res ft3 |
1.11488 × 10⁹ |
| Total pore volume |
Res ft3 |
1.44926 × 10⁸ |
| Total hydrocarbon pore volume |
Res ft3 |
1.13465 × 10⁸ |
| Original oil in place, OOIP |
Std bbl |
3.38959 × 10⁶ |
| Original gas in place, OGIP |
Std ft3 |
2.28722 × 10¹⁰ |
In addition, relative permeability curves were generated using the Corey's model available. Fig. 5 and 6 summarize the relative-permeability curves used in this study.
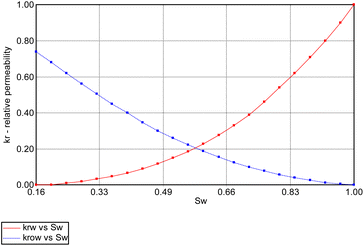 |
| | Fig. 5 Water (Krw) and oil (Krow) relative-permeability curves used in simulation model. | |
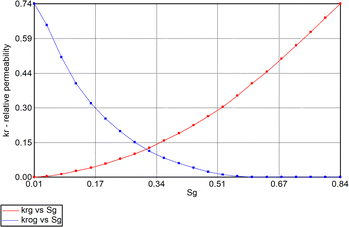 |
| | Fig. 6 Gas (Krg) and oil [condensate] (Krog) relative-permeability curves used in simulation model. | |
3.3 PVT match to the PVT data
The pressure/volume data in constant composition expansion of the reservoir gas at 200 F is given in Fig. 7. Although some minor disparities were observed at the lowest pressures shown, the plot shows an overall excellent agreement between the simulator model and PVT data given by Kenyon 1987.20 This agreement is more so important within the pressure range of 2500 and 3400 psi where most of the study takes place. Fig. 8 shows how much liquid condenses out of the vapor phase in constant volume depletion. The biggest differences between the simulator model and the PVT data occur around 2500 psi pressure where the highest liquid dropout varies between about 18 and 22% of the initial gas volume. It would later be observed that the reservoir model forecast higher liquid saturation near the wellbore, and this is attributed to flow and subsequent deposition of heavier components in this area as a result of decrease in pressure.
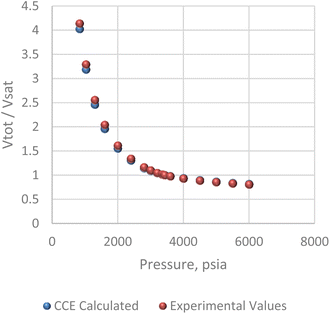 |
| | Fig. 7 Constant composition expansion (CCE) analysis. | |
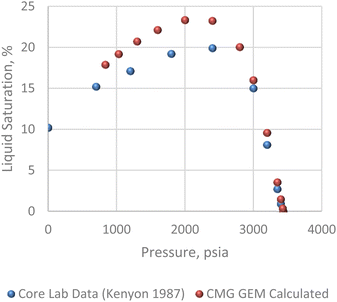 |
| | Fig. 8 Constant volume depletion analysis. | |
4 Combustion model for hydrogen forming reactions
For consistency in our modelling study, only hydrogen forming reactions applicable to the reservoir fluid composition given in Section 3 are considered for this analysis. The PVT data for our reservoir model comprised of the following components: methane, ethane, propane, butane, pentane, hexane, heptane, octane and decane. To understand what hydrogen forming reactions are possible during in situ combustion under reservoir conditions, all four reactions (SR, ATR, PO and PY) highlighted in the previous section, were modelled for each hydrocarbon component. The gas condensate composition comprised of 9 components and for each of these components the four reactions were modelled making it a total of 36 reactions. However, to establish the framework for the analysis, only methane reactions is presented. The reactions for other components are covered in Appendix. The balanced reactions for methane are captured by eqn (7a)–(7d).| | |
CH4 + 2H2O → CO2 + 4H2
| (7a) |
| | |
CH4 + 0.5O2 → CO + 2H2
| (7b) |
| | |
CH4 + 2O2 → CO2 + 2H2O
| (7c) |
However, under the reservoir pressure & temperature conditions during in situ combustion, not all reactions will occur naturally. Some reactions would spontaneous while others would require additional energy to take place. To understand what reactions will be spontaneous, change in Gibbs free energy (ΔG) for each reaction is computed at temperature and pressure conditions obtainable during in situ combustion. Chemical equilibrium of reactions (7a)–(7d) is represented by the equilibrium constants of each reaction, which is a function of combustion temperature:
| |
 | (8a) |
| |
 | (8b) |
| |
 | (8c) |
| |
 | (8d) |
where Δ
G° is the standard Gibbs free energy of each reaction,
R is the universal gas constant 8.314482 J mol
−1 K
−1 and
T is the reaction temperature in Kelvin.
The outlet composition for each mole of methane can be calculated from the stoichiometry of reactions (8a)–(8d). The molar flow rate of each chemical component participating in the in situ combustion process in the reservoir is expressed in Table 4. To compute the change in composition of the gas, we assume that; x – conversion rate of steam methane reforming, y – conversion rate of partial oxidation, z – conversion rate of autothermal reforming, u – conversion rate of pyrolysis, SC – steam composition, and OC – oxygen composition.
Table 4 Molar change of gas composition
| i |
Inlet [mol] |
Reforming |
Partial oxidation |
Autothermal reforming |
Pyrolysis |
Outlet [mol] |
| CH4 |
1 |
−x |
−y |
−z |
−u |
1 − x − y − z − u |
| H2O |
SC |
−2x |
0 |
+2z |
0 |
SC − 2x + 2z |
| CO |
0 |
0 |
+y |
0 |
0 |
y |
| CO2 |
0 |
+x |
0 |
+z |
0 |
x + z |
| H2 |
0 |
+4x |
+2y |
0 |
+2u |
4x + 2y + 2u |
| O2 |
OC |
0 |
−0.5y |
−2z |
0 |
OC − 0.5y − 2z |
| C |
0 |
0 |
0 |
0 |
+u |
u |
| Total |
1 + SC + OC |
2x |
1.5y |
0 |
2u |
1 + SC + OC + 2x + 1.5y + 2u |
Consequently, the partial pressures of each chemical species caused by the steam reforming, partial oxidation, autothermal reforming, and pyrolysis reactions are given by eqn (9a)–(9g):
| |
 | (9a) |
| |
 | (9b) |
| |
 | (9c) |
| |
 | (9d) |
| |
 | (9e) |
| |
 | (9f) |
| |
 | (9g) |
The equilibrium gas composition is then calculated by solving the following system of eqn (10a)–(10d) for x, y, z and u.
| |
 | (10a) |
| |
 | (10b) |
| |
 | (10c) |
| |
 | (10d) |
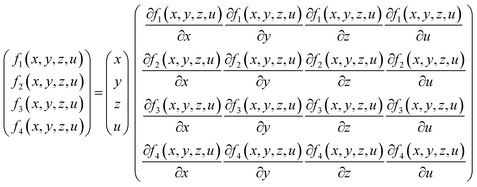
To solve these equations, Newton-Jacobi method was implemented in a MATLAB program. In each iteration, Jacobian matrix was used to solve the system of linear equations as presented in eqn (11):
| |
 | (11) |
The solution to eqn (11) gives us the equilibrium composition of the reactions based on the conversion rates of partial oxidation, steam reforming, pyrolysis and autothermal reforming. However, for eqn (11) to be solved, some initial conditions need to be specified. The conditions for the calculations were designed to align with the initial conditions of the reservoir: temperature, T = 200 F (366 K), pressure, P = 2500 psia (17![[thin space (1/6-em)]](https://www.rsc.org/images/entities/char_2009.gif) 236
236![[thin space (1/6-em)]](https://www.rsc.org/images/entities/char_2009.gif) 893 Pa), steam composition SC = 0.1, oxygen composition OC = 0.01.
893 Pa), steam composition SC = 0.1, oxygen composition OC = 0.01.
4.1 Characterizing the spontaneity of ISC reactions using Gibbs free energy
The spontaneity of any chemical reaction can be characterized by the change in Gibbs free energy (represented by ΔG) associated with that chemical reaction. ΔG is used to predict the direction of the chemical reaction when the temperature and pressure of the reaction is known. Although ΔG can predict the direction of a reaction, it does not give us any information about the rate of the reaction or the reaction path. A positive ΔG implies that the reaction is nonspontaneous and requires an external energy input to drive the reaction. Whereas a negative ΔG means that the reaction is spontaneous and will proceed in the forward direction without external energy input.
For each equilibrium reaction in eqn (8a)–(8d), the Gibbs free energy is estimated using eqn (12):
| |
ΔG = ΔG° + RT![[thin space (1/6-em)]](https://www.rsc.org/images/entities/char_2009.gif) ln ln![[thin space (1/6-em)]](https://www.rsc.org/images/entities/char_2009.gif) K K
| (12) |
where: Δ
G° – standard-state free energy,
R – ideal gas constant (8.314 J mol
−1 K
−1),
T – absolute temperature (Kelvin) and
K is the equilibrium constant for each reaction.
After solving the Newton-Jacobian matrix in eqn (11) stated in the previous section, the calculated conversion rates of each reaction are used to compute the equilibrium constant for each methane reaction in Table 5 based on the assumptions of initial condition of reservoir temperature and pressure conditions.
Table 5 Computed parameters for change in Gibbs free energy based on eqn (12)
| Reference |
K |
ln![[thin space (1/6-em)]](https://www.rsc.org/images/entities/char_2009.gif) K K |
R![[thin space (1/6-em)]](https://www.rsc.org/images/entities/char_2009.gif) ln ln![[thin space (1/6-em)]](https://www.rsc.org/images/entities/char_2009.gif) K K |
ΔG° |
| Eqn (8a) – ΔG1 |
245.0929 |
5.501637 |
−45.7406 |
113.3 |
| Eqn (8b) – ΔG2 |
26.97207 |
3.294802 |
−27.393 |
−86.66 |
| Eqn (8c) – ΔG3 |
86.21697 |
4.456867 |
−37.0544 |
−801.06 |
| Eqn (8d) – ΔG4 |
11.42965 |
2.436211 |
−20.2547 |
50.49 |
The resulting change in Gibbs free energy (ΔG) for each reaction is captured in Fig. 9. The result of the analysis implies that for the initial condition of reservoir temperature and pressure specified in the previous subsection, all four reactions in eqn (7a)–(7d) were spontaneous.
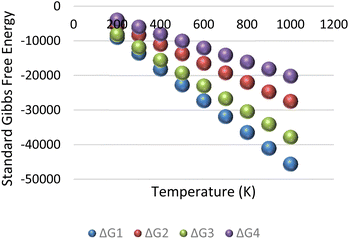 |
| | Fig. 9 Standard Gibbs free energy for methane–hydrogen reservoir condition. | |
It is important to note that the Gibbs free energy (ΔG) shown in Fig. 9 is only valid when the conversion rates obtained from eqn (11) are constant. However, with continuous injection of air into the reservoir, the initial condition of the reservoir will induce changes in the equilibrium conversation rates. The resultant effect of this dynamic process is that some reactions may become non-spontaneous and proceed in the reverse direction. To optimize hydrogen yield, the reservoir needs to be within conditions that allows all hydrogen forming reactions to remain spontaneous (i.e., having a negative ΔG).
Although in this section, the Gibbs free energy for only methane reaction is displayed. Based on the composition of the condensate at reservoir condition, methane is only part of the component of the overall composition. This analysis for methane is given as a framework for other components. Therefore, the analysis is repeated for each component in the condensate composition and the details are given in the appendix section.
5 Numerical simulation with CMG STARS
Based on the conditions of the reservoir during the in situ combustion process, 15 hydrogen forming reactions were screened out after analysing their change in Gibbs free energy (explained in the previous section). This brings the total number of possible reactions during the ISC process to 21 reactions modelled in eqn (13a)–(13u).| | |
1.232O2 + Coke → 0.564H2O + 0.8995CO2 + 0.1CO
| (13a) |
| | |
CH4 + 2O2 → 2H2O + CO2
| (13b) |
| | |
Gas + 2O2 → 2H2O + CO2 + 0.9695CO
| (13c) |
| | |
H2O + Coke → CO + 1.558H2
| (13d) |
| | |
CO + 1.558H2 → H2O + Coke
| (13e) |
| | |
H2O + CO → CO2 + H2
| (13f) |
| | |
CO2 + H2 → H2O + CO
| (13g) |
| | |
2H2 + Coke → 1.068CH4
| (13h) |
| | |
1.068CH4 → 2H2 + Coke
| (13i) |
| | |
O2 + C2H6 → 3H2 + 2CO
| (13l) |
| | |
1.5O2 + C3H8 → 4H2 + 3CO
| (13m) |
| | |
2O2 + C4H10 → 5H2 + 4CO
| (13n) |
| | |
2.5O2 + C5H12 → 6H2 + 5CO
| (13o) |
| | |
3O2 + C6H14 → 7H2 + 6CO
| (13p) |
| | |
3.5O2 + C7H16 → 8H2 + 7CO
| (13q) |
| | |
4O2 + C8H18 → 9H2 + 8CO
| (13r) |
| | |
5O2 + C10H22 → 11H2 + 10CO
| (13s) |
| | |
H2O + CH4 → 3H2 + CO
| (13t) |
| | |
2H2O + C2H6 → 5H2 + 2CO
| (13u) |
To determine the net hydrogen yield from the ISC process, reactions (13a)–(13u) were simulated using a thermal reservoir simulator – CMG STARS (2015). CMG STARS simulator uses a finite volume approach to solve the energy balance (conductive and convective heat transfer) and component mass balances (diffusive and advective mass transfer) during each of the reactions listed in eqn (13a)–(13u). The component material balance and energy balance equations used by the simulator is stated in ref. 2. The rate of each reaction during the ISC is dependent on the temperature according to the Arrhenius relationship given by eqn (14)
| |
 | (14) |
where:
A is the frequency factor,
E is the activation energy, and
R is the universal gas constant.
Ideally the parameters for calculating the Arrhenius rate of reaction should be experimentally determined. However, in the absence of experimental data specific to this reservoir, data from published experiments whose reactions are similar to the reactions identified in eqn (13a)–(13u) were applied to generate the rate of reaction. The kinetic data used to compute each reaction rates and their respective sources are outlined in Table 6. Higher hydrocarbons exhibit higher activation energy and lower frequency factor.22,23 The frequency factor and activation energy for reactions (13l)–(13s) were obtained by modifying reaction (2) using a factor of  where Cn is the number of carbon atom.
Table 6 Parameters for Arrhenius reaction extracted from published literature
| Rxn |
Reaction frequency factor |
Enthalpy (−ve for endothermic reactions) [J] |
Activation energy (EACT) [J mol−1] |
Source |
| (13a) |
3.881 × 100 |
3.946 × 10⁵ |
8.205 × 10² |
24 |
| (13b) |
3.020 × 10¹⁰ |
8.910 × 10⁵ |
5.945 × 10⁴ |
25 |
| (13c) |
1.311 × 10⁸ |
4.436 × 10⁵ |
2.662 × 10⁵ |
| (13d) |
2.117 × 10⁷ |
−1.314 × 10⁵ |
9.20 × 10⁴ |
26 |
| (13e) |
5.291 × 10² |
1.314 × 10⁵ |
3.46 × 10⁴ |
11 |
| (13f) |
5.573 × 10⁷ |
4.10 × 10⁴ |
1.49 × 10⁵ |
| (13g) |
4.29 × 10⁹ |
−4.1 × 10⁴ |
1.90 × 10⁵ |
| (13h) |
3.162 × 10⁴ |
7.489 × 10⁴ |
4.14 × 10⁴ |
26 |
| (13i) |
7.113 × 10⁹ |
−7489 × 104 |
1.163 × 10⁵ |
| (13j) |
1.123 × 10⁷ |
2.830 × 10⁵ |
1.255 × 10⁵ |
27 |
| (13k) |
8.986 × 10⁷ |
2.860 × 10⁵ |
1.255 × 10⁵ |
| (13l) |
2.990 × 10¹⁰ |
1.363 × 10⁵ |
6.004 × 10⁴ |
Modified from reaction (2) |
| (13m) |
2.960 × 10¹⁰ |
2.277 × 10⁵ |
6.064 × 10⁴ |
| (13n) |
2.929 × 10¹⁰ |
3.159 × 10⁵ |
6.123 × 10⁴ |
| (13o) |
2.899 × 10¹⁰ |
4.061 × 10⁵ |
6.183 × 10⁴ |
| (13p) |
2.869 × 10¹⁰ |
4.643 × 10⁵ |
6.242 × 10⁴ |
| (13q) |
2.839 × 10¹⁰ |
5.445 × 10⁵ |
6.302 × 10⁴ |
| (13r) |
2.809 × 10¹⁰ |
6.339 × 10⁵ |
6.361 × 10⁴ |
| (13s) |
2.778 × 10¹⁰ |
8.050 × 10⁵ |
6.421 × 10⁴ |
| (13t) |
2.017 × 10⁷ |
−2.061 × 10⁵ |
9.20 × 10⁴ |
| (13u) |
1.817 × 10⁷ |
−3.473 × 10⁵ |
9.62 × 10⁴ |
In addition to the kinetic data, the thermodynamic properties of the reservoir are given in Table 7. The initial pressure, temperature, porosity, and permeability used for the simulation are consistent with the reservoir properties described in Table 1.
Table 7 Thermodynamic parameters used for analysis
| Parameter |
Value |
| Initial temperature, (C) |
90 |
| Initial pressure, (kpa) |
24![[thin space (1/6-em)]](https://www.rsc.org/images/entities/char_2009.gif) 476.39 476.39 |
| Rock heat capacity (J m3 °C) |
2.280 × 10⁶ |
| Rock thermal conductivity, (J m per day °C) |
6.048 × 10⁵ |
| Water phase thermal conductivity (J m per day °C) |
5.815 × 10⁴ |
| Oil phase thermal conductivity (J m per day °C) |
1.339 × 10⁴ |
| Gas phase thermal conductivity (J m per day °C) |
4320 |
6 Results and discussion
6.1 Evaluating in situ combustion performance
To visualize the nature of the combustion fronts during the in situ combustion study, four cells were selected for further investigation as shown in Fig. 10. The first cell (1i, 1j and 3k) hosts the injector well, through which oxygen is introduced into the reservoir and combustion reaction is initiated. The combustion front then migrates towards the producer well at a rate dependent on the reservoir permeability, differential pressure between reservoir pressure and bottom hole pressure at producer well and nature of produced effluents. The second cell selected for further investigation is the cell (9i, 9j and 3k) which is farthest from the injector well block. This point symbolizes the end of the combustion process and the composition of the effluent fluids in this cell determines the success/failure of the entire process. The third cell (5i, 5j and 3k) is chosen to simulate mid-point between the injector well and producer well. The third cell forms a link and traces a transition zone between the high temperature/pressure region in around the injector well and the low temperature/pressure region in the producer well. The fourth cell is the production well (7i, 7j and 3k).
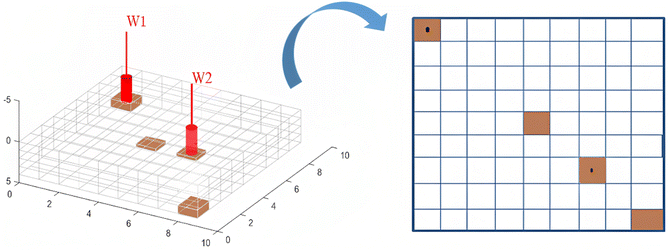 |
| | Fig. 10 Cells selected for further investigation. | |
From Fig. 11, we observe that at the injector block (1i, 1j and 3k), the initial reservoir temperature (87.5 °C) increases steadily within the first 365 days of combustion and peaks at (104 °C). It is to be noted that the temperature reported in this analysis is the rock temperature and the pressure condition is set to atmospheric pressure of about 101 kpa. To estimate the actual combustion reaction, the rock thermal conductivity must be factored in. The peak temperature is dependent on the composition of the hydrocarbon and its heating value. Block (1i, 1j and 3k) depicts the combustion front for the in situ combustion process. After attaining peak temperature, the block temperature then declines exponentially with time as the front propagates towards the production well.
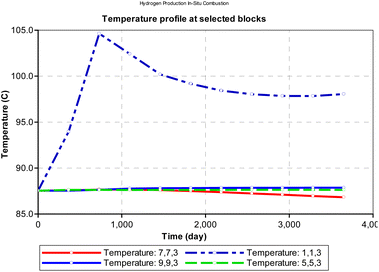 |
| | Fig. 11 Change in temperature during combustion at select points on the reservoir grid (at atmospheric pressure). | |
At atmospheric pressure, the reservoir temperature near the production wellbore declined steadily during the production history of the well. The most plausible reason for this could be explained by the joule thermal effect on the flue gases as they expand from a region of higher pressure to lower pressure. i.e., isenthalpic cooling effect of gases as they migrate from regions of higher pressure to regions of lower pressure. Besides the areas around the injector and producer blocks, all other reservoir sections remain at fairly constant temperature during the ISC process. However, when the initial reservoir pressure is elevated to 24![[thin space (1/6-em)]](https://www.rsc.org/images/entities/char_2009.gif) 131.65 kpa (an equivalent of 3500 psi), the temperature profile changes as shown in Fig. 12. The rock temperature around the injector well increases linearly by a gradient of 0.016 °C per day and peaks at 150.6 °C after 3285 days. The temperature of all other reservoir sections remained fairly constant through-out the ISC process. The high temperature recorded at the injector well could be attributed to the increase kinetics of combustion as a result of higher pressure.
131.65 kpa (an equivalent of 3500 psi), the temperature profile changes as shown in Fig. 12. The rock temperature around the injector well increases linearly by a gradient of 0.016 °C per day and peaks at 150.6 °C after 3285 days. The temperature of all other reservoir sections remained fairly constant through-out the ISC process. The high temperature recorded at the injector well could be attributed to the increase kinetics of combustion as a result of higher pressure.
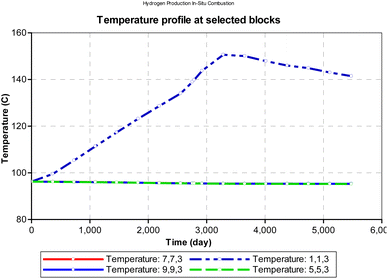 |
| | Fig. 12 Change in temperature during combustion at select points on the reservoir grid (at reservoir pressure). | |
6.2 Effect of SC on H2/CO/CO2
Steam carbon ratio or steam composition influences the thermodynamic equilibrium of the in situ combustion reactions. Equilibrium thermodynamic analysis conducted by Lutz et al., (2003)28 suggest that higher steam-carbon ratio causes a corresponding increase in the hydrogen yield at higher (reactor) temperature. However, the results obtained from the combustion model in this study (Fig. 13) suggest an upward trending sinusoidal relationship between the steam-carbon ration and hydrogen yield at the reservoir. Part of the reason for this could be that when the steam-carbon ratio exceeds a threshold, excess steam re-combines with carbon(IV) oxide to yield methane. Comparing the simulator output in Fig. 14, a similar trend to the combustion model was observed. It is important to note that the analysis provided by the combustion model outputs the effect of steam-carbon ratio as an effect on partial pressure of the gaseous species of interest. Whereas the analysis by the thermal simulator accounts for the actual yield of the gases (i.e., H2, CO, CO2) flowing through a porous media. This explains why the results obtained from the simulator is significantly lower than that obtained from the combustion model.
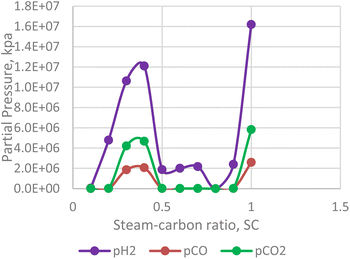 |
| | Fig. 13 Effect of SC on H2/CO/CO2 partial pressure (combustion model). | |
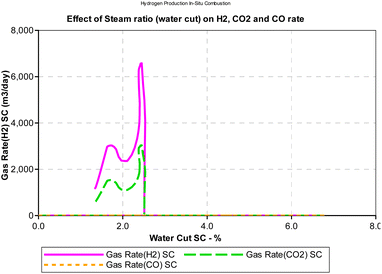 |
| | Fig. 14 Effect of SC on H2/CO/CO2 production rates (CMG STARS). | |
It is important to note that the effect of steam-carbon ratio is also strongly dependent on the temperature of the reaction. The results presented in both Fig. 13 and 14 were conducted at constant temperature. While the data is not conclusive, an interesting area of application of this model could be as an optimization tool for experimental studies.
6.3 Effect of oxygen composition on H2/CO/CO2
In contrast to the effect of steam-carbon ratio, the hydrogen yield of the in situ combustion process decreases with excess oxygen. For the numerical simulator, oxygen is only injected after the reservoir pressure declines below 2500 psi. This was done to simulate condensate bank around the producing well. Results from the combustion model reveals that excess beyond the threshold of 0.5 leads to lower yield of hydrogen (see Fig. 15). Interestingly the yield of CO2 and CO also lessens within this section. This implies that a substantial portion of the excess oxygen is oxidating the hydrogen molecules and converting them to steam.
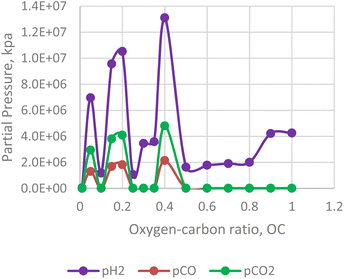 |
| | Fig. 15 Effect of oxygen–carbon ratio on H2/CO/CO2 production. | |
During the in situ combustion study, oxygen was injected at a constant rate of 1000 m3 per day. However, because all the injected oxygen were consumed during the reaction, time was used as a measure of the oxygen–carbon ratio in Fig. 16. The implicit assumption of the result obtained is that oxygen injected into the reservoir mixes completely with the hydrocarbon to support combustion. However, in a more realistic scenario, the process of oxygen mixing is rarely fully complete. The result obtained from the analysis reveal a downward trending sinusoidal curve. Therefore, the combustion model can be a useful tool to determine how much oxygen injection then is required to allow for in situ combustion reaction and obtain maximum yield of hydrogen.
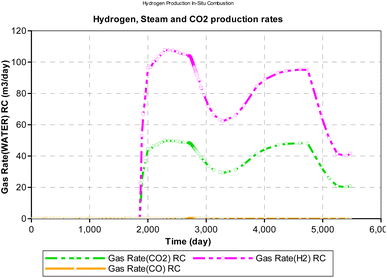 |
| | Fig. 16 Effect of OC on H2, CO2, CO production rate (CMG STARS). | |
7 Conclusion
In situ hydrogen production (IHP) from hydrocarbon reservoirs is an interesting as well as exciting frontier for research. Applications of this novel process could be extended to existing oil/gas reservoirs and production facilities could be retrofitted to allow for hydrogen production. From literature, four broad types of hydrogen forming reactions occur in the reservoir – steam reforming, partial oxidation, autothermal reforming and pyrolysis. In this paper, a model for characterizing these hydrogen forming reactions under reservoir conditions was formulated based on composition of the reservoir fluid using equilibrium reaction analysis. Change in Gibbs free energy of each reaction, formed the basis of screening and implementation in a numerical simulator (CMG STARS). The results from the model were then validated against that obtained from the numerical simulator. Key findings from this study include:
(i) The hydrogen yield from an in situ combustion process increases positively with the steam-carbon ratio during combustion. However, rather than a near exponential relationship between both parameters (hydrogen yield and steam-carbon ratio) as observed in most surface reactors, an upward trending sinusoidal relationship is observed.
(ii) In addition to the steam-carbon ratio, the oxygen–carbon ratio also affects the hydrogen yield from an in situ combustion process. A downward trending sinusoidal relation between the oxygen–carbon ratio and hydrogen yield is observed. Excess oxygen oxidates the produced hydrogen into steam.
The model developed in this paper sets the framework for future study in this direction and more importantly can be used to optimize preliminary experimental investigations. Future improvements in the combustion model could consider the effect of reservoir geology & rock mineralogy and temperature variations during combustion.
Appendix
A1: Hydrogen forming reactions
Ethane| | |
C2H6 + 4H2O → 2CO2 + 7H2
| (A1) |
| | |
C2H6 + O2 → 2CO + 3H2
| (A2) |
| | |
C2H6 + 3.5O2 → 2CO2 + 3H2O
| (A3) |
Propane
| | |
C3H8 + 6H2O → 3CO2 + 10H2
| (B1) |
| | |
C3H8 + 1.5O2 → 3CO + 4H2
| (B2) |
| | |
C3H8 + 5O2 → 3CO2 + 4H2O
| (B3) |
Butane
| | |
C4H10 + 8H2O → 4CO2 + 13H2
| (C1) |
| | |
C4H10 + 2O2 → 4CO + 5H2
| (C2) |
| | |
C4H10 + 6.5O2 → 4CO2 + 5H2O
| (C3) |
Pentane
| | |
C5H12 + 10H2O → 5CO2 + 16H2
| (D1) |
| | |
C5H12 + 2.5O2 → 5CO + 6H2
| (D2) |
| | |
C5H12 + 8O2 → 5CO2 + 6H2O
| (D3) |
Hexane
| | |
C6H14 + 12H2O → 6CO2 + 19H2
| (E1) |
| | |
C6H14 + 3O2 → 6CO + 7H2
| (E2) |
| | |
C6H14 + 9.5O2 → 6CO2 + 7H2O
| (E3) |
Heptane
| | |
C7H16 + 14H2O → 7CO2 + 22H2
| (F1) |
| | |
C7H16 + 3.5O2 → 7CO + 8H2
| (F2) |
| | |
C7H16 + 11O2 → 7CO2 + 8H2O
| (F3) |
Octane
| | |
C8H18 + 16H2O → 8CO2 + 25H2
| (G1) |
| | |
C8H18 + 4O2 → 8CO + 9H2
| (G2) |
| | |
C8H18 + 12.5O2 → 8CO2 + 9H2O
| (G3) |
Decane
| | |
C10H22 + 20H2O → 10CO2 + 31H2
| (H1) |
| | |
C10H22 + 5O2 → 10CO + 11H2
| (H2) |
| | |
C10H22 + 15.5O2 → 10CO2 + 11H2O
| (H3) |
A2: Molar change in gas composition
| Conversion parameter |
% |
|
|
| x |
40% |
- Conversion rate of SMR |
|
| y |
28% |
- Conversion rate of partial oxidation |
|
| z |
20% |
- Conversion rate of combustion |
|
| u |
10% |
- Conversion rate of pyrolysis |
|
| SC |
290% |
- Steam composition |
|
| OC |
15% |
- Oxygen composition |
|
| P |
1.72 × 10⁷ |
kpa |
(2500 psi) |
| i |
Inlet [mol] |
Reforming |
Partial oxidation |
Combustion |
Pyrolysis |
Outlet [mol] |
| Methane |
| xCH4 |
0.00 |
0.00 |
0.00 |
0.00 |
0.00 |
0.00 |
| xH2O |
2.90 |
−0.80 |
0.00 |
0.40 |
0.00 |
2.50 |
| xCO |
0.00 |
0.00 |
0.28 |
0.00 |
0.00 |
0.28 |
| xCO2 |
0.00 |
0.40 |
0.00 |
0.20 |
0.00 |
0.60 |
| xH2 |
0.00 |
1.60 |
0.56 |
0.00 |
0.20 |
2.36 |
| xO2 |
0.15 |
0.00 |
−0.14 |
−0.40 |
0.00 |
−0.39 |
| xC |
0.00 |
0.00 |
0.00 |
0.00 |
0.10 |
0.10 |
![[thin space (1/6-em)]](https://www.rsc.org/images/entities/char_2009.gif) |
| Ethane |
| xC2H6 |
0.00 |
0.00 |
0.00 |
0.00 |
0.00 |
0.00 |
| xH2O |
2.90 |
−1.60 |
0.00 |
0.60 |
0.00 |
1.90 |
| xCO |
0.00 |
0.00 |
0.56 |
0.00 |
0.00 |
0.56 |
| xCO2 |
0.00 |
0.80 |
0.00 |
0.40 |
0.00 |
1.20 |
| xH2 |
0.00 |
2.80 |
0.84 |
0.00 |
0.30 |
3.94 |
| xO2 |
0.15 |
0.00 |
−0.28 |
−0.70 |
0.00 |
−0.83 |
| xC |
0.00 |
0.00 |
0.00 |
0.00 |
0.20 |
0.20 |
![[thin space (1/6-em)]](https://www.rsc.org/images/entities/char_2009.gif) |
| Propane |
| xC3H8 |
0.01 |
0.00 |
0.00 |
0.00 |
0.00 |
0.00 |
| xH2O |
2.90 |
−2.40 |
0.00 |
0.80 |
0.00 |
1.30 |
| xCO |
0.00 |
0.00 |
0.84 |
0.00 |
0.00 |
0.84 |
| xCO2 |
0.00 |
1.20 |
0.00 |
0.60 |
0.00 |
1.80 |
| xH2 |
0.00 |
4.00 |
1.12 |
0.00 |
0.40 |
5.52 |
| xO2 |
0.15 |
0.00 |
−0.42 |
−1.00 |
0.00 |
−1.27 |
| xC |
0.00 |
0.00 |
0.00 |
0.00 |
0.30 |
0.30 |
![[thin space (1/6-em)]](https://www.rsc.org/images/entities/char_2009.gif) |
| n-Butane |
| xC4H10 |
0.01 |
0.00 |
0.00 |
0.00 |
0.00 |
0.00 |
| xH2O |
2.90 |
−3.20 |
0.00 |
1.00 |
0.00 |
0.70 |
| xCO |
0.00 |
0.00 |
1.12 |
0.00 |
0.00 |
1.12 |
| xCO2 |
0.00 |
1.60 |
0.00 |
0.80 |
0.00 |
2.40 |
| xH2 |
0.00 |
5.20 |
1.40 |
0.00 |
0.50 |
7.10 |
| xO2 |
0.15 |
0.00 |
−0.56 |
−1.30 |
0.00 |
−1.71 |
| xC |
0.00 |
0.00 |
0.00 |
0.00 |
0.40 |
0.40 |
![[thin space (1/6-em)]](https://www.rsc.org/images/entities/char_2009.gif) |
| n-Pentane |
| xC5H12 |
0.56 |
−0.22 |
−0.16 |
−0.11 |
−0.06 |
0.01 |
| xH2O |
2.90 |
−4.00 |
0.00 |
1.20 |
0.00 |
0.10 |
| xCO |
0.00 |
0.00 |
1.40 |
0.00 |
0.00 |
1.40 |
| xCO2 |
0.00 |
2.00 |
0.00 |
1.00 |
0.00 |
3.00 |
| xH2 |
0.00 |
6.40 |
1.68 |
0.00 |
0.60 |
8.68 |
| xO2 |
0.15 |
0.00 |
−0.70 |
−1.60 |
0.00 |
−2.15 |
| xC |
0.00 |
0.00 |
0.00 |
0.00 |
0.50 |
0.50 |
![[thin space (1/6-em)]](https://www.rsc.org/images/entities/char_2009.gif) |
| n-Hexane |
| xC6H14 |
0.10 |
−0.04 |
−0.03 |
−0.02 |
−0.01 |
0.00 |
| xH2O |
2.90 |
−4.80 |
0.00 |
1.40 |
0.00 |
−0.50 |
| xCO |
0.00 |
0.00 |
1.68 |
0.00 |
0.00 |
1.68 |
| xCO2 |
0.00 |
2.40 |
0.00 |
1.20 |
0.00 |
3.60 |
| xH2 |
0.00 |
7.60 |
1.96 |
0.00 |
0.70 |
10.26 |
| xO2 |
0.15 |
0.00 |
−0.84 |
−1.90 |
0.00 |
−2.59 |
| xC |
0.00 |
0.00 |
0.00 |
0.00 |
0.60 |
0.60 |
![[thin space (1/6-em)]](https://www.rsc.org/images/entities/char_2009.gif) |
| n-Heptane |
| xC7H16 |
0.10 |
−0.04 |
−0.03 |
−0.02 |
−0.01 |
0.00 |
| xH2O |
2.90 |
−5.60 |
0.00 |
1.60 |
0.00 |
−1.10 |
| xCO |
0.00 |
0.00 |
1.96 |
0.00 |
0.00 |
1.96 |
| xCO2 |
0.00 |
2.80 |
0.00 |
1.40 |
0.00 |
4.20 |
| xH2 |
0.00 |
8.80 |
2.24 |
0.00 |
0.80 |
11.84 |
| xO2 |
0.15 |
0.00 |
−0.98 |
−2.20 |
0.00 |
−3.03 |
| xC |
0.00 |
0.00 |
0.00 |
0.00 |
0.70 |
0.70 |
![[thin space (1/6-em)]](https://www.rsc.org/images/entities/char_2009.gif) |
| n-Octane |
| xC8H18 |
0.11 |
−0.04 |
−0.03 |
−0.02 |
−0.01 |
0.00 |
| xH2O |
2.90 |
−6.40 |
0.00 |
1.80 |
0.00 |
−1.70 |
| xCO |
0.00 |
0.00 |
2.24 |
0.00 |
0.00 |
2.24 |
| xCO2 |
0.00 |
3.20 |
0.00 |
1.60 |
0.00 |
4.80 |
| xH2 |
0.00 |
10.00 |
2.52 |
0.00 |
0.90 |
13.42 |
| xO2 |
0.15 |
0.00 |
−1.12 |
−2.50 |
0.00 |
−3.47 |
| xC |
0.00 |
0.00 |
0.00 |
0.00 |
0.80 |
0.80 |
![[thin space (1/6-em)]](https://www.rsc.org/images/entities/char_2009.gif) |
| n-Decane |
| xC10H22 |
0.11 |
−0.04 |
−0.03 |
−0.02 |
−0.01 |
0.00 |
| xH2O |
2.90 |
−8.00 |
0.00 |
2.20 |
0.00 |
−2.90 |
| xCO |
0.00 |
0.00 |
2.80 |
0.00 |
0.00 |
2.80 |
| xCO2 |
0.00 |
4.00 |
0.00 |
2.00 |
0.00 |
6.00 |
| xH2 |
0.00 |
12.40 |
3.08 |
0.00 |
1.10 |
16.58 |
| xO2 |
0.15 |
0.00 |
−1.40 |
−3.10 |
0.00 |
−4.35 |
| xC |
0.00 |
0.00 |
0.00 |
0.00 |
1.00 |
1.00 |
Author contributions
PMI conceptualized the paper, extracted data from literature, analysed all models and prepared the first draft of the paper, while JOU both reviewed the manuscript and supervised the findings of the work.
Conflicts of interest
The authors declare no conflict of interest on this work.
Acknowledgements
Funding for this project was received from Petroleum Technology Development Fund, under grant number PTDF/ED/PHD/PPI/1028/17. The funders had no role in study design, data collection and analysis, decision to publish, or preparation of the manuscript. The authors express their gratitude to Petroleum Technology Development Fund for providing funding vital to this research.
References
- I. D. Gates and J. Wang, In situ process to produce hydrogen from underground hydrocarbon reservoirs, WO Pat., WO2017/136924 A1, World Intellectual Property Organization, Canada, 2017, pp. 1–44, available from: https://patents.google.com/patent/WO2017136924A1/it
 .
. - P. R. Kapadia, M. S. Kallos and I. D. Gates, Potential for hydrogen generation from in situ combustion of Athabasca bitumen, Fuel, 2011, 90(6), 2254–2265, DOI:10.1016/j.fuel.2011.02.038
 .
. - P. Kapadia, M. Kallos and I. Gates, A Comprehensive Kinetic Theory to Model Thermolysis, Aquathermolysis, Gasification, Combustion, and Oxidation of Athabasca Bitumen, in Proceedings of SPE Improved Oil Recovery Symposium, Society of Petroleum Engineers, 2010, p. 263–293. Available from: https://www.spe.org/elibrary/servlet/spepreview?id=SPE-129660-MS Search PubMed
 .
. - M. Yu, K. Wang and H. Vredenburg, Insights into low-carbon hydrogen production methods: Green, blue and aqua hydrogen, Int. J. Hydrogen Energy, 2021, 46(41), 21261–21273, DOI:10.1016/j.ijhydene.2021.04.016
 .
. - I. Y. Akkutlu and Y. C. Yortsos, The dynamics of in situ combustion fronts in porous media, Combust Flame, 2003, 134(3), 229–247 CrossRef CAS
 , https://www.sciencedirect.com/science/article/pii/S0010218003000956.
 - L. N. Nwidee, S. Theophilus, A. Barifcani, M. Sarmadivaleh and S. Iglauer, EOR Processes, Opportunities and Technological Advancements, ed. Romero-Zeron L., IntechOpen, Rijeka, 2016, ch. 1, DOI:10.5772/64828
 .
. - S. Razzaghi, R. Kharrat, S. Vossoughi and D. Rashtchian, Feasibility study of auto ignition in in-situ combustion process, J. Japan Pet. Inst., 2008, 51(5), 287–297 CrossRef CAS
 .
. - Y. B. Li, W. F. Pu, J. Y. Zhao, Q. N. Zhao, L. Sun and F. Y. Jin, et al., Variation of reservoir fluid property during the high pressure air injection process, Int. J. Green Energy, 2016, 13(2), 173–180 CrossRef CAS
 .
. - S. Yuan, H. Jiang, B. Wang and J. Li, Design of Steam Preheating and Ignition Program of In Situ Combustion, Energy Fuels, 2017, 31(8), 8643–8647, DOI:10.1021/acs.energyfuels.7b00723
 .
. - P. Yue, S. Huang, F. Zeng, J. J. Sheng and Q. Jiang, Experimental and Mechanism Study on Crude Oil Spontaneous Ignition during the Air Injection Process, Energy Fuels, 2020, 34(6), 7076–7084, DOI:10.1021/acs.energyfuels.0c01206
 .
. - L. E. Hajdo, R. J. Hallam and L. D. L. Vorndran, Hydrogen Generation During InSitu Combustion, in SPE California Regional Meeting, Society of Petroleum Engineers, 1985. Available from: https://www.onepetro.org/doi/10.2118/13661-MS Search PubMed
 .
. - P. Ikpeka, J. Ugwu, P. Russell and G. Pillai, In situ Hydrogen Production from Hydrocarbon Reservoirs - What Are the Key Challenges and Prospects?, in 1st Geoscience & Engineering in Energy Transition Conference, European Association of Geoscientists & Engineers, 2020, pp. 1–5. Available from: https://www.earthdoc.org/content/papers/10.3997/2214-4609.202021090 Search PubMed
 .
. - F. Dawood, M. Anda and G. M. Shafiullah, Hydrogen production for energy: An overview, Int. J. Hydrogen Energy, 2020, 45(7), 3847–3869, DOI:10.1016/j.ijhydene.2019.12.059
 .
. - A. M. Abdalla, S. Hossain, O. B. Nisfindy, A. T. Azad, M. Dawood and A. K. Azad, Hydrogen production, storage, transportation and key challenges with applications: A review, Energy Convers. Manage., 2018, 165, 602–627 CrossRef CAS
 .
. - T. da Silva Veras, T. S. Mozer, D. da Costa Rubim Messeder dos Santos and A. da Silva César, Hydrogen: Trends, production and characterization of the main process worldwide, Int. J. Hydrogen Energy, 2017, 42(4), 2018–2033 CrossRef CAS
 .
. - M. H. Ali Khan, R. Daiyan, P. Neal, N. Haque, I. MacGill and R. Amal, A framework for assessing economics of blue hydrogen production from steam methane reforming using carbon capture storage & utilisation, Int. J. Hydrogen Energy, 2021, 46(44), 22685–22706, DOI:10.1016/j.ijhydene.2021.04.104
 .
. - J. D. Holladay, J. Hu, D. L. King and Y. Wang, An overview of hydrogen production technologies, Catal Today, 2009, 139(4), 244–260 CrossRef CAS
 .
. - L. van Cappellen, H. Croezen and F. Rooijers, Feasibility study into blue hydrogen, 2018, vol. 45. Available from: https://greet.es.anl.gov/publication-smr_h2_2019 Search PubMed
 .
. - M. Yasar, D. M. Trauth and M. T. Klein, Asphaltene and resid pyrolysis. 2. The effect of reaction environment on pathways and selectivities, Energy Fuels, 2001, 15(3), 504–509 CrossRef CAS
 .
. - D. Kenyon, Third SPE Comparative Solution Project: Gas Cycling of Retrograde Condensate Reservoirs, J. Pet. Technol., 1987, 39(8), 981–997 CrossRef
 , https://onepetro.org/JPT/article/39/08/981/73577/Third-SPE-Comparative-Solution-Project-Gas-Cycling.
 - P. M. Ikpeka, J. O. Ugwu, G. G. Pillai and P. Russell, Effect of direct current on gas condensate droplet immersed in brine solution, J. Pet. Explor. Prod. Technol., 2021, 11(6), 2845–2860 CrossRef CAS
 .
. - A. S. Bagci, Reaction kinetics of wet combustion of crude oils, Energy Sources, Part A, 2006, 28(3), 233–244 CrossRef CAS
 .
. - A. S. Gundogar and M. V. Kok, Thermal characterization, combustion and kinetics of different origin crude oils, Fuel, 2014, 123, 59–65, DOI:10.1016/j.fuel.2014.01.058
 .
. - K. O. Adegbesan, J. K. Donnelly, R. G. Moore and D. W. Bennion, Low-Temperature-Oxidation Kinetic Parameters for in-Situ Combustion: Numerical Simulation, SPE Reservoir Eng., 1987, 2(4), 573–582 CrossRef CAS
 .
. - X. Yang and I. D. Gates, Combustion kinetics of Athabasca bitumen from 1D combustion tube experiments, Nat. Resour. Res., 2009, 18(3), 193–211 CrossRef CAS
 .
. - K. Guntermann, P. Breidung, F. Fuhrmann, M. Rurth and G. Ropertz, Pressure-swinging underground gasification. Theoretical and experimental investigations of gasification. Phase 3. Druckwechsel-Unter-Tage-Vergasung. Theoretische und experimentelle Untersuchungen zum Vergasungsvorgang untertage, Phase, 1984, 3, 250 Search PubMed
 .
. - V. I. Babushok and A. N. Dakdancha, Global kinetic parameters for high-temperature gas-phase reactions, Combust., Explos. Shock Waves, 1993, 29(4), 464–489, DOI:10.1007/BF00782974
 .
. - A. E. Lutz, R. W. Bradshaw, J. O. Keller and D. E. Witmer, Thermodynamic analysis of hydrogen production by steam reforming, Int. J. Hydrogen Energy, 2003, 28(2), 159–167 CrossRef CAS
 .
.
|
| This journal is © The Royal Society of Chemistry 2023 |
Click here to see how this site uses Cookies. View our privacy policy here.  Open Access Article
 *ab and
Johnson O. Ugwua


![[thin space (1/6-em)]](https://www.rsc.org/images/entities/char_2009.gif) 236
236![[thin space (1/6-em)]](https://www.rsc.org/images/entities/char_2009.gif) 893 Pa), steam composition SC = 0.1, oxygen composition OC = 0.01.
893 Pa), steam composition SC = 0.1, oxygen composition OC = 0.01.![[thin space (1/6-em)]](https://www.rsc.org/images/entities/char_2009.gif) ln
ln![[thin space (1/6-em)]](https://www.rsc.org/images/entities/char_2009.gif) K
K

 where Cn is the number of carbon atom.
![[thin space (1/6-em)]](https://www.rsc.org/images/entities/char_2009.gif) 476.39
476.39
![[thin space (1/6-em)]](https://www.rsc.org/images/entities/char_2009.gif) 131.65 kpa (an equivalent of 3500 psi), the temperature profile changes as shown in Fig. 12. The rock temperature around the injector well increases linearly by a gradient of 0.016 °C per day and peaks at 150.6 °C after 3285 days. The temperature of all other reservoir sections remained fairly constant through-out the ISC process. The high temperature recorded at the injector well could be attributed to the increase kinetics of combustion as a result of higher pressure.
131.65 kpa (an equivalent of 3500 psi), the temperature profile changes as shown in Fig. 12. The rock temperature around the injector well increases linearly by a gradient of 0.016 °C per day and peaks at 150.6 °C after 3285 days. The temperature of all other reservoir sections remained fairly constant through-out the ISC process. The high temperature recorded at the injector well could be attributed to the increase kinetics of combustion as a result of higher pressure.
![[thin space (1/6-em)]](https://www.rsc.org/images/entities/char_2009.gif)
![[thin space (1/6-em)]](https://www.rsc.org/images/entities/char_2009.gif)
![[thin space (1/6-em)]](https://www.rsc.org/images/entities/char_2009.gif)
![[thin space (1/6-em)]](https://www.rsc.org/images/entities/char_2009.gif)
![[thin space (1/6-em)]](https://www.rsc.org/images/entities/char_2009.gif)
![[thin space (1/6-em)]](https://www.rsc.org/images/entities/char_2009.gif)
![[thin space (1/6-em)]](https://www.rsc.org/images/entities/char_2009.gif)
![[thin space (1/6-em)]](https://www.rsc.org/images/entities/char_2009.gif)
.
.
.
.
, https://www.sciencedirect.com/science/article/pii/S0010218003000956.
.
.
.
.
.
.
.
.
.
.
.
.
.
.
, https://onepetro.org/JPT/article/39/08/981/73577/Third-SPE-Comparative-Solution-Project-Gas-Cycling.
.
.
.
.
.
.
.
.


