 Open Access Article
Interlayer structure and dynamic properties of CTMAB–montmorillonite: experiment and molecular dynamics
Wei Yangabc,
Xiaohui Xiac,
Xueying Liuc and
Shaoqiu Zhang *c
*c
aKey Laboratory of Building Safety and Energy Efficiency of the Ministry of Education, College of Civil Engineering, Hunan University, Changsha 410082, China
bNational Center for International Research Collaboration in Building Safety and Environment, Hunan University, Changsha 410082, China
cCollege of Civil Engineering, Hunan University, Changsha 410082, China. E-mail: zhangshaoqiu@hnu.edu.cn
First published on 2nd May 2023
Abstract
The intercalation of cetyltrimethylammonium bromide (CTMAB) into montmorillonite will cause interlayer expansion and surface charge reversal. In this study, CTMAB–Mt is prepared by adding CTMAB with different multiples of montmorillonite cation exchange capacity (CEC), and the intercalated CTMAB structural arrangement, as well as the dynamics behavior, are investigated by combining molecular dynamics (MD) simulation with experimental characterization. According to RDF analysis of MD simulations, the interaction between CTMA+ and the surface of montmorillonite is mostly electrostatic interaction and hydrogen bond production. At low loading (≤1.00CEC), the XRD profile exhibits a peak value corresponding to one type of intercalation structure and interlayer spacing, but at high loading (>1.00CEC), two peaks are visible, each of which has a fixed value but a varied strength, corresponding to the existence of two types of expanded structures. The d-spacing (d001) values obtained from MD simulations are quite close to XRD values when CTMAB loading is lower than 1.00CEC. Density distribution profiles obtained from MD analysis reveal that as loading increases, CTMA+ is arranged in the interlayer from a monolayer to a bilayer and then to a pseudo-trilayer. At high loadings (>1.00CEC), due to the fact that the excess loading leads to inhomogenous intercalation, XRD demonstrates the existence of two different arrangements: bilayer and pseudo-trilayer. The self-diffusion coefficients of MD simulations show that the dynamic behavior of CTMA+ is influenced by both the interlayer space and the electrostatic interaction of the montmorillonite clay. The abrupt rise in interlayer spacing increases mobility, whereas the increased interaction between alkyl chains decreases mobility.
1. Introduction
Clays and clay minerals in the environment can act as natural barriers, preventing toxic species from migrating.1 Due to its low permeability, high ductility, adsorption, and cation exchange capacity (CEC), bentonite is often used in wastewater treatment and barrier systems to reduce pollutant emissions.2 Montmorillonite is the main component of bentonite. High cation adsorption, swelling capacity, and self-healing properties are the main advantages of this mineral for its effective application in engineered barriers. Isomorphic substitution of octahedra and tetrahedra sheets makes montmorillonite layers negatively charged in nature. Negative charges are usually balanced by hydrated inorganic cations (usually Na+ and Ca2+) between layers and surfaces.3 Montmorillonite has a low adsorption capacity for anionic and non-polar compounds due to its negatively charged surface and hydrophilicity.4 Modification is necessary to improve the adsorption performance of these anionic or non-polar compounds by using different modifiers. So far, numerous attempts have been made to improve the adsorption efficiency of clay-based adsorbents, including organic modification,5 acid activation,6 calcination,7 and magnetization supported by magnetic nanoparticles.8Among all, organic modification has attracted considerable attention for eliminating organic and inorganic contaminants from wastewater.9 The interlayer cations (usually Na+, K+, and Ca2+) of clay minerals can be easily exchanged by surfactants or polymers to synthesize organoclays with hydrophobic and organophilic characteristics. By selecting suitable organic surfactants and clay minerals and controlling the loading of organic modifiers, materials can be prepared with desired properties, such as increased retention capacity for anionic and non-polar compounds.3,10–12 The adsorption capacity and surface properties of montmorillonite were greatly affected by different types of modifiers and the loading of modifiers. The exchange of interlayer cations leads to changes in the interlayer space dimension, surface charge and wettability, and swelling pressure. The modification not only changed the surface properties of the clay but also affected the arrangement of the clay mineral layers, the microstructure of the particles, and thus the characteristics of the pores. The addition of organic cations to the clay structure can significantly alter its physical and chemical properties (such as adsorption capacity, wettability, porosity, or diffusivity).13 Quaternary ammonium cations (QACs) are the most widely used organic surfactants for clay modification.14 Structural change is the essential factor that affects the properties of clay, such as the diffusion transport process, which is affected by the surface composition and properties of materials in the clay barrier with low hydraulic conductivity.15 Therefore, it is an important issue to study the interfacial interaction and structural arrangement of organic clay at the nanoscale in the application of organic clay to environmental protection.
Due to the fine particle size and complex chemical composition of clays, it is difficult to obtain detailed information on the interlayer structure and the atomic local environment of organoclays from experimental measurements. Most of the experimental studies on organoclay have focused on its properties and structures, especially the changes in the interlayer structure. Advanced microscopy techniques such as scanning electron microscopy (SEM) and atomic force microscopy (AFM) are used for the detailed morphological characterization of organoclays.16 X-ray diffraction measurements have shown that the interlayer microstructure is affected by both the charge density of the clay layers and the alkyl chain length of the alkylammonium ions.17,18 Based on an all-trans configuration of surfactant after intercalation, monolayer, bilayer, pseudo-trilayer, and paraffin-monolayer and paraffin-bilayer19–21 are unrealistic. Vaia et al.20 showed on the basis of Fourier transform infrared spectroscopy (FTIR) that alkyl chains can vary from liquid like phase to solid like phase, while constrained amine chains are in varying degrees of ordered conformations. Furthermore, 13C magic-angle spinning nuclear magnetic resonance (13C MAS NMR) demonstrates that there is an extensive coexistence of gauche and trans conformers and that the complete liquidlike state does not exist.22 So the results of microscopic characterization only provide an average state of molecular arrangement and interlayer structure and cannot accurately describe the microscopic mechanism of interlayer structure and the interaction between the surfactant and the clay surface.
In recent years, molecular simulations have been widely used in the study of organoclays to explore detailed information on molecular arrangements and layering structures. The simulation results not only provide complementary evidence to the experimental results but also provide new insights into the microstructure of organoclays, especially thermodynamic and dynamic information at the atomic level.23–25 In addition to the monolayer, bilayer, and pseudo-trilayer structures proposed by the structural model, a pseudo-tetralayer structure was observed by MD simulations in the double alkyl chain modified organoclays,26 which were not discussed in previous experimental results. This means that the real structure of the organoclay is probably a lot more complicated than the model that was made based on measurements.
In this paper, cetyltrimethylammonium bromide (CTMAB) is selected as one of the most easily available QACs surfactants to synthesize organoclay, and the intercalated CTMAB structural arrangement and dynamics behavior are investigated. Characterization analysis and MD simulations will be carried out to investigate the modification mechanism, interlayer structure arrangement, and diffusion characteristics of interlayer species. MD simulations consider the effects of different loading on interface interactions and interlayer structure arrangement, providing atomic-level structural and dynamic information for CTMAB–Mt and establishing its basic structure as an effective adsorbent for pollutants.
2. Materials and methods
2.1. Materials
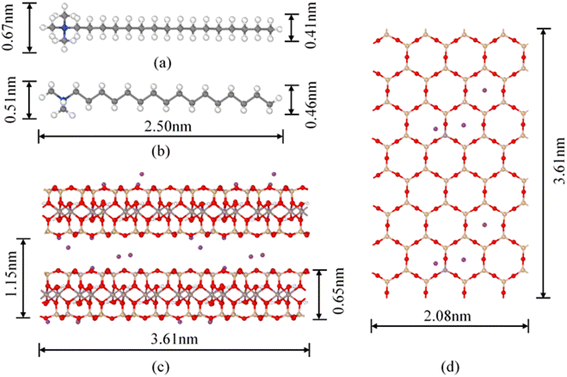
The montmorillonite (Na–Mt) was purchased from Liancheng, Fujian Province, P. R. China (primary Na form, purity >75%). The cation exchange capacity (CEC) is 83.69 cmol kg−1. The main chemical components are shown in Table 1. Cetyltrimethylammonium bromide (C19H42BrN, CTMAB) was of analytical grade and obtained from Shanghai Chemical Co., China. The structure of CTMAB is shown in Fig. 1.| SiO2 | Al2O3 | Fe2O3 | CaO | Na2O | MgO | K2O | TiO2 | P2O5 | SO3 |
|---|---|---|---|---|---|---|---|---|---|
| 62.839 | 16.337 | 5.817 | 5.399 | 3.614 | 3.224 | 1.331 | 1.331 | 0.255 | 0.136 |
2.2. Preparation of CTMAB–Mt
The CTMAB–Mt was prepared as follows: 10.0 g of montmorillonite was dispersed in 100 mL of distilled water and sonicated for 10 min to dissolve completely. Then, based on the CEC value of the Mt, a certain amount of CTMAB was added to the montmorillonite suspensions at 40 °C. The suspensions were stirred at 60 °C for 2 h. Subsequently, the products were separated by centrifugation and washed with deionized water 3–5 times until free of bromide. All products were dried for 12 hours at 105 °C and triturated into fine powders through a 200-mesh sieve. The sample was labeled as nCTMAB–Mt (n represents a multiple of CEC, n = 0.33, 0.66, 1.00, 1.33, 1.66, 2.00, and 2.66).2.3. Characterization
The chemical composition of the Na–Mt was determined by the X-ray fluorescence (XRF) method on the X-ray fluorescence spectrometer, Rigaku ZSX Primus. Small-angle X-ray diffraction tests were carried out on a Rigaku Smartlab SE with a Cu-Kα (λ = 0.154 nm) X-ray source at 40 kV and 40 mA. The scanning test range is 1.5° to 10° (2θ), and the scanning rate is 1° min−1. FTIR spectra were recorded in the 4000–400 cm−1 region on an Affinity-1S spectrophotometer using the KBr compression method. The surface morphology of the sample was observed under a scanning electron microscope (TESCAN MIRA LMS) after it was coated with gold thin films. The zeta values of Na–Mt and of CTMAB–Mt were obtained by using a Malvern Nano-ZS90.3. Computational details
3.1. Simulation model
Montmorillonite, the main component of bentonite, is a 2![[thin space (1/6-em)]](https://www.rsc.org/images/entities/char_2009.gif) :
:![[thin space (1/6-em)]](https://www.rsc.org/images/entities/char_2009.gif) 1 octahedral phyllosilicate. The clay model used in our simulations is a Wyoming-type Montmorillonite, with the unit cell formula Na0.75(Si7.75Al0.25)(Al3.5Mg0.5)O20(OH)4.27 The montmorillonite model has Al3+ → Mg2+ and Si4+ → Al3+ substitutions in the octahedral and tetrahedral layers, and the isomorphic substitutions obey the Loewenstein rule (−0.75 e per unit cell). The theoretical cation exchange capacity (CEC) for this composition is 103 cmol kg−1, which is comparable with the experimental CEC (83.69 cmol kg−1) of the montmorillonite used in the organoclay preparation. The models used in MD simulations include a model of montmorillonite layers, CTMA+ organic cations (Fig. 1) and Br−. The initial cell, used for the preparation of models, contains two montmorillonite layers based on a 4 × 4 × 2 supercell. Each slab contains 16 unit cells (4 × 4 × 1) and −12 e charges. In order to facilitate the insertion of CTMA+ cations between the layers, the montmorillonite layers were extended by 60 Å, which resulted in an expansion of the simulation cell to 20.80 × 36.06 × 143.1 Å. Considering the possible arrangement of CTMA+ between layers, the structural model of the CTMA+ organic cations was distributed between layers in an all-trans configuration with the lowest energy. Seven models of CTMAB–Mt organoclays were created to investigate the effect of the loading level intercalation structure. The CTMA+ cations were perpendicular to the layer surface, with the head groups toward the montmorillonite surface, and distributed uniformly on the surface in a bilayer arrangement. In 1.00CTMAB–Mt, interlayer Na+ cations were fully replaced by CTMA+. At other loading levels, the charge was balanced by introducing Na+ or Br− ions between the layers. Table 2 shows the contents of interlayer species with different surfactant loading levels.
1 octahedral phyllosilicate. The clay model used in our simulations is a Wyoming-type Montmorillonite, with the unit cell formula Na0.75(Si7.75Al0.25)(Al3.5Mg0.5)O20(OH)4.27 The montmorillonite model has Al3+ → Mg2+ and Si4+ → Al3+ substitutions in the octahedral and tetrahedral layers, and the isomorphic substitutions obey the Loewenstein rule (−0.75 e per unit cell). The theoretical cation exchange capacity (CEC) for this composition is 103 cmol kg−1, which is comparable with the experimental CEC (83.69 cmol kg−1) of the montmorillonite used in the organoclay preparation. The models used in MD simulations include a model of montmorillonite layers, CTMA+ organic cations (Fig. 1) and Br−. The initial cell, used for the preparation of models, contains two montmorillonite layers based on a 4 × 4 × 2 supercell. Each slab contains 16 unit cells (4 × 4 × 1) and −12 e charges. In order to facilitate the insertion of CTMA+ cations between the layers, the montmorillonite layers were extended by 60 Å, which resulted in an expansion of the simulation cell to 20.80 × 36.06 × 143.1 Å. Considering the possible arrangement of CTMA+ between layers, the structural model of the CTMA+ organic cations was distributed between layers in an all-trans configuration with the lowest energy. Seven models of CTMAB–Mt organoclays were created to investigate the effect of the loading level intercalation structure. The CTMA+ cations were perpendicular to the layer surface, with the head groups toward the montmorillonite surface, and distributed uniformly on the surface in a bilayer arrangement. In 1.00CTMAB–Mt, interlayer Na+ cations were fully replaced by CTMA+. At other loading levels, the charge was balanced by introducing Na+ or Br− ions between the layers. Table 2 shows the contents of interlayer species with different surfactant loading levels.
| Loading levels | Na0.75(Si7.75Al0.25)(Al3.5Mg0.5)O20(OH)4 | ||
|---|---|---|---|
| Na+ | CTMA+ | Br− | |
| 0.33CEC | 16 | 8 | 0 |
| 0.66CEC | 8 | 16 | 0 |
| 1.00CEC | 0 | 24 | 0 |
| 1.33CEC | 0 | 32 | 8 |
| 1.66CEC | 0 | 40 | 16 |
| 2.00CEC | 0 | 48 | 24 |
| 2.66CEC | 0 | 64 | 40 |
3.2. Simulation details
The CLAYFF force field is a general force field for clay minerals that has been proven to be suitable for the simulation of multicomponent mineral systems.28 The most significant advantage of CLAYFF is the use of a more reasonable partial atomic charge calculated by the density functional to replace the complete atomic charge, which could adapt to the charge balance method and avoid generating excessive electrostatic potential. The CVFF is a generalized valence force field that can be used to model amino acids and small organic structure molecules.29 To describe the interaction between the mineral surface and CTMAB, a combination of CLAYFF and CVFF force field was used. The combined force field maintained the structures of the different phases and also guaranteed flexibility and full interactions between the phases. It has been successfully used in the simulations of mineral–organic interfaces and validated in the simulations of alkylammonium intercalated montmorillonite.30The total energy of the simulated system included coulombic interaction, van der Waals interaction, and bonded interaction. The total potential energy for the system can be calculated by eqn (1) (more details are in Table 3).
| Etotal = EVDW + Ecoulombic + Ebond_stretch + Eangle_stretch + Etorsion | (1) |
| Energy term | Potential term | Equation | Interacting atoms | Applied to |
|---|---|---|---|---|
| a Where: σij and εij are the Lennard-Jones size parameters and well-depth, respectively. Lorentz-Bertholet combining rule is used in the Lennard-Jones parameters calculation;31 e is the charge of electron; ε0 is dielectric permittivity of vacuum; qi and qj are the partial charges of atom i and j; rij is the distance between atoms i and j. r0 and θ0 are the equilibrium values of radius and angle; k1–k3 are the prefactors; d = ±1, n is an integer. | ||||
| van der Waals | Lennard-Jones (12–6) |  |
2 | Any 2 atoms |
| Coulombic | Coulombic |  |
2 | Any 2 pairs |
| Bond stretch | Harmonic | Ebond-stretch = k1 (rij − r0)2 | 2 | O–H bond; CTMA+ |
| Angle bend | Harmonic | Eangle-bond = k2 (θijk − θ0)2 | 3 | CTMA+ |
| Torsional | Harmonic | Etorsion = k3[1 + d![[thin space (1/6-em)]](https://www.rsc.org/images/entities/char_2009.gif) cos(nϕ)] cos(nϕ)] |
4 | CTMA+ |
The first two terms of the total energy contributed were the Lennard-Jones potential (12–6 potential) and coulombic potential energy terms, and the sum of them represented the noncovalent interaction that is universal for two atoms. These parameters for all nonbonding and bonding are collected in Tables 4–6.
| Species | Symbol | Charge (e) | D0 (kcal mol−1) | σ0 (Å) |
|---|---|---|---|---|
| Hydroxyl hydrogen | Ho | 0.425 | ||
| Hydroxyl oxygen | Oh | −0.95 | 0.1554 | 3.1655 |
| Bridging oxygen | Os | −1.05 | 0.1554 | 3.1655 |
| Bridging oxygen with octahedral substitution | Obos | −1.1808 | 0.1554 | 3.1655 |
| Bridging oxygen with tetrahedral substitution | Obts | −1.1688 | 0.1554 | 3.1655 |
| Bridging oxygen with double substitution | Obss | −1.2996 | 0.1554 | 3.1655 |
| Hydroxyl oxygen with substitution | Ohs | −1.0808 | 0.1554 | 3.1655 |
| Tetrahedral silicon | St | 2.1 | 1.8405 × 10⁻⁶ | 3.3020 |
| Octahedral aluminum | Ao | 1.575 | 1.3298 × 10⁻⁶ | 4.2712 |
| Tetrahedral aluminum | At | 1.575 | 1.8405 × 10⁻⁶ | 3.3020 |
| Octahedral magnesium | Mgo | 1.36 | 9.0298 × 10⁻⁷ | 5.2643 |
| Sodium ion | Na | 1 | 0.1301 | 2.3500 |
| Ammonium N | N | −0.68 | 0.1670 | 3.5012 |
| Methyl carbon–CH3 | C3 | (−0.3, 0.12) | 0.0390 | 3.8754 |
| Organic hydrogen | H | 0.1 | 0.0380 | 2.4500 |
| Alkyl carbon–CH2 | C2 | (−0.2, 0.22) | 0.0390 | 3.8754 |
| Bromide | Br | −1 | 0.09 | 4.6238 |
| Bond stretch | |||
|---|---|---|---|
| Species i | Species j | k1 (kcal mol−1 Å−2) | r0 (Å) |
| Oh | Ho | 554.1349 | 1 |
| Ohs | Ho | 554.1349 | 1 |
| N | C3 | 356.5988 | 1.47 |
| N | C2 | 356.8988 | 1.47 |
| C3 | H | 340.6175 | 1.105 |
| C2 | C2 | 322.7158 | 1.526 |
| C2 | H | 340.6175 | 1.105 |
| C3 | C2 | 322.7158 | 1.526 |
| Angle bend | ||||
|---|---|---|---|---|
| Species i | Species j | Species k | k2 (kcal mol−1 rad−2) | θ0 (deg) |
| C3 | N | C3 | 86.3 | 112 |
| C3 | N | C2 | 86.3 | 112 |
| N | C3 | H | 57.3 | 109.5 |
| H | C3 | H | 39.5 | 106.4 |
| N | C2 | C2 | 50 | 109.5 |
| N | C2 | H | 57.3 | 109.5 |
| C2 | C2 | H | 44.4 | 110 |
| H | C2 | H | 39.5 | 106.4 |
| C2 | C2 | C2 | 46.6 | 110.5 |
| C3 | C2 | C2 | 46.6 | 110.5 |
| C3 | C2 | H | 44.4 | 110 |
| C2 | C3 | H | 44.4 | 110 |
| Torsional | ||||||
|---|---|---|---|---|---|---|
| Species i | Species j | Species k | Species l | K (kcal mol−1) | d | n |
| C3 | N | C3 | H | 0.0889 | 1 | 3 |
| C2 | N | C3 | H | 0.0889 | 1 | 3 |
| C3 | N | C2 | C2 | 0.0889 | 1 | 3 |
| C3 | N | C2 | H | 0.0889 | 1 | 3 |
| N | C2 | C2 | C2 | 0.1581 | 1 | 3 |
| N | C2 | C2 | H | 0.1581 | 1 | 3 |
| C2 | C2 | C2 | H | 0.1581 | 1 | 3 |
| H | C2 | C2 | H | 0.1581 | 1 | 3 |
| C2 | C2 | C2 | C2 | 0.1581 | 1 | 3 |
| C3 | C2 | C2 | C2 | 0.1581 | 1 | 3 |
| C3 | C2 | C2 | H | 0.1581 | 1 | 3 |
| H | C3 | C2 | C2 | 0.1581 | 1 | 3 |
| H | C3 | C2 | H | 0.1581 | 1 | 3 |
In this study, all MD simulations were performed with the Large-scale Atomic/Molecular Massively Parallel Simulator (LAMMPS) software.32 Periodic boundary conditions were imposed on the three dimensions so that clay minerals basal surfaces were in contact with the organic cations. To obtain the trajectories, the Newton equations of motion were integrated numerically using the velocity Verlet algorithm with a time step of 1.0 fs. The short-range van der Waals and coulombic interactions were truncated using 10.0 Å and 12.0 Å cutoffs, respectively. Long-range coulombic electrostatic interactions were computed using Ewald33 summation. During the simulations, the montmorillonite slab was kept rigid and only the inner hydroxyl groups were allowed to move to reduce the errors caused by the “frozen” approach. After the initial configurations, energy minimization was performed using the conjugate gradient method to eliminate unreasonable contacts. The temperature and pressure were controlled using the Nose–Hoover34 thermostat and Hoover35 barostat method, respectively. First, the microcanonical ensemble (NVE) was performed for 0.1 ns at 298 K to relax the system. Then isothermal-isobaric ensemble (NPT) simulations were performed to achieve equilibrium in 2.5 ns and the last 0.5 ns to record the basal spacing at 298 K and 1 atm. Finally, a further 1 ns canonical ensemble (NVT) simulation was performed following the previous 2.5 ns NPT simulation to obtain the interlayer space structures and dynamics properties at 298 K.
3.3. MD calculations
The spatial distribution of interlayer species is represented by the atomic density profiles along the z direction, which are averaged over the NVT trajectories. By taking the plane defined by the average bottom surface O positions as the origin of z, the ρ(z) for the system can be calculated by eqn (2).
 | (2) |
Radial distribution function (RDF) can provide structural information about ions between interlayers, which is beneficial to understanding the aggregation state of substances. The bonding behaviors of the interlayer species in the CTMAB–Mt can be explored based on their RDF and coordination numbers (CN). It was calculated according to eqn (3).
 | (3) |
As an important parameter for kinetic analysis, the motion characteristics of the ions and solvent molecules are usually evaluated by the mean square displacement (MSD) evolution, which is the statistical mean of the particle trajectory with time. Using the mean square displacement, the self-diffusion coefficient can be calculated from the following Einstein relation:36
 | (4) |
 is the centroid position of atom i at the time of t, and
  is the centroid position of atom i at the time of 0. The self-diffusion coefficient could be calculated from the slope of a linear regression between MSD and time.
4. Results and discussions
4.1. CTMA–Mt modification mechanism
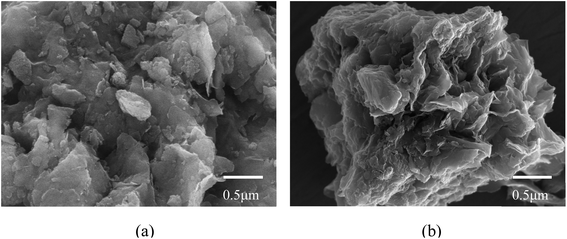
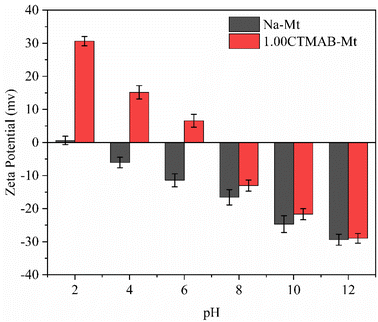
The morphological characteristics of montmorillonite particles are extremely influenced by the inhibitive potential of their environment. It is generally proved that Na–Mt layers normally aggregate face-to-face before hydrating. Na–Mt (Fig. 2a) has a smooth lamellar structure. In contrast, the CTMAB–Mt (Fig. 2b) has obvious layered curls and folds, which may affect the adsorbability.Zeta potential can show the charges at the interface of montmorillonite particles and their corresponding aqueous solution. It can be seen from Fig. 3 that Na–Mt has a zero electrical potential (Pzc) at pH = 2 and remains negatively charged at other pH values due to the large number of isomorphic substitutions in octahedral and tetrahedral sheets. Due to the CTMAB modification, the surface charge is reversed to positive at acidic conditions for CTMAB–Mt when compared to Na–Mt. While at alkaline condition, the CTMAB–Mt pose a negatively charge surface, but with a lower charge density than that for Na–Mt. The Pzc of CTMAB–Mt is between pH = 6 and 8, and the zeta potential of CTMAB–Mt changes from a negative value (−11.43 mV) to a positive value (6.56 mV) at pH = 6. That is because the surface and interlayer cations of montmorillonite are exchanged by CTMA+ cations, and the large potential difference is mainly dependent on the cation exchange between layers. The positive zeta potential of CTMAB–Mt increased the adsorption capacity of anions. The zeta potential of montmorillonite is determined by both the permanent negative surface charge and the pH-dependent edge charge. The zeta potential of Na–Mt and CTMA–Mt gradually decreases with the increase in pH value due to the edge charge of clay changes from positive to negative as the pH increases. The hydroxyl group (Al/Si–OH) present at the edge of the montmorillonite particle can gain or lose a proton, which creates an additional pH-dependent contribution to the surface charge.37,38
The FTIR spectra of Na–Mt and CTMAB–Mt clearly confirm the successful intercalation of CTMAB chains into the interlayer space of montmorillonite (Fig. 4). Characteristic absorption bands appear in the Na–Mt and CTMAB–Mt sample at 3627 cm−1 (–OH stretching of Al, Mg(OH)), 1033 cm−1 (stretching vibration of Si–O–Si), and 518 cm−1 (bending vibration band of Si–O). The existence of the above three peaks indicates that the crystalline structure of Na–Mt has not changed after modification. The broad absorption bands at 1644 cm−1 and 3420 cm−1 are assigned to the –OH bending vibration and stretching vibration of water absorbed by the Na–Mt interlayer. Peak weakening at 3420 cm−1 is observed in the FTIR spectra (Fig. 4a) of CTMAB–Mt, suggesting the surface properties of Na–Mt had been changed from hydrophilic to hydrophobic by modifying it with CTMAB. All CTMAB–Mt samples show additional absorption bands at 2926 and 2853 cm−1 (asymmetric and symmetric stretching vibrations of –CH2–) and at 1473 cm−1 (bending vibrations of C–H of the methyl group of the ammonium groups), evidencing the incorporation of CTMAB into the structure of the clay. With increasing the CTMAB loading, the peak intensity and peak area of the CTMAB–Mt related absorption bands at 2926 and 2853 cm−1 shift toward lower frequencies (Fig. 4b), suggesting a transition from a disordered liquid like conformation of CTMAB alkyl chains at low loadings to a more ordered state at high loadings where the modifier alkyl chains exhibit well-aligned trans conformations.39
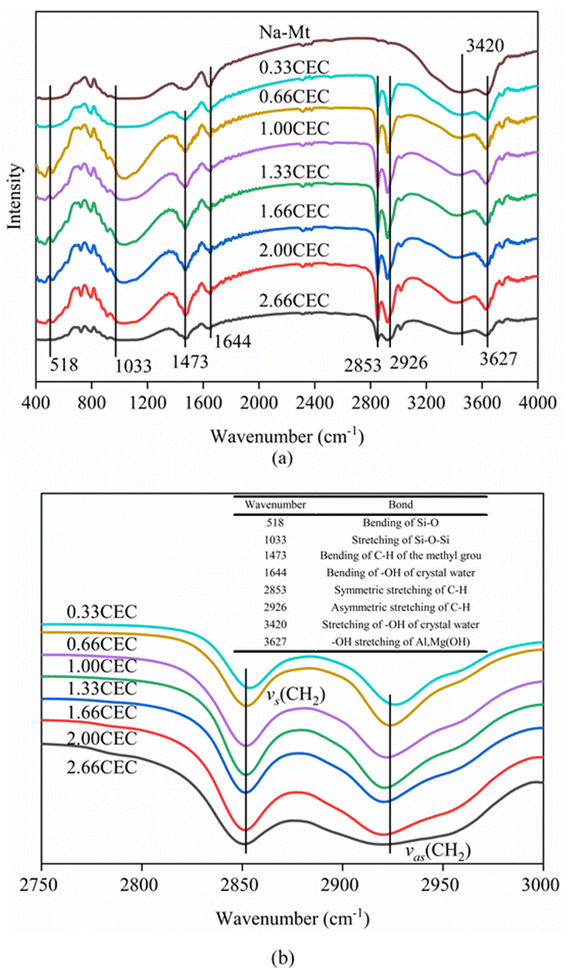 | ||
| Fig. 4 FTIR spectra of Na–Mt and CTMAB–Mt: (a) the region of 400–4000 cm−1; (b) the region of 2750–3000 cm−1. | ||
The interactions between CTMAB and Na–Mt surfaces in the CTMAB–Mt can be quantified based on their radial distribution functions (RDF) and coordination numbers (CN). Fig. 5 illustrates the curves of the RDF of the surface Os of the clay silicate layer around ammonium N, surface Os around alkyl C2, surface Os around methyl C3 and surface Os around hydrogen. The gN–Os(r) curves show the first peak at near 4.1–4.62 Å in all loadings and the average CN of N–Os are about 12 in 0.33CEC and 6 in other loadings, indicating that ammonium N all locate above the surface six-member rings and coordinate with surface Os (Fig. 6). Because methyl C3 is attached to ammonium N as the entire head group, the RDF for C3–Os is similar to that of N–Os, with the first peak located near 3.54–3.66 Å in all loadings. The g(r)C2–Os curves only show one peak at 0.33CEC and no peaks at other loading levels. It can be inferred that CTMA+ organic cations are strongly affected by the upper and lower silicate surfaces, and the migration between layers is mainly horizontal. The limitation of longitudinal displacement allows the coordination to peak at 4.86 Å. The RDF for H–Os in CTMAB has no distinct peaks at 0.33 and 0.66CEC, while the first peak appears at 3.06 Å at other loadings. At 0.33 and 0.66CEC, CTMA+ is strongly attracted by the upper and lower silicate surfaces, which makes the CTMA+ farther away from the surface of montmorillonite than other loadings. It is consistent with the gN–Os(r) results which the first peak appears at 4.62 Å at 0.33 and 0.66CEC, and at about 4.14 Å for other loadings. In general, CTMA+ and montmorillonite are mainly combined by electrostatic interaction at 0.33 and 0.66CEC, and stabilized in the interlayer by both electrostatic interaction and hydrogen bond when the loading exceeds 0.66CEC.
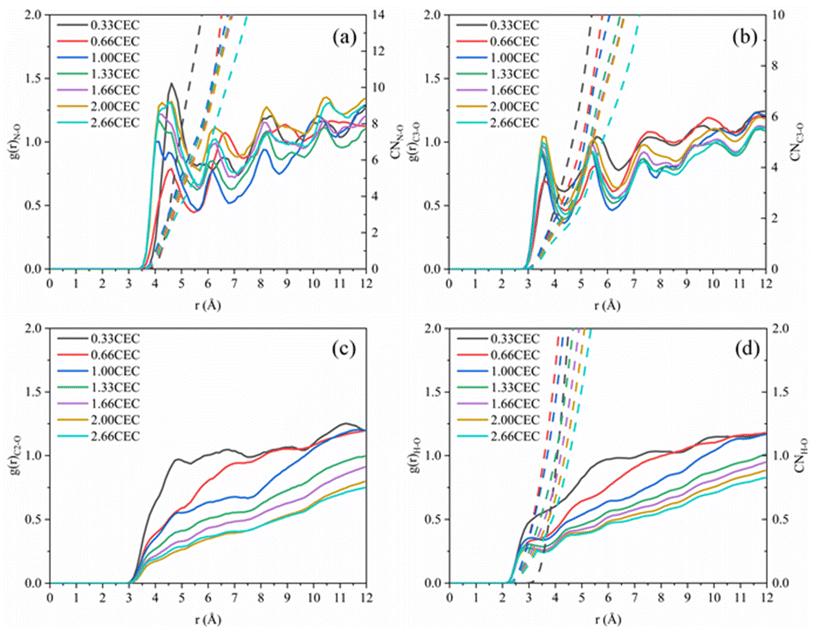 | ||
| Fig. 5 Radial distribution functions: (a) g(r)N–Os; (b) g(r)C3–Os (–CH3); (c) g(r)C2–Os (–CH2); (d) g(r)H–Os. | ||
 | ||
| Fig. 6 Top view of the interlayer snapshot at 1.00CEC. On the left, H atoms have been removed for a better view of the head group position. | ||
4.2. Structural characterization
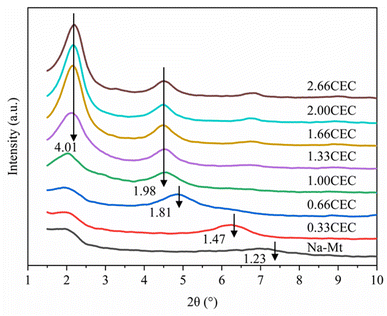
The X-ray diffraction results of Na–Mt and CTMAB–Mt are shown in Fig. 7. For Na–Mt, a broad peak is observed at 2θ = 7.17°, corresponding to an interlayer spacing (d001) of 1.23 nm. With the addition of CTMAB, the peak positions shift gradually to lower angles, implying that the d001 of the CTMAB–Mt is gradually expanded with increased CTMAB loading. When CTMAB loading approaches and exceeds 1.00CEC, the XRD patterns show much sharper basal reflections and twin peaks, which indicates that the over intercalation of CTMAB resulted in two types of expanded structures with d001 of 1.98 nm and 4.01 nm, respectively. The peak of d001 = 1.98 nm does not change with the increase of modifier, but the peak of d001 = 4.01 nm becomes stronger with the increased loading. Only one peak in the XRD patterns is observed when the loading of CTMAB is below 1.00CEC, indicating that the intercalation is homogenous. Compared with lower loadings (≤1.00CEC), the intensity of the first peak with high loadings (>1.00CEC) is significantly higher than the second peak, indicating a well-developed crystal structure has been formed.The d001 of the experimental and simulated CTMAB–Mt are shown in Table 7. The simulation results are basically the same as the experimental results at the loading (≤1.00CEC). When the loading exceeds 1.00CEC, the d001 of the experimental results corresponds to the simulation results under 1.00 and 2.66CEC system, which shows that CTMAB–Mt mainly exists as the interlayer loading of 1.00 and 2.66CEC. It can be seen that with the increase of the loading, d001 is a process of approximately linear growth from the simulation results, which is different from the experimental results at the loading (≥1.00CEC). That is because in the simulations, the intercalation of CTMAB was set in advance uniformly into the interlayer space of the montmorillonite. However, the amount of CTMAB intercalation between layers may not be uniform in the real intercalation process, which makes the simulation results slightly different.
| Loading level (this work) | Simulation (Å) (this work) | Experiment (Å) (this work) | Loading level40 | Experiment40 (Å) |
|---|---|---|---|---|
| 0.33CEC | 14.38 | 14.71 | 0.2CEC | 14 |
| 0.66CEC | 16.39 | 18.16 | 0.4CEC | 16 |
| 1.00CEC | 19.41 | 19.61 | 0.6CEC | 18 |
| 1.33CEC | 23.86 | 19.87/40.11 | 1.0CEC | 21 |
| 1.66CEC | 27.21 | 19.87/40.11 | 1.5CEC | 19/38 |
| 2.00CEC | 30.82 | 19.87/40.11 | 2.0CEC | 19/38 |
| 2.66CEC | 38.55 | 19.87/40.11 | 2.5CEC | 19/38 |
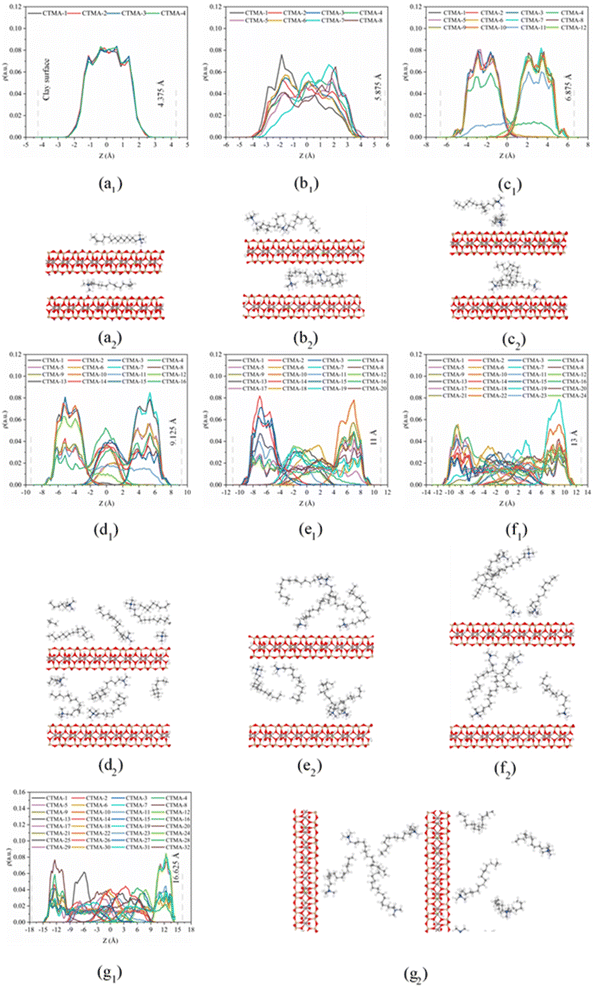
On the basis of the measured basal spacing and the length of the alkyl chains, various arrangement models have been proposed for the intercalated surfactants, including monolayer, bilayer, pseudo-trilayer, paraffin-monolayer, and paraffin-bilayer.24 These idealized models assume that the intercalated surfactants adopted an all-trans conformation after intercalation. To further clearly show the intercalated CTMAB structure arrangement at different loading levels, the density distribution profiles for CTMA+ chains as a function of surface distance (Z–Z0) and the snapshots at different loading levels are shown in Fig. 8. The density distribution profiles along the z direction of CTMA+ are statistically averaged under the last 0.5 ns NVT ensemble after the simulation is stabilized. There is only one clear peak for all CTMA+ cations from the density distribution at 0.33CEC (Fig. 8a1), and the thickness between the occupied layers is about 5 Å, which is comparable to the thickness of the CTMA+ (Fig. 1b), indicating that the CTMA+ is monolayer arrangement and parallel to the silicate surface (Fig. 8a2). The CTMA+ organic cations have two split peaks at 1.00CEC (Fig. 8c1), each with a width of about 5 Å, indicating that a bilayer arrangement has been formed. In addition to the CTMA+ monolayer parallel to the silicate surface, it can also be observed that based on the monolayer, part of the long chain is distributed in the other layer (Fig. 8c2). The CTMA+ starts to split slightly (Fig. 8b1), and the thickness increases to about 8 Å indicating that there is a transition state between monolayer and bilayer (Fig. 8b2). When the loading exceeds 1.00CEC, the CTMA+ is arranged as a pseudo-trilayer. Three peaks can be clearly seen on the density distribution profiles (Fig. 8d1–g1), and the methylene group is likely to jump to the middle layer because of the existence of the intermediate peak. It can also be observed that CTMA+ cations begin to tilt to the silicate surface, and the tilt angle becomes larger and larger (Fig. 8d2–g2). In fact, there are also monolayer and paraffin type CTMA+ cations in the pseudo-trilayer arrangement. With increasing addition loading, the proportion of monolayer CTMA+ decreases and the paraffin type arrangement increases. Paraffin-monolayer (Fig. 8d2) and paraffin-bilayer (Fig. 8d2–g2) appear in the pseudo-trilayer arrangement, so the pseudo-trilayer can also be considered a transition state from bilayer to paraffin type.
4.3 Diffusion behavior of intercalated CTMA+
Fig. 9 shows the self-diffusion coefficient of CTMA+ cations (Da) of different CTMAB–Mt systems and the change in interlayer spacing under adjacent loading. It can be seen that the loading of CTMA–Mt can affect the mobility of the CTMA+ cations in the interlayer. From 0.33CTMAB–Mt to 1.00CTMAB–Mt, the self-diffusion coefficients of CTMA+ cations gradually decrease because, when the loading is low, the number of CTMA+ is small and CTMA+ can diffuse freely, so the mobility is strong. Although the interlayer spacing increases as the loading increases, the CTMA+ arrangement changes from monolayer to bilayer, but the interaction of the CTMA+ alkyl chains is enhanced and the diffusion space is limited, so the self-diffusion coefficients decrease. The self-diffusion coefficients of CTMA+ increase gradually from 1.00CTMAB–Mt to 1.33CTMAB–Mt. At this point, CTMA+ interpass insertion causes the interlayer spacing to increase dramatically (Δd = 4.45 Å). The arrangement of CTMA+ changes from bilayer to pseudo-trilayer, and the diffusion space becomes larger. The self-diffusion coefficients decrease gradually from 1.33CTMAB–Mt to 2.66CTMAB–Mt because the decrease in the spacing between alkyl chains leads to an increase in dipole interaction in the pseudo-trilayer arrangement. The head group of CTMA+ is preferentially adsorbed toward the near position of the montmorillonite surface with increasing loading because of strong electrostatic interaction. The head group of CTMA+ is adsorbed to be stable on the silicate surface, while the alkyl chains have a higher mobility than the head group (Fig. 10). The head group is close to the center position above the surface six-member ring and has small mobility (Fig. 10a1 and b1). The alkyl chains have a wider diffusion range in space (Fig. 10a2 and b2). The organic phase formed by the aggregation of alkyl chains between layers can increase the compatibility of organic compounds. The above results show that the self-diffusion coefficient of CTMA+ cations is the lowest in the bilayer arrangement. Under the pseudo-trilayer arrangement, the increase in CTMA+ cations will slightly reduce the mobility.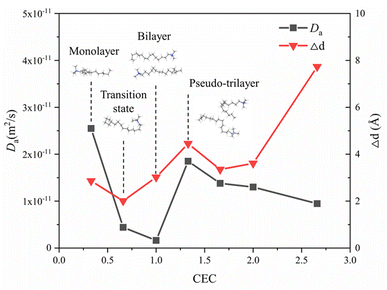 | ||
| Fig. 9 Self-diffusion coefficients of CTMA+ cations at different loading levels and variation of interlayer spacing of adjacent loading. | ||
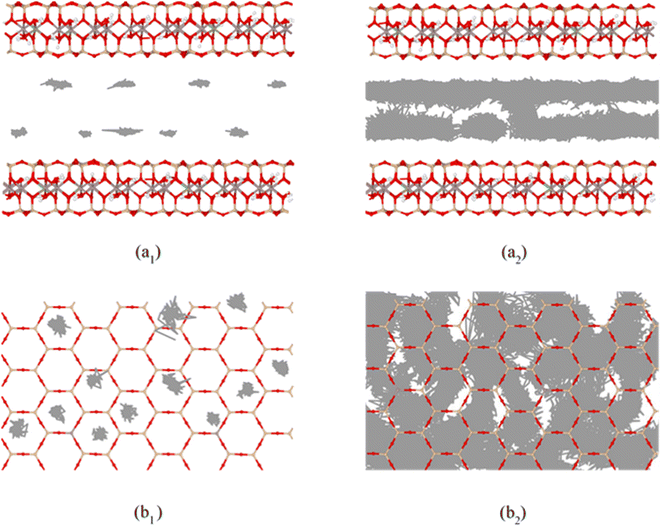 | ||
| Fig. 10 Trajectories of amino N (*1) and alkyl C2 (*2) in CTMA+ cations at 1.00CTMAB–Mt: (a) side view; (b) top view, entire trajectories trace the motion in the last 1 ns NVT ensemble. | ||
5. Conclusions
Characterization techniques and MD simulations were used to investigate the intercalated CTMAB structural arrangement and dynamics behavior under different loading levels. The specific conclusions are as follows:The successful loading of CTMAB will change the structure of montmorillonite, forming layered curls, folds, and rough particles, and the surface potential will reverse. The interaction between CTMA+ and the surface of montmorillonite is mainly electrostatic interaction and hydrogen bond formation. CTMAB is successfully intercalated into the interlayer, and it is evenly intercalated into only one type of intercalated structure at low loading (≤1.00CEC), while it has the existence of both bilayer and pseudo-trilayer structures at high loading (>1.00CEC), with d001 of 1.98 nm and 4.01 nm, respectively. The change in arrangement of CTMA+ between layers includes monolayer, bilayer and pseudo-trilayer with increasing loading. Paraffin type CTMA+ cations are found in the pseudo-trilayer arrangement. It can be considered that the pseudo-trilayer is a transition state from the bilayer to the paraffin type. The size of the diffusion space and the interaction of the alkyl chains affect the mobility of CTMAB.
Author contributions
Wei Yang: investigation, data curation, writing – original draft, funding acquisition. Xiaohui Xia investigation, data curation, software, formal analysis, methodology, software, writing – original draft. Xueying Liu: investigation, data curation, software, formal analysis, methodology, writing – original draft. Shaoqiu Zhang: investigation, data curation, experiment.Conflicts of interest
The authors declare that they have no known competing financial interests or personal relationships that could have appeared to influence the work reported in this paper.Acknowledgements
This work was supported by the National Natural Science Foundation of China [grant number 52078207, 41807261]; the science and technology innovation Program of Hunan Province [grant number 2022RC1174].References
- E. Alvarez-Ayuso and A. Garćia-Śanchez, Clays Clay Miner., 2003, 51, 475–480 CrossRef CAS.
- H. Murray, Clay Sci., 2006, 2, 106–112 Search PubMed.
- Q. Zhou, R. Zhu, S. C. Parker, J. Zhu, H. He and M. Molinari, RSC Adv., 2015, 5, 47022–47030 RSC.
- J. A. Smith and A. Galan, Environ. Sci. Technol., 1995, 29, 685–692 CrossRef CAS PubMed.
- X. Jin, M. qin Jiang, X. quan Shan, Z. guo Pei and Z. Chen, J. Colloid Interface Sci., 2008, 328, 243–247 CrossRef CAS PubMed.
- C. Breen, F. D. Zahoor, J. Madejová and P. Komadel, J. Phys. Chem. B, 1997, 101, 5324–5331 CrossRef CAS.
- K. G. Bhattacharyya and S. Sen Gupta, Appl. Clay Sci., 2009, 46, 216–221 CrossRef CAS.
- L. Cottet, C. A. P. Almeida, N. Naidek, M. F. Viante, M. C. Lopes and N. A. Debacher, Appl. Clay Sci., 2014, 95, 25–31 CrossRef CAS.
- S. Mao and M. Gao, J. Mol. Liq., 2021, 334, 116143 CrossRef CAS.
- C. C. Wang, L. C. Juang, C. K. Lee, T. C. Hsu, J. F. Lee and H. P. Chao, J. Colloid Interface Sci., 2004, 280, 27–35 CrossRef CAS PubMed.
- S. Q. Zhang, W. Yang, R. P. Chen, X. Kang and M. J. Ren, Environ. Technol., 2022, 1–13 Search PubMed.
- L.-L. Zhang, A. Zaoui, W. Sekkal and Y.-Y. Zheng, J. Hazard. Mater., 2022, 442, 130107 CrossRef PubMed.
- G. Rytwo, Y. Gonen, S. Afuta and S. Dultz, Appl. Clay Sci., 2005, 28, 67–77 CrossRef CAS.
- S. E. Burns, S. L. Bartelt-Hunt, J. A. Smith and A. Z. Redding, J. Geotech. Geoenviron. Eng., 2006, 132, 1404–1412 CrossRef CAS.
- B. Schampera, R. Šolc, D. Tunega and S. Dultz, Appl. Clay Sci., 2016, 120, 91–100 CrossRef CAS.
- M. Ataeefard and S. Moradian, Appl. Surf. Sci., 2011, 257, 2320–2326 CrossRef CAS.
- M. Pospíšil, P. Čapková, D. Měřínská, Z. Maláč and J. Šimoník, J. Colloid Interface Sci., 2001, 236, 127–131 CrossRef PubMed.
- Q. H. Zeng, A. B. Yu, G. Q. Lu and R. K. Standish, J. Phys. Chem. B, 2004, 108, 10025–10033 CrossRef CAS.
- G. Lagaly, Clay Miner., 1981, 16, 1–21 CrossRef CAS.
- R. A. Vaia, R. K. Teukolsky and E. P. Giannelis, Chem. Mater., 1994, 6, 1017–1022 CrossRef CAS.
- G. Lagaly, Solid State Ionics, 1986, 22, 43–51 CrossRef CAS.
- L. Q. Wang, J. Liu, G. J. Exarhos, K. Y. Flanigan and R. Bordia, J. Phys. Chem. B, 2000, 104, 2810–2816 CrossRef CAS.
- E. Hackett, E. Manias and E. P. Giannelis, J. Chem. Phys., 1998, 108, 7410–7415 CrossRef CAS.
- H. He, J. Galy and J. F. Gerard, J. Phys. Chem. B, 2005, 109, 13301–13306 CrossRef CAS PubMed.
- M. Pospíšil, P. Čapková, H. Weissmannová, Z. Klika, M. Trchová, M. Chmielová and Z. Weiss, J. Mol. Model., 2003, 9, 39–46 CrossRef PubMed.
- Q. H. Zeng, A. B. Yu, G. Q. Lu and R. K. Standish, Chem. Mater., 2003, 15, 4732–4738 CrossRef CAS.
- W. Yang and A. Zaoui, J. Hazard. Mater., 2013, 261, 224–234 CrossRef CAS PubMed.
- R. T. Cygan, J. J. Liang and A. G. Kalinichev, J. Phys. Chem. B, 2004, 108, 1255–1266 CrossRef CAS.
- P. Dauber-Osguthorpe, V. A. Roberts, D. J. Osguthorpe, J. Wolff, M. Genest and A. T. Hagler, Proteins: Struct., Funct., Bioinf., 1988, 4, 31–47 CrossRef CAS PubMed.
- X. Liu, X. Lu, R. Wang, H. Zhou and S. Xu, Clays Clay Miner., 2007, 55, 554–564 CrossRef CAS.
- M. P. Allen, D. J. Tildesley and J. R. Banavar, Phys. Today, 1989, 42, 105–106 CrossRef.
- S. Plimpton, J. Comput. Phys., 1995, 117, 1–19 CrossRef CAS.
- P. P. Ewald, Ann. Phys., 1921, 369, 253–287 CrossRef.
- W. G. Hoover, Phys. Rev. A, 1985, 31, 1695–1697 CrossRef PubMed.
- S. Melchionna, G. Ciccotti and B. Lee Holian, Mol. Phys., 1993, 78, 533–544 CrossRef CAS.
- A. Rahman, Phys. Rev., 1964, 136, A405–A411 CrossRef.
- T. Missana and A. Adell, J. Colloid Interface Sci., 2000, 230, 150–156 CrossRef CAS PubMed.
- A. dos Santos, M. F. Viante, D. J. Pochapski, A. J. Downs and C. A. P. Almeida, J. Hazard. Mater., 2018, 355, 136–144 CrossRef CAS PubMed.
- P. Huang, A. Kazlauciunas, R. Menzel and L. Lin, ACS Appl. Mater. Interfaces, 2017, 9, 26383–26391 CrossRef CAS PubMed.
- L. Lu, M. Gao, Z. Gu, S. Yang and Y. Liu, J. Environ. Sci., 2014, 26, 2535–2545 CrossRef PubMed.
| This journal is © The Royal Society of Chemistry 2023 |

