 Open Access Article
UiO-66 derived ZrO2@C catalysts for the double-bond isomerization reaction of 2-butene
Xiaoping Chen ab,
Xianfei Wangb,
Wei Liub,
Hui Tian
 b,
Yupeng Du
 b,
Haisheng Wei
 b and
Linsheng Tang*a
aCollege of Chemical Engineering, Qingdao University of Science and Technology, Qingdao 266042, China. E-mail: linshengt62@163.com
bCollege of Chemistry and Chemical Engineering, Yantai University, Yantai 264005, China
First published on 26th May 2023
Abstract
1-Butene, as one of the widely used chemical raw materials, can be produced by the double bond isomerization of 2-butene. However, the current yield of the isomerization reaction is only up to 20% or so. It is therefore an urgent issue to develop novel catalysts with higher performances. In this work, a high-activity ZrO2@C catalyst that is derived from UiO-66(Zr) is fabricated. The catalyst is prepared by calcining the precursor UiO-66(Zr) at high temperature in nitrogen, and characterized by XRD, TG, BET, SEM/TEM, XPS and NH3-TPD. The results demonstrate that the calcination temperature has significant influences on the catalyst structure and performance. Regarding the catalyst ZrO2@C-500, the selectivity and yield of 1-butene are 94.0% and 35.1%, respectively. The high performance is due to multiple aspects, including the inherited octahedral morphology from parent UiO-66(Zr), suitable medium-strong acidic active sites and high surface area. The present work will lead to a better understanding of the ZrO2@C catalyst and guide the rational design of high-activity catalysts for the double bond isomerization of 2-butene to 1-butene.
1 Introduction
1-Butene is one of the key raw materials to produce linear low-density polyethylene (LLDPE), high-density polyethylene (HDPE), polybutylene (PB) resins,1–3 and other chemicals such as sec-butanol4 and butadiene.5 Generally, 1-butene is obtained via separation from mixed C4 in a fluid catalytic cracking (FCC) unit or the C4 mixture in a steam cracking (SC) plant.6 Nevertheless, the content of 1-butene in C4 mixtures is commonly low, namely 15–20%. As a matter of fact, the remaining C4 mixture after the separation of 1-butene is rich in 2-butene, including cis-2-butene and trans-2-butene, which can be just used as a fuel. However, 2-butene can be utilized together with 1-butene to produce methyl ethyl ketone (MEK) via the hydration of 1-butene/2-butene7 or isobutene via the skeletal isomerization of the linear butene8 or propylene via butene cross-metathesis.9 Recently, the conversion of 2-butene into 1-butene via double bond isomerization has also been paid much attention in both academia and industry. Typical processes for converting 2-butene to 1-butene include the French Institute of Petroleum (IFP) process,10,11 the DOW chemical process,12 the LUMMUS process,13 and the Shanghai Petrochemical Research Institute process.14,15As the double bond isomerization of 2-butene to 1-butene is an acid catalyzed reaction, the commonly used catalysts are various acid catalysts, such as molecular sieves catalysts,16,17 metal oxides catalysts,18 sulphates/phosphates19 cation exchange resins,20,21 metal-based catalysts with ionic polymers or metal oxides as support22–25 are adopted. However, the reported yield of 1-butene is only 20% or so by using these catalysts. And the further separation process for the products and reactants is often by precision distillation or extractive distillation,26,27 or by absorption with zeolite28 or MOFs,29 with a complex process and high energy consumption. Therefore, higher yield of 1-butene can decrease the corresponding energy consumption and economic cost.
Metal organic frameworks (MOFs), as a porous material composed of metal nodes and organically linked ligands, can be utilized as acid catalysts by pre-/post-treatments.30–33 The unique multidimensional regular pore structure of MOFs makes them a proper choice for catalyst carriers. However, the microporous structure of MOFs limits the physical diffusion of reactants and products, which gives rise to significantly insufficient contact of reactants with the catalytic active site.34–36 Therefore, increasing the pore diameter, reducing the influence of diffusion on the reaction, and improving the catalytic activity have become hot topics in developing MOF-derived catalysts.37,38
The addition of a third substance39 or the elevated temperature during the synthesis of MOFs40–43 can disrupt parts of the regular and ordered structures, exposing more active centers and increasing the pore diameter. For instance, Z. Hasan et al.40 prepared Zirconia–carbon (ZC) via calcination of UiO-66 and amino-functionalized UiO-66 under N2 atmosphere. Li et al.41 prepared a CaO/ZrO2 catalyst which was derived from the UiO-66 supported calcium acetate. Torad et al.42 obtained Co-based carbon materials by pyrolytic carbonization of ZIF-67 at 800 °C under nitrogen atmosphere. Zhang et al.43 used MIL-125-(Ti) as a precursor and furfuryl alcohol was added in preparation of nano-TiO2@C composite catalysts under argon atmosphere.
Since UiO-66 is a MOF with good hydrothermal stability and chemical stability,44–48 and it shows quite high selectivity to 1-butene (97–99%).49 However, the yield of 1-butene is still low (i.e., 10%) because of the saturated coordination Zr cites. Moreover, as for the acid-treated UiO-66, the Lewis acidity of the catalyst is still weak.50,51
The aim of this paper is to develop a high-activity and high-selectivity catalyst through calcination of UiO-66(Zr) at various temperatures. In Section 2, the preparation, characterization, and evaluation of the UiO-66(Zr) derived ZrO2@C catalysts are presented. In Section 3, the effects of the carbonization temperature on the performances of the catalysts are discussed. In Section 4, conclusions on the ZrO2@C catalyst are drawn.
2 Experimental
2.1 Raw materials
Zirconium tetrachloride and terephthalic acid are analytically pure, purchased from Shanghai Aladdin Biochemical Technology Co., Ltd. N,N-dimethylformamide, hydrochloric acid and acetic acid are analytically pure, purchased from Sinopharm Group Chemical Reagents Co., Ltd 2-Butene is purchased from Dalian Special Gases Co., Ltd The mass percentage of 2-butene is: cis-2-butene 97.28%, trans-2-butene 2.48%, 1-butene 0.06%, isobutene 0.18%.2.2 Catalyst preparation
2.3 Catalyst characterization and evaluation
X-ray diffraction measurements (XRD) of solid samples are carried out on a SmartLab 6000 X-ray diffractometer by using Cu Kα radiation (α = 0.15418 nm) from 10.0° to 80.0°.JSM-7900F field emission – scanning electron microscopy (FE-SEM) and FEI Joel F200 transmission election microscopy (TEM) are employed to observe the micro morphology of catalyst samples.
N2 adsorption–desorption isotherms are tested on a Micromeritics ASAP 2020 gas-sorption apparatus at −196 °C. The specific surface area is determined with the BET model.
X-ray photoelectron spectroscopy (XPS) of the samples is carried out on a Thermo Fisher ESCALAB Xi+ apparatus.
NH3-TPD adsorption/desorption investigations are carried out by AutoChem II 2920 adsorption instrument equipped with a thermal conductivity detector (TCD). The strength of acid sites is analyzed from the position temperature of TPD signals.
Thermal gravimetric (TG) analysis in air is performed by using NETZSCH STA 449 F5 to determine the amount of carbon in the prepared catalysts. The air flowrate is 50 ml min−1. The heating rate is 10 °C min−1.
Elements analyse is performed by using an Agilent 5100 ICP spectrometer. The RF Power is 1150, plasma flow is 12 L min−1, sample uptake delay time is 12 s.
Pyridine IR (Py-IR) is carried out by Thermo Fisher Nicolet iS50. The heating rate is 10 °C min−1 up to the measured temperature (fixed point temperature of 250 °C and 350 °C respectively) for vacuum desorption for 0.5 h.
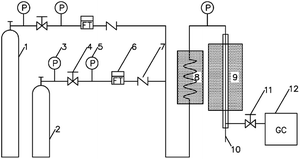
The performance of catalytic double bond isomerization of butene is evaluated in a fixed-bed setup as shown in Fig. 1.
The catalyst particle size is 40–60 mesh, the catalyst filling volume is 6 ml, and both ends of the reaction tube are filled with quartz sand. The feedstock feed flow rate is controlled by a mass flowmeter. The reaction pressure is normal pressure. The outlet of the reactor is filtered into the on-line Agilent GC8890 gas chromatography for real-time analysis. The detection conditions are as follows: six-way valve automatic injection, hydrogen flame detector (FID), HP PLOT/Al2O3 column (50 m × 0.53 mm × 15 μm), carrier gas N2, column oven temperature 100 °C, quantification by area normalization method.
3 Results and discussion
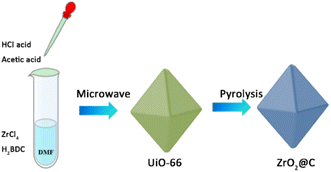
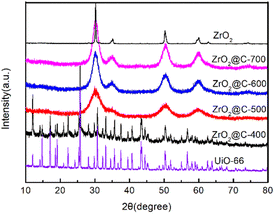
As shown in Scheme 1, the UiO-66 precursor is prepared by a modified microwave method, in which the acetic acid is added to adjust the structure. The obtained UiO-66 is further calcined at various temperature under N2 atmosphere and the corresponding product is denoted as ZrO2@C-X. The calcination temperature of ZrO2@C-X catalyst is investigated in detail. The results in Fig. 2 show that the sample calcined at 400 °C keeps the same diffraction peaks with UiO-66 precursor, indicating that the structure of UiO-66 is not decomposed, which happens at the temperature higher than 400 °C, such as 500, 600, 700 °C. It is observed that the ZrO2@C-500, ZrO2@C-600 and ZrO2@C-700 samples present the diffraction peaks of ZrO2(PDF#88-1007), in which 30.3°, 35.2°, 50.3°, 60.2° and 62.9° belong to the (101), (110), (112), (211) and (202) crystal face, respectively. Moreover, it is found that higher calcination temperature results in more acute diffraction peak, suggesting the formation of larger particles, which are confirmed by SEM characterization. As shown in Fig. 3, the samples calcined at various temperature exhibit the same structure of UiO-66, and the size of ZrO2@C-X crystal is 100–200 nm (Fig. 3a–d) while UiO-66 is about 500 nm (Fig. 3e), consistent with XRD results. In Z. Hasan's work,40 the optimal calcination temperature is 900 °C at which will cause the structure of UiO-66 decomposed. In this work, the highest calcination temperature is 700 °C. | ||
| Fig. 3 SEM images of ZrO2@C-X catalysts: (a). ZrO2@C-400, (b). ZrO2@C-500, (c). ZrO2@C-600, (d). ZrO2@C-700, (e). UiO-66. | ||
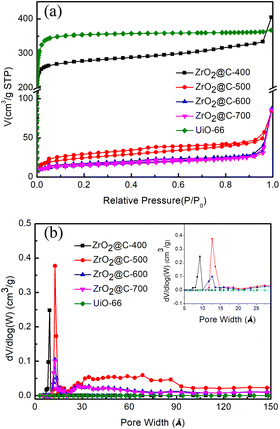
The pore structures of various ZrO2@C-X catalysts are analyzed by N2 adsorption–desorption experiments. The results in Fig. 4a display that ZrO2@C-400 catalyst mainly possesses the microporous structure as that in UiO-66 precursor and high surface area of 809.0 m2 g−1, agreement with XRD results. When the samples are calcined at higher temperature (i.e., 500, 600, 700 °C), the adsorption–desorption isotherms curves belong to type IV, with obvious H3 hysteresis loop and no obvious saturated adsorption capacity, indicating that the material has mesoporous structure.54,55 As the calcination temperature increases, the microporous structure decreases and the mesoporous structure emerges, which is due to the decomposition of more organic ligands. Meanwhile, the surface area sharply decreases under 100 m2 g−1, which is 84.3, 50.6, 48.9 m2 g−1 for ZrO2@C-500, ZrO2@C-600 and ZrO2@C-700 (Table 1), respectively. Among above catalysts, ZrO2@C-500 sample owns the highest surface area and broader pore size distribution (Fig. 4b), which favours the improvement of catalytic performance.
| Catalyst | SBET (m2 g−1) | Vmicro (cm3 g−1) | Vtotal (cm3 g−1) |
|---|---|---|---|
| ZrO2@C-400 | 809.0 | 0.356 | 0.493 |
| ZrO2@C-500 | 84.3 | 0.009 | 0.074 |
| ZrO2@C-600 | 50.6 | 0.007 | 0.044 |
| ZrO2@C-700 | 48.9 | 0.006 | 0.041 |
| UiO-66 | 1070.4 | 0.512 | 0.559 |
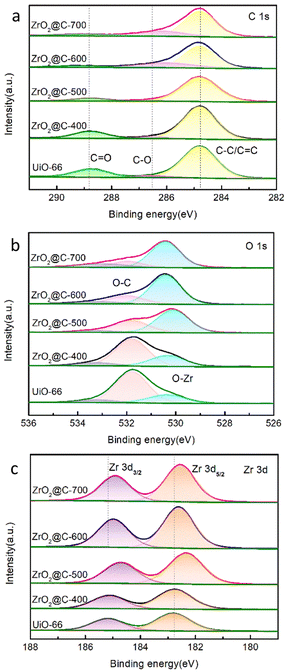
ZrO2@C-500 is further studied by X-ray photoelectron spectroscopy (XPS) analysis. As shown in Fig. 5, the XPS results exhibit the peaks corresponding to C 1s, O 1s and Zr 3d. C 1s peak fitting results show three peaks at 288.8, 286.7 and 284.8 eV corresponding to C![[double bond, length as m-dash]](https://www.rsc.org/images/entities/char_e001.gif) O, C–O and C–C/C
O, C–O and C–C/C![[double bond, length as m-dash]](https://www.rsc.org/images/entities/char_e001.gif) C, respectively. O 1s peaks also display three bands at 533.3, 531.8 and 530.1 eV for oxygen of O
C, respectively. O 1s peaks also display three bands at 533.3, 531.8 and 530.1 eV for oxygen of O![[double bond, length as m-dash]](https://www.rsc.org/images/entities/char_e001.gif) C,O–C and O–Zr, respectively. The Zr 3d peaks show two peaks at 182.4 eV (Zr–O) and 184.7 eV referring to Zr 3d3/2.56 XPS analysis verifies the element component of ZrO2@C catalyst. With the increase of calcination temperature, the content of C–C/C
C,O–C and O–Zr, respectively. The Zr 3d peaks show two peaks at 182.4 eV (Zr–O) and 184.7 eV referring to Zr 3d3/2.56 XPS analysis verifies the element component of ZrO2@C catalyst. With the increase of calcination temperature, the content of C–C/C![[double bond, length as m-dash]](https://www.rsc.org/images/entities/char_e001.gif) C and C
C and C![[double bond, length as m-dash]](https://www.rsc.org/images/entities/char_e001.gif) O, especially the content of C
O, especially the content of C![[double bond, length as m-dash]](https://www.rsc.org/images/entities/char_e001.gif) O bond decreases as shown in the C 1s spectrum (Fig. 5a)., the content of C–O bond decreases while the content of O–Zr bond increases significantly shown in the O 1s spectrum (Fig. 5b), Zr 3d3/2 and Zr 3d5/2 has the same increasable tendency shown in the Zr 3d spectrum (Fig. 5c). These appearances are attributed to the pyrolysis and carbonization of organic ligands in UiO-66 at the specified calcination temperature.
O bond decreases as shown in the C 1s spectrum (Fig. 5a)., the content of C–O bond decreases while the content of O–Zr bond increases significantly shown in the O 1s spectrum (Fig. 5b), Zr 3d3/2 and Zr 3d5/2 has the same increasable tendency shown in the Zr 3d spectrum (Fig. 5c). These appearances are attributed to the pyrolysis and carbonization of organic ligands in UiO-66 at the specified calcination temperature.
The morphology of ZrO2@C-500 catalyst is further analyzed by HRTEM characterization. As shown in Fig. 6, the sample still contains the octahedral structure and presents abundant white spots, which is attributed to the porous structure. In addition, the crystal lattice of 0.29 nm is clearly observed in the catalyst, which is corresponding to the (101) face in ZrO2, consistent with XRD results. Moreover, the images show that ZrO2 nanoparticles are embedded in the carbon support. Uniform distribution of element Zr over C can be observed in Fig. 6d and e. Therefore, combining with XPS results, the obtained materials can be denoted as ZrO2@C structure.57
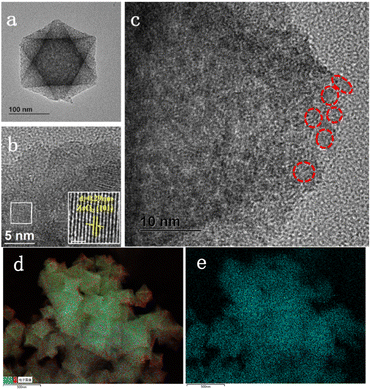 | ||
| Fig. 6 HRTEM images of ZrO2@C-500 catalyst at different scale bar ((a)100 nm; (b) 5 nm; (c) 10 nm; (d and e) total element distribution; (f) Zr distribution). | ||
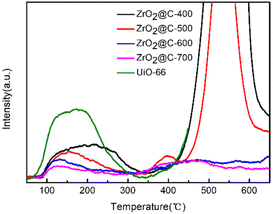
As for the isomerization reaction, the acid sites play an important role in the catalytic performance. So, the acidic property of ZrO2@C-X catalysts are studied by NH3-TPD experiments. The results in Fig. 7 show that the catalysts calcined at different temperature have diverse acidic sites. In general, the acidic sites are divided into weak, medium and strong acidic sites corresponding to the NH3 desorption temperature at the range of ≤200 °C, 200–350 °C, ≥350 °C, respectively. The ZrO2@C-400 catalyst exhibiting different NH3 desorption profiles results from the decomposition of organic ligand. For other calcined catalysts, the higher calcined temperature decreases the content of weak acid species, where ZrO2@C-500 catalyst owns the highest amount of weak acid sites. Meanwhile, ZrO2@C-500 catalyst exists obvious medium strong acidic species at around 400 °C. And the NH3 desorption curve at higher than 450 °C is due to the pyrolyzation of residual organic ligand. For ZrO2@C-600 and ZrO2@C-700 catalysts, they present more strong acidic species at temperature higher than 450 °C, which is attributed to the decrease content of encapsulated carbon.
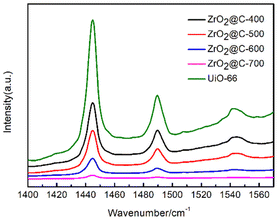
According to the results of pyridine infrared (Fig. 8), the prepared ZrO2@C catalysts retain a large number of UiO-66 organic ligands (terephthalic acid) when the calcination temperature is below 400 °C, resulting in a total acid content higher than that of the catalyst calcined at 500 °C or above. For the Zr@C-500, Zr@C-600 and Zr@C-700 catalysts, it is inferred that the B acid plays a major role in the reaction due to its high total acid content and high B/L in Zr@C-500. Both organic (such as C–O or C–C, etc.) and inorganic (such as Pd or Zr, etc.) sites can be the activity sites,22–25 just as the ZrO2@C catalysts in this work.
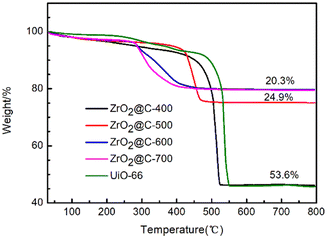
This phenomenon is further confirmed by TG analysis in Fig. 9. The ZrO2@C-400 catalyst exhibits 53.6% weight loss due to the decomposition of unpyrolyzed ligand. The weight loss remarkably descends to 24.9% and 20.3% for ZrO2@C-500 and ZrO2@C-600 catalysts. Therefore, ZrO2@C-500 catalyst possesses more carbon content than that in ZrO2@C-600 and ZrO2@C-700 samples, which cover more strong acidic species by the encapsulated structure.
The contents of element Zr in ZrO2@C-catalysts are determined by ICP as shown in Table 2. The contents of zirconium element increase with the increase of calcination temperature, indicating that more organic ligands are burned off as the calcination temperature increases.
| Catalyst | Content of Zr in catalyst, wt% |
|---|---|
| ZrO2@C-400 | 18.01 |
| ZrO2@C-500 | 20.67 |
| ZrO2@C-600 | 27.65 |
| ZrO2@C-700 | 34.70 |
| UiO-66 | 37.52 |
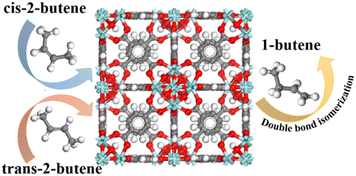
The catalytic performance of resultant catalysts was performed in the isomerization of 2-butene to 1-butene under the reaction conditions of 390 °C and 48 h−1, which was optimized in our previous work with a similar MOF-derived catalyst.49 Both cis-2-butene and trans-2-butene might be converted to 1-butene as shown in Scheme 2. The yield of reference catalyst UiO-66 was declined 2% in 300 minutes, while conversion and selectivity on the ZrO2@C catalysts had no obvious change in the equally reaction time. All the catalysts performance reaction time were 300 minutes referenced to UiO-66. As shown in Fig. 10a, the conversion of 2-butene increases along with the calcination temperature, which might be due to the exposure of more strong acidic sites on the catalysts, as verified by the NH3-TPD results. However, the selectivity of 1-butene appears volcanic shape, in which ZrO2@C-500 catalyst shows the best selectivity, achieving 94.0% conversion and 35.1% yield of 1-butene, better than the yield of 18–20% in the reported literature [8–14], which is ascribed to the exposure of suitable acidic species by encapsulated carbon and relatively high surface area. Moreover, the product distribution demonstrates that the stronger acidic sites in ZrO2@C-600 and ZrO2@C-700 catalysts lead to the cracking of 2-butene to the by-product of C3 component (Table 3), which further explains the high selectivity of ZrO2@C-500 catalyst. In addition, ZrO2@C-500 catalyst also displays good stability in the 300 min test (Fig. 10b), coming from the unique structure of ZrO2@C.
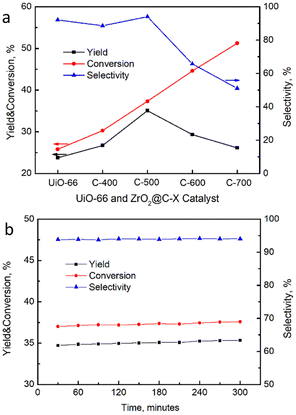 | ||
| Fig. 10 (a) Catalytic performance of ZrO2@C-X catalysts for the isomerization of 2-butene, (b) stability test result of ZrO2@C-500. | ||
| Product | ZrO2@C-400 | ZrO2@C-500 | ZrO2@C-600 | ZrO2@C-700 | UiO-66 |
|---|---|---|---|---|---|
| <C3 | 3.55 | 2.10 | 32.46 | 47.63 | 2.23 |
| Isobutene | 0.76 | 0.11 | 0.35 | 0.38 | 0.12 |
| >C5 | 7.12 | 3.76 | 1.48 | 0.96 | 5.53 |
| 1-Butene | 88.57 | 94.03 | 65.71 | 51.03 | 92.12 |
4 Conclusions
The ZrO2@C-X catalysts are fabricated from the UiO-66(Zr) precursor which are calcinated at various temperature under N2 atmosphere. The catalysts with carbon encapsulated ZrO2 particles are characterized or evaluated using combined techniques, including XRD, SEM, TEM, XPS, FT-IR, TG, ICP, Py-IR and a fixed-bed reactor. Experimental findings indicate that the ZrO2@C-X catalysts exhibit different catalytic performance while it is calcined at various temperatures. The catalyst ZrO2@C-500 shows the best catalytic performance for the isomerization of 2-butene to 1-butene, namely, 94.0% conversion of 2-butene and 35.1% yield of 1-butene. The reason can be ascribed to the suitable acidic sites and high surface area in ZrO2@C-500 which are beneficial for the isomerization reaction. In sum, this work provides a novel strategy to design high-activity acidic catalyst for the isomerization of 2-butene to 1-butene. The approach is expected to be applied to the synthesis of other acid catalysts.Conflicts of interest
There are no conflicts to declare.Acknowledgements
The authors acknowledge the Key Research and Development Plan of Shandong Province (Major Scientific and Technological Innovation Project) (2021ZDSYS24).Notes and references
- N. Sood, M. K. Jha and S. Bajpai, SPE Polym., 2021, 2, 325–335 CrossRef CAS.
- B. R. Barnett, S. T. Parker, M. V. Paley, M. I. Gonzalez, N. Biggins, J. Oktawiec and J. R. Long, J. Am. Chem. Soc., 2019, 141, 18325–18333 CrossRef CAS.
- X. Qiu, C. Hu, J. Li, D. Huang and S. Jiang, CrystEngComm, 2019, 21, 4243–4249 RSC.
- J. G. Cai, Sci. Discovery, 2016, 4, 137–141 CrossRef.
- W. C. White, Chem.-Biol. Interact., 2007, 166, 10–14 CrossRef CAS PubMed.
- D. Z. Gao, Y. Hu, D. L. Kong and J. S. Jin, Contemp. Chem. Ind., 2004, 33, 129–133 CAS.
- E. Sánchez-Ramírez, H. Alcocer-García, A. G. Romero-García, G. Contreras-Zarazua and J. G. Segovia-Hernandez, in 31st European Symposium on Computer Aided Process Engineering, 2021, pp. 399–405, DOI:10.1016/b978-0-323-88506-5.50063-2.
- Y. Hu, C. Xu, H. Zhang, Y. Wang, J. Deng and H. Zhang, ChemistrySelect, 2017, 2, 3408–3413 CrossRef CAS.
- E. Mazoyer, K. C. Szeto, J. M. Basset, C. P. Nicholas and M. Taoufik, Chem. Commun., 2012, 48, 3611–3613 RSC.
- M. D. Commereuc, F. B. Didillon, R. H. Olivier-Bourbigou and L. S. C. s. Seine, Production of High Purity Isobutene and Propylene from Hydrocarbon Fractions with Four Carbon Atoms, US Pat., Institut Francais du Petrole, Rueil-Malmaison (FR), 6686510B2, 2004 Search PubMed.
- P. M. Dorbon, V. F. Hugues, V. J.-C. Viltard, R. B. Didillon, A. F. Vernaison, Process for Obtaining Butene-1, US Pat., Institut Francais du Petrole, Rueil-Malmaison (FR), 6242662, 2001 Search PubMed.
- O. Forlani, F. Ancilltti, B. Jover, G. Resofszki and G. Gati, Appl. Catal., 1991, 67, 237–247 CrossRef CAS.
- R. J. Gartside, M. I. Greene and H. Kaleem, Hydrocarbon Process., 2006, 85, 57–61 CAS.
- C. L. Wu, Coal Chem. Ind., 2021, 44, 129–131 Search PubMed.
- L. Li, Z. Y. Zhu and J. T. Liu, Chem. React. Eng. Technol., 2014, 30, 342–346 CAS.
- J.-K. Jeon, H. Lee, J.-H. Yim, Y. S. Kim, S. J. Lee, Y.-K. Park, J. K. Shon and J. M. Kim, Catal. Lett., 2007, 119, 179–184 CrossRef CAS.
- N. You, J. H. Yim, S. J. Lee, J. H. Lee, Y. K. Park and J. K. Jeon, J. Nanosci. Nanotechnol., 2007, 7, 3800–3804 CrossRef CAS.
- Y.-K. Park, S. J. Kim, N. You, J. Cho, S. J. Lee, J. H. Lee and J.-K. Jeon, J. Ind. Eng. Chem., 2011, 17, 186–190 CrossRef CAS.
- P. M. Słomkiewicz, Appl. Catal., A, 2006, 301, 232–240 CrossRef.
- A. Moronta, J. Luengo, Y. Ramírez, J. Quiñónez, E. González and J. Sánchez, Appl. Clay Sci., 2005, 29, 117–123 CrossRef CAS.
- P. M. Slomkiewicz, React. Funct. Polym., 1997, 33, 299–304 CrossRef CAS.
- Y. Jing, Y. Wang, S. Furukawa, J. Xia, C. Sun, M. J. Hulsey, H. Wang, Y. Guo, X. Liu and N. Yan, Angew. Chem., Int. Ed. Engl., 2021, 60, 5527–5535 CrossRef CAS PubMed.
- S. Ding, Y. Guo, M. J. Hülsey, B. Zhang, H. Asakura, L. Liu, Y. Han, M. Gao, J.-y. Hasegawa, B. Qiao, T. Zhang and N. Yan, Chem, 2019, 5, 3207–3219 CAS.
- K. Wang, W. Cui, Z. Bian, Y. Liu, S. Jiang, Y. Zhou and J. Wang, Appl. Catal., B, 2021, 281 Search PubMed.
- Q. Wang, X. Ling, T. Ye, Y. Zhou and J. Wang, J. Mater. Chem. A, 2019, 7, 19140–19151 RSC.
- B. Kolbe and S. Wenzel, Chem. Eng. Process., 2004, 43, 339–346 CrossRef CAS.
- R. M. Aldossary, R. M. N. Shaik, R. K. A. Al-Majnouni, R. A. Alzenaidi, D. F. Rahman, D. A. Palani, Y. S. Asaoka, D. M. A. Al Yami, D. U. Baduruthamal, Separation of Olefin Components from a Mixture of Butanes and Butenes Using Distillation and Adsorbents, US Pat., Sabic Global Technologies B.V, Bergen op Zoom (NL), 2022 Search PubMed.
- B. Tijsebaert, C. Varszegi, H. Gies, F. S. Xiao, X. Bao, T. Tatsumi, U. Muller and D. De Vos, Chem. Commun., 2008, 2480–2482 RSC.
- Y. He, W. Zhou, R. Krishna and B. Chen, Chem. Commun., 2012, 48, 11813–11831 RSC.
- S. A. Ivko, T. Bailey, L. Brammer and A. Haynes, Chem. Commun., 2022, 58, 11252–11255 RSC.
- M. D. Satoshi Horike, K. Tamaki and J. R. Long, J. Am. Chem. Soc., 2008, 130, 5854–5855 CrossRef PubMed.
- Z. U. Zango, N. S. Sambudi, K. Jumbri, N. H. H. Abu Bakar, N. A. F. Abdullah, E.-S. M. Negim and B. Saad, Chem. Eng. Sci., 2020, 220 Search PubMed.
- M. Mukoyoshi and H. Kitagawa, Chem. Commun., 2022, 58, 10757–10767 RSC.
- B. Li, K. Leng, Y. Zhang, J. J. Dynes, J. Wang, Y. Hu, D. Ma, Z. Shi, L. Zhu, D. Zhang, Y. Sun, M. Chrzanowski and S. Ma, J. Am. Chem. Soc., 2015, 137, 4243–4248 CrossRef CAS PubMed.
- J. Chen, R. Liu, Y. Guo, L. Chen and H. Gao, ACS Catal., 2014, 5, 722–733 CrossRef.
- R. A. Perlata, M. T. Huxley, Z. Shi, Y.-B. Zhang, C. J. Sumby and C. J. Doonan, Chem. Commun., 2020, 56, 15313–15316 RSC.
- N. F. H. Nik Zaiman, N. Shaari and N. A. M. Harun, Int. J. Energy Res., 2021, 46, 471–504 CrossRef.
- R. R. Salunkhe, Y. V. Kaneti, J. Kim, J. H. Kim and Y. Yamauchi, Acc. Chem. Res., 2016, 49, 2796–2806 CrossRef CAS PubMed.
- M. K. Alavijeh and M. M. Amini, Polyhedron, 2019, 173 Search PubMed.
- Z. Hasan, D. W. Cho, I. H. Nam, C. M. Chon and H. Song, Materials, 2016, 9, 1–14 Search PubMed.
- H. Li, Y. Wang, X. Ma, M. Guo, Y. Li, G. Li, P. Cui, S. Zhou and M. Yu, Renewable Energy, 2022, 185, 970–977 CrossRef CAS.
- N. L. Torad, M. Hu, S. Ishihara, H. Sukegawa, A. A. Belik, M. Imura, K. Ariga, Y. Sakka and Y. Yamauchi, Small, 2014, 10, 2096–2107 CrossRef CAS PubMed.
- X. Zhang, Y. Liu, Y. Pang, M. Gao and H. Pan, J. Mater. Chem. A, 2014, 2, 1847–1854 RSC.
- P. Ponchai, K. Adpakpang, S. Thongratkaew, K. Chaipojjana, S. Wannapaiboon, S. Siwaipram, K. Faungnawakij and S. Bureekaew, Chem. Commun., 2020, 56, 8019–8022 RSC.
- A. A. Mohammadi, A. Alinejad, B. Kamarehie, S. Javan, A. Ghaderpoury, M. Ahmadpour and M. Ghaderpoori, Int. J. Environ. Sci. Technol., 2017, 14, 1959–1968 CrossRef CAS.
- Y. Wang, N. Zhang, D. Chen, D. Ma, G. Liu, X. Zou, Y. Chen, R. Shu, Q. Song and W. Lv, Sci. Total Environ., 2019, 682, 118–127 CrossRef CAS PubMed.
- G. C. Shearer, S. Chavan, S. Bordiga, S. Svelle, U. Olsbye and K. P. Lillerud, Chem. Mater., 2016, 28, 3749–3761 CrossRef CAS.
- J. Winarta, B. Shan, S. M. McIntyre, L. Ye, C. Wang, J. Liu and B. Mu, Cryst. Growth Des., 2019, 20, 1347–1362 CrossRef.
- X. Wang, W. Liu, L. Tian, P. Li, X. Chen and W. Ren, Pet. Process. Petrochem., 2022, 53, 21–27 Search PubMed.
- M. Kandiah, M. H. Nilsen, S. Usseglio, S. Jakobsen, U. Olsbye, M. Tilset, C. Larabi, E. A. Quadrelli, F. Bonino and K. P. Lillerud, Chem. Mater., 2010, 22, 6632–6640 CrossRef CAS.
- M. Stojković and I. A. Pašti, Catalysts, 2021, 11, 264 CrossRef.
- M. J. Katz, Z. J. Brown, Y. J. Colon, P. W. Siu, K. A. Scheidt, R. Q. Snurr, J. T. Hupp and O. K. Farha, Chem. Commun., 2013, 49, 9449–9451 RSC.
- M. R. Destefano, T. Islamoglu, S. J. Garibay, J. T. Hupp and O. K. Farha, Chem. Mater., 2017, 29, 1357–1361 CrossRef CAS.
- Y. Tao, H. Kanoh., A. Lloyd and K. Kaneko, Chem. Rev., 2006, 896–910 CrossRef CAS PubMed.
- M. Athar, P. Rzepka, D. Thoeny, M. Ranocchiari and J. Anton van Bokhoven, RSC Adv., 2021, 11, 38849–38855 RSC.
- M. N. Goda, H. N. Abdelhamid and A. E. A. Said, ACS Appl. Mater. Interfaces, 2020, 12, 646–653 CrossRef CAS PubMed.
- J. Joo, T. Yu, Y. W. Kim, H. M. Park, F. Wu, J. Z. Zhang and T. Hyeon, J. Am. Chem. Soc., 2003, 125, 6553–6557 CrossRef CAS PubMed.
| This journal is © The Royal Society of Chemistry 2023 |

