 Open Access Article
Carbazole fluorophore with an imidazole/thiazole unit: contrasting stimuli-induced fluorescence switching, water-sensing and deep-blue emission†
Sasikala Ravia,
P. R. Nithiasria,
Subramanian Karthikeyanb,
Mehboobali Panniparacd,
Abdullah G. Al-Sehemicd,
Dohyun Moon *e and
Savarimuthu Philip Anthony
 *a
*a
aSchool of Chemical & Biotechnology, SASTRA Deemed University, Thanjavur 613401, Tamil Nadu, India. E-mail: philip@biotech.sastra.edu
bPG and Research Department of Chemistry, Khadir Mohideen College (Affiliated to Bharathidasan Univ.), Adirampattinam, Tamil Nadu, India
cResearch Center for Advanced Materials Science, King Khalid University, Abha 61413, Saudi Arabia
dDepartment of Chemistry, King Khalid University, Abha 61413, Saudi Arabia
eBeamline Department, Pohang Accelerator Laboratory, 80 Jigokro-127 Beongil, Nam-gu, Pohang, Gyeongbuk, South Korea. E-mail: dmoon@postech.ac.kr
First published on 21st April 2023
Abstract
Carbazole-based, π-conjugated donor–acceptor fluorophores were synthesized by integrating imidazole/thiazole units. Then, we investigated the impact of subtle structural changes on fluorescence properties. Carbazole integrated with imidazole (Cz-I) and carbazole integrated with thiazole (Cz-T) showed strong fluorescence in solution (quantum yield (Φf) = 0.18 (Cz-I) and 0.14 (Cz-T) compared with the standard quinine sulfate) and solid-state (Φf = 8.0% (Cz-I) and 14.6% (Cz-T)). Cz-I showed relatively more blue-shifted emission in solution compared with the solid-state (λmax = 417 nm (CH3CN) and 460 nm (solid)). Cz-T exhibited deep-blue emission in the solid-state compared with solution (λmax = 455 nm (CH3CN) and 418 nm (solid)). Interestingly, Cz-T exhibited a drastic change in fluorescence in organic solvents (CH3CN, THF, CH3OH, DMSO) with a low percentage (1%) of water. Cz-I showed reversible fluorescence switching between two fluorescence states upon exposure to trifluoracetic acid (TFA)/ammonia (NH3). In contrast, Cz-T displayed reversible/self-reversible off–on fluorescence switching upon exposure to TFA or NH3. Mechanofluorochromic studies of Cz-I showed a slight reduction in fluorescence intensity upon crushing and reversal to the initial state upon heating. Cz-T exhibited off–on reversible/self-reversible fluorescence switching upon crushing/heating. Computational studies indicated that thiazole integration improved the electron-withdrawing characteristics compared with imidazole and contributed to contrasting fluorescence responses. Thus, a simple change of nitrogen with sulfur produced contrasting self-assembly in the solid-state that led to different functional properties and stimuli-induced fluorescence switching.
Introduction
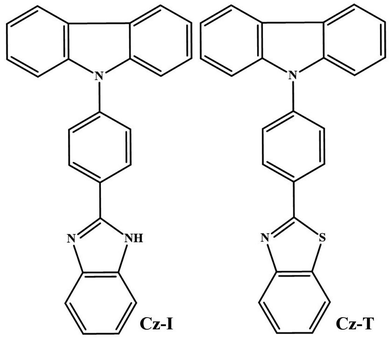
Organic molecules that emit fluorescence have been of great interest in recent decades because of their applications ranging from biological science to optoelectronic devices.1–5 The molecular structure of a fluorophore, in general, plays an important part in fluorescence properties in solution and the solid-state.6–9 For instance, planar polyaromatic molecules show strongly enhanced emission in solution and weak or no emission in the solid-state due to aggregation-induced quenching.10,11 In contrast, fluorophores with a non-planar twisted structure often exhibit aggregation-induced emission/aggregation-induced enhanced emission (AIE/AIEE) in the solid-state compared with in solution.12–14 Integrating a twisted non-planar group with a π-conjugated aromatic molecule has shown emission in solution as well as the solid-state.15–17 Weak intermolecular interactions coupled with loose molecular packing in a twisted fluorophore produce stimuli-responsive fluorescence switching.18–20 Stimuli-responsive fluorescence systems are potential materials for environmental/biosensing, information storage and anticounterfeiting.21–25 A subtle structural change in a fluorophore is often employed to improve fluorescence efficiency as well as to achieve tunable and switchable fluorescence.26–30 Control of molecular packing by substitution with an alkyl group can produce fluorescence gels, tunable solid-state fluorescence, room-temperature phosphorescence and different types of mechanofluorochromism.31–37 Donor–acceptor structural “tailoring” can result in wide fluorescence tuning with improved fluorescence efficiency.38–41 Halogen substitution with a fluorophore structure can significantly improve fluorescence efficiency and fluorescence switching by controlling the molecular organization.42–44 Incorporating an acid-responsive functional group with a fluorophore allows fabrication of pH-controlled fluorescence-switching platforms.45–47 Thus, exploring the role of structural change on the fluorescence properties of organic molecules is a highly active research field.The rigid, planar, aromatic heterocyclic imidazole unit has been used as a building block for developing efficient fluorescence molecules with improved thermal stability and material attributes.48–52 Herein, we synthesized a carbazole donor integrated with an imidazole (Cz-I) acceptor and thiazole (Cz-T) acceptor (Scheme 1) and explored the imidazole/thiazole effect on fluorescence properties. Cz-I and Cz-T showed emission in solution (Φf = 0.18 (Cz-I) 0.14 (Cz-T) compared with a standard of quinine sulfate) and solid-state (8.0% (Cz-I) and 14.6% (Cz-T)). Interestingly, Cz-T showed deep-blue emission in the solid-state whereas Cz-I exhibited cyan emission. AIE studies of Cz-I and Cz-T revealed contrasting fluorescence changes upon aggregation from solution. Furthermore, Cz-T exhibited self-reversible mechanofluorochromism and halochromism compared with Cz-I. Hence, simple structural change by N/S produced contrasting fluorescence switching and fluorescence tuning.
Experimental
Carbazole, 4-bromobenzaldehyde, 18-crown-6, copper iodide, potassium carbonate, 2-aminothiophenol, o-phenylenediamine and solvents were procured from MilliporeSigma or Merck India, and used without further purification.Synthesis of 4-(9H-carbazol-9-yl)benzaldehyde (Scheme S1†)
4-(9H-carbazol-9-yl)benzaldehyde was synthesized by a C–N coupling reaction between carbazole (1.8 g, 1 mmol) and 4-bromobenzaldhyde (2.38 g, 1.2 mmol) in the presence of K2CO3 (4.52 g, 3 mmol), CuI (0.26, 0.13 mmol) and 18-Crown-6 (0.08 g, 0.03 mmol) in o-dichlorobenzene (8 ml) at 180 °C for 24 h. The resultant mixture was extracted, concentrated, and purified by column chromatography to proffer a yield of 1.46 g (47%).Synthesis of 9-(4-(1H-benzo[d]imidazol-2-yl)phenyl)-9H-carbazole (Cz-I)
The aldehyde (0.5 g, 1 mmol) and o-phenylenediamine (0.08 g, 1 mmol) were mixed in acetic acid (2 ml) and refluxed for 5 h. After completion of the reaction, the reaction mixture was cooled and poured into cold water. The obtained precipitate was washed five-times with cold water, dried, and purified using column chromatography (EtOAc![[thin space (1/6-em)]](https://www.rsc.org/images/entities/char_2009.gif) :
:![[thin space (1/6-em)]](https://www.rsc.org/images/entities/char_2009.gif) Hexane (15
Hexane (15![[thin space (1/6-em)]](https://www.rsc.org/images/entities/char_2009.gif) :
:![[thin space (1/6-em)]](https://www.rsc.org/images/entities/char_2009.gif) 85) to proffer a yield of 0.529 g (80%)).
85) to proffer a yield of 0.529 g (80%)).
Synthesis of 2-(4-(9H-carbazol-9-yl)phenyl)benzo[d]thiazole (Cz-T)
The aldehyde (0.5 g, 1 mmol) and 2-aminothiophenol (0.08 g, 1 mmol) were dissolved in DMSO and refluxed at 120 °C for 8 h. After completion of the reaction, the reaction mixture was cooled and poured into cold water. The obtained precipitate was purified using column chromatography (EtOAc![[thin space (1/6-em)]](https://www.rsc.org/images/entities/char_2009.gif) :
:![[thin space (1/6-em)]](https://www.rsc.org/images/entities/char_2009.gif) Hexane (10
Hexane (10![[thin space (1/6-em)]](https://www.rsc.org/images/entities/char_2009.gif) :
:![[thin space (1/6-em)]](https://www.rsc.org/images/entities/char_2009.gif) 90)) to proffer a yield of 0.521 g (75%).
90)) to proffer a yield of 0.521 g (75%).
Characterization
Nuclear magnetic resonance (NMR) spectroscopy was done on a 600 MHz system from JEOL. Fluorescence spectra and the absolute quantum yield for all compounds in the solid-state were recorded using a fluorescence spectrometer (FP-8300; Jasco) equipped with an integrating sphere and calibrated light source. Absorption spectroscopy was done on a UV-visible spectrophotometer (V-730ST; Jasco). A triple quadrupole mass spectrometer (6475 series; Agilent Technologies) was used to obtain mass. Powder X-ray diffraction (PXRD) patterns were measured using a X-ray diffractometer (D8 Advance; Bruker) with Cu Kα radiation (λ = 1.54050 Å) at room temperature. Single crystals were coated with paratone-N oil and diffraction data measured with synchrotron radiation (λ = 0.62998 Å) on a ADSC Quantum-210 detector at 2D SMC with a silicon (111) double-crystal monochromator at the Pohang Accelerator Laboratory, Korea. The highest occupied molecular orbital (HOMO), lowest occupied molecular orbital (LUMO) and bandgap of all structures were studied using B3PW91/6-31 + G(d,p) level theory (Gaussian 09 package).Results and discussion
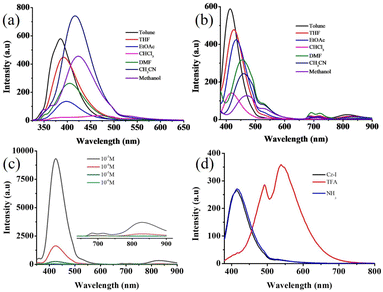
Cz-I and Cz-T were synthesized as shown in Scheme 1. The absorption spectra of Cz-I and Cz-T showed an intramolecular charge transfer (ICT) band between 330 nm and 340 nm (Fig. S1†). Furthermore, the solvent polarity did not show a significant effect on absorption, thereby indicating the non-polar ground state of both molecules. In contrast, both molecules exhibited solvent polarity-dependent fluorescence tuning between 384 nm and 424 nm for Cz-I and between 413 nm and 470 nm for Cz-T (Fig. 1 and Table 1). Cz-I in CHCl3 showed weak broad fluorescence between 375 nm and 480 nm (Fig. 1a). Furthermore, Cz-I showed strong fluorescence in non-polar and polar aprotic solvents, whereas Cz-T exhibited strong fluorescence in non-polar solvents and weak fluorescence in polar solvents. Cz-I showed relatively blue-shifted fluorescence compared with Cz-T, which showed gradual red-shifting of fluorescence upon increasing the solvent polarity. These fluorescence changes across changes in solvent polarity indicated that sulfur in thiazole groups increased their electron-withdrawing character and produced ICT from the carbazole donor to the thiazole acceptor. However, nitrogen in an imidazole compound might interfere with the ICT from carbazole to imidazole due to the electron-donating characteristics of nitrogen. Computational studies (see below) also suggested a ICT in Cz-T compared with Cz-I. Interestingly, Cz-T showed weak excimeric emissions at longer wavelengths (between 680 nm and 715 nm as well as 829 nm) (Fig. 1b). Concentration-dependent studies of Cz-T in EtOAc clearly exhibited an increase in excimer emission intensity at higher concentrations (Fig. 1c). In contrast, Cz-I did not show any excimeric emission.| Solvent | Cz-I | Cz-T | ||
|---|---|---|---|---|
| λmax (nm) | Φf | λmax (nm) | Φf | |
| Toluene | 384 | 0.18 | 413 | 0.14 |
| THF | 391 | 0.11 | 431 | 0.13 |
| EtOAc | 397 | 0.04 | 436 | 0.08 |
| CHCl3 | 375–480 (weak broad) | — | 416 | 0.03 |
| DMF | 405 | 0.08 | 457 | 0.09 |
| CH3CN | 417 | 0.17 | 455 | 0.05 |
| MeOH | 424 | 0.09 | 470 | 0.03 |
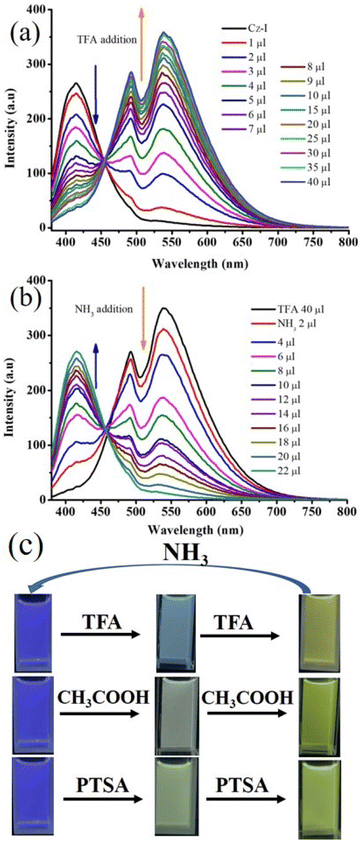
The presence of nitrogen in Cz-I and Cz-T along with good fluorescence was expected to show a response towards pH. Cz-I showed red-shifting of fluorescence from 417 nm to 538 nm upon addition of trifluoroacetic acid (TFA) in CH3CN (Fig. 1d). Ammonia addition exhibited perfect reversibility of emission to the initial state. A slow increase in the TFA concentration showed a gradual decrease of emission at 417 nm and emergence of a new peak at 538 nm (Fig. 2a). Similarly, an increase in the ammonia concentration led to a gradual decrease of longer-wavelength emission at 538 nm and reappearance of shorter-wavelength emission at 417 nm (Fig. 2b). TFA addition and ammonia addition showed an isosbestic point, and suggested a dynamic equilibrium between the protonated species and non-protonated species in the solution. Along with strong emission at 538 nm in an acidic medium, a “hump” was noted at 490 nm. Thus, Cz-I showed reversible fluorescence switching between two emissive states upon addition of TFA and ammonia. The gradual reduction of emission at 417 nm along with emergence of emission at 538 led to dual emission with an increasing TFA concentration. This phenomenon allowed control of dual emission by adjusting the acid concentration and produced white emission (Fig. 2c). Cz-I also exhibited fluorescence tuning as well as white emission upon addition of acetic acid and para-toluene sulphonic acid (Fig. 2c). In contrast, addition of TFA into a CH3CN solution of Cz-T showed complete quenching of fluorescence (Fig. S2†). Surprisingly, it did not show reversible “turn on” fluorescence upon ammonia addition, and remained in the quenched state.
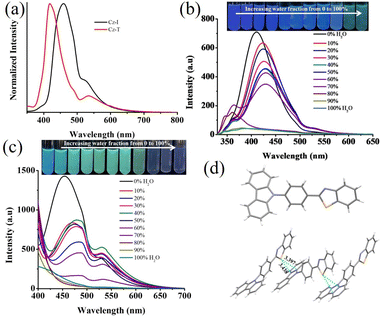
Cz-I and Cz-T showed strong solid-state fluorescence due to integration of a twisted N-phenyl carbazole unit with imidazole/thiazole (Fig. 3a). Cz-T showed deep-blue emission (λmax = 418 nm, Φf = 14.6%) whereas is Cz-I showed cyan emission (λmax = 460 nm, Φf = 8.0%). Interestingly, compared with the solution state, the emission peak was blue-shifted for Cz-T in the solid-state but red-shifted for Cz-I. AIE studies in a CH3CN–water mixture confirmed the opposite shift of fluorescence upon moving from solution to an aggregated state (Fig. 3b and c). Cz-I in CH3CN showed strong fluorescence at 417 nm. It showed a red-shift of the emission peak (λmax = 424 nm) in a 10% water–CH3CN mixture (Fig. 3b). Further increases in the water fraction showed only a slight red-shift with reduction of fluorescence intensity. However, the fluorescence intensity was strongly reduced with broad red-shifted emission at >80% water fraction. Cz-T exhibited strong fluorescence at 455 nm in CH3CN. An increase in the water fraction to 10% led to red-shift of emission to 470 nm with a drastic change in emission colour. Further increases in the water fraction (up to 60%) showed a reduction of fluorescence intensity. The emission peak at 455 nm disappeared completely at >70% water fraction and showed blue-shifted emission. The drastic change in Cz-T fluorescence with increasing water content in CH3CN suggested possible utility as a fluorescent water sensor in solvents. To confirm the water-sensing characteristics of Cz-T, water-miscible solvents (CH3CN, DMSO, DMF, THF) were chosen and we monitored the change in fluorescence with increasing water percentage from 1% upwards (Fig. S3†). Interestingly, all four solvents showed a fluorescence change upon addition of 1% water and also exhibited a linear change with increasing water percentage up to 10%.
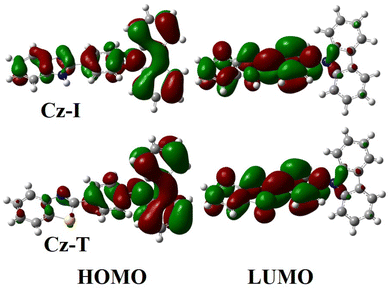
The opposite change in fluorescence from solution to an aggregated state indicated that both compounds might adopt different molecular arrangements in the solid-state. However, only Cz-T produced crystals of sufficient quality for structural analyses. The structural parameters of Cz-T matched perfectly with a structure reported previously.53 The thiazole group and phenyl group attached with thiazole adopted a coplanar conformation, but displayed a twisted conformation with a carbazole unit (Fig. 3d). The twisted molecular structure hindered the π⋯π stacking in the crystal lattice (Fig. S4†). The sulfur atom involved in the S⋯π interaction with the carbazole unit rigidified the molecule in the solid-state (Fig. 3d). The sulfur intermolecular interaction and opposite molecular arrangement might have contributed to deep-blue emission. To understand the electronic transition, computational studies were undertaken using the B3PW91/6-31G(d,p) level of theory for Cz-I and Cz-T. The structure of Cz-T was chosen from the single-crystal structure and used without structural optimization. However, a geometry-optimized structure was used for Cz-I because it did not produce single crystals. The (HOMO) of Cz-I indicated electron density in the whole structure, and movement from carbazole to phenyl-imidazole units in the LUMO (Fig. 4). In contrast, electron density was occupied mostly in the carbazole-phenyl unit in the HOMO and shifted to the phenyl-thiazole unit in the LUMO of Cz-T. Thus, Cz-T exhibited an electronic transition from a carbazole donor to a thiazole acceptor, and supported ICT (Fig. 4).
The good solid-state fluorescence with a twisted molecular structure along with acid-responsive nitrogen suggested the possibility of obtaining stimuli-responsive fluorescence switching. The crushing of Cz-I showed reduction of fluorescence intensity with slight blue-shifting of λmax (Fig. 5a). Fluorescence was reversed to the initial state by heating. In contrast, Cz-T exhibited complete reduction of fluorescence intensity by crushing (Fig. 5c). Fluorescence was reversed to the initial state by heating. Cz-T showed slight blue-shifted emission (404 nm) after heating that could be attributed to the crystal habits.48,54,55 Cz-T also exhibited self-reversible fluorescence switching from the crushing state without the need for heating (Fig. 6a). After 4 h, it showed significant enhancement of fluorescence intensity and self-reversed completely to the initial state in 24 h. Conversely, the fluorescence intensity of crushed Cz-I was reduced further with time without altering the peak position (Fig. 6b). After 24 h, it showed shifting of emission peak position to the initial state. Though the peak position of Cz-I self-reversed to the initial state, its intensity remained reduced without heating. TFA exposure to Cz-I solids led to an increase in fluorescence intensity with red-shifting of the emission peak from 460 nm to 483 nm (Fig. 5b). Fluorescence was reversed to the initial state by NH3 exposure. In contrast, fluorescence was reduced significantly with red-shifting of the peak position by TFA exposure to Cz-T (Fig. 5d). Fluorescence was reversed completely to the initial state by NH3 exposure. As observed in mechanofluorochromism, Cz-T also showed self-reversible fluorescence switching after TFA exposure with time (Fig. 6c), but Cz-I did not show self-reversibility. Thus, Cz-I exhibited fluorescence switching between two fluorescence states by TFA/NH3 exposure, but Cz-T exhibited off–on reversible/self-reversible fluorescence switching. Cz-T did not show reversible fluorescence switching by acid/base exposure in solution. In general, fluorescence tuning by crushing can be attributed to transformation of the crystalline phase to amorphous/partial amorphous state.56–61 The molecular planarization and close stacking caused reduction of fluorescence intensity. The conversion of the amorphous/partial amorphous phase to the crystalline state by heating induced reversible fluorescence switching. PXRD studies were performed to confirm the reversible phase transformation for Cz-I and Cz-T (Fig. 6d). Initial samples showed sharp diffraction peaks and indicated crystallinity before crushing. Crushed samples also showed sharp diffraction peaks even without heating because the compounds exhibited self-reversibility with time. The perfect matching of diffraction peaks before and after crushing/heating suggested an absence of chemical transformation upon crushing/heating. Thus, simple replacement of imidazole by thiazole in the donor–acceptor compound produced contrasting fluorescence properties that could be attributed to the electronic characteristics of the sulfur atom.
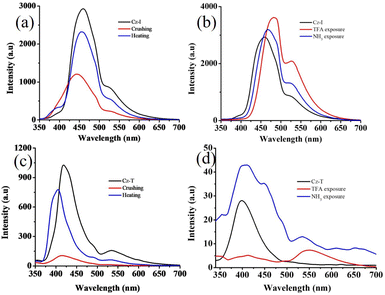 | ||
| Fig. 5 (a and c) Reversible fluorescence switching of (a and b) Cz-I and (c and d) Cz-T by (a and c) crushing/heating and (b and d) TFA/NH3 exposure. λexc = 320 nm. | ||
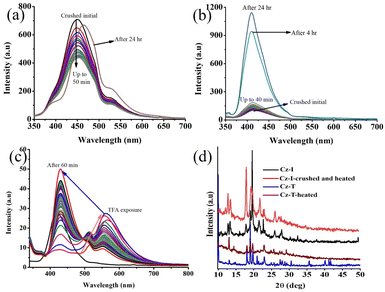 | ||
| Fig. 6 Self-reversible fluorescence switching of (a) Cz-I and (b and c) Cz-T by (a and b) crushing and (b) TFA exposure. (d) PXRD patterns of pristine and crushed samples. λexc = 320 nm. | ||
Conclusions
A carbazole π-conjugated fluorophore with imidazole/thiazole acceptor units was synthesized and demonstrated contrasting fluorescence properties by subtle structural changes. The fluorophore with imidazole (Cz-I) and thiazole (Cz-T) showed different fluorescence intensity in solution and the solid-state. Cz-I showed deep-blue emission (λmax = 417 nm) in solution whereas Cz-T exhibited red-shifted emission (λmax = 455 nm). In the aggregated state, Cz-I showed red-shifted emission (λmax = 460 nm) and Cz-T showed deep-blue emission (λmax = 418 nm). HOMO–LUMO theoretical calculation suggested ICT in Cz-T compared with Cz-I, and this could be attributed to the difference in electronic characteristics between N and S. Single-crystal analyses of Cz-T showed that S⋯π interactions facilitated opposite molecular arrangements in the crystal lattice and contributed to deep-blue emission in the solid-state. Interestingly, Cz-T exhibited reversible/self-reversible off–on fluorescence switching upon crushing/heating and exposure to TFA/NH3. Cz-I showed reversible fluorescence switching between two fluorescence states upon crushing/heating and TFA/NH3 exposure. Thus, a carbazole-imidazole fluorophore exhibited contrasting fluorescence switching and fluorescence tuning upon subtle structural changes.Conflicts of interest
There are no conflicts to declare.Acknowledgements
Financial support from the Science and Engineering Research Board (SERB), Core Research Grant (CRG/2020/003978) and DST-FIST (SR/FST/CS-1/2018/62), New Delhi, India, is acknowledged with gratitude. The Deanship of Scientific Research at King Khalid University (R.G.P.1/274/43) is greatly appreciated. Studies on X-ray crystallography were supported by Basic Science Research Program through the National Research Foundation of Korea funded by the Ministry of Education, Science and Technology (NRF-2021R1A2C1003080).References
- Z. Chi, X. Zhang, B. Xu, X. Zhou, C. Ma, Y. Zhang, S. Liu and J. Xu, Chem. Soc. Rev., 2012, 41, 3878 RSC.
- Y. Wang, Y. Liao, C. P. Cabry, D. Zhou, G. Xie, Z. Qu, D. W. Bruce and W. Zhu, J. Mater. Chem. C, 2017, 5, 3999–4008 RSC.
- J. Zhang, B. Xu, J. Chen, S. Ma, Y. Dong, L. Wang, B. Li, L. Ye and W. Tian, Adv. Mater., 2014, 26, 739–745 CrossRef PubMed.
- S. Suzuki, S. Sasaki, A. S. Sairi, R. Iwai, B. Z. Tang and G. Konishi, Angew. Chem. Int. Ed., 2020, 59, 9856–9867 CrossRef CAS PubMed.
- C. Wang, Y. Yu, Y. Yuan, C. Ren, Q. Liao, J. Wang, Z. Chai, Q. Li and Z. Li, Matter, 2020, 2, 181–193 CrossRef.
- S. P. Anthony, Chempluschem, 2012, 77, 518–531 CrossRef CAS.
- J. Gierschner, J. Shi, B. Milián-Medina, D. Roca-Sanjuán, S. Varghese and S. Park, Adv. Opt. Mater., 2021, 9, 2002251 CrossRef CAS.
- H.-Y. Fu, X.-J. Liu and M. Xia, RSC Adv., 2017, 7, 50720–50728 RSC.
- L. Huang, Y. Qiu, C. Wu, Z. Ma, Z. Shen and X. Jia, J. Mater. Chem. C, 2018, 6, 10250–10255 RSC.
- Z. Zhao, S. Chen, J. W. Y. Lam, Z. Wang, P. Lu, F. Mahtab, H. H. Y. Sung, I. D. Williams, Y. Ma, H. S. Kwok and B. Z. Tang, J. Mater. Chem., 2011, 21, 7210 RSC.
- A. C. Grimsdale, K. Leok Chan, R. E. Martin, P. G. Jokisz and A. B. Holmes, Chem. Rev., 2009, 109, 897–1091 CrossRef CAS PubMed.
- G. R. Suman, M. Pandey and A. S. J. Chakravarthy, Mater. Chem. Front., 2021, 5, 1541–1584 RSC.
- X. Lou and Y. Yang, Aggregate, 2020, 1, 19–30 CrossRef.
- D. Wang, M. M. S. Lee, W. Xu, G. Shan, X. Zheng, R. T. K. Kwok, J. W. Y. Lam, X. Hu and B. Z. Tang, Angew. Chem. Int. Ed., 2019, 58, 5628–5632 CrossRef CAS PubMed.
- J. L. Belmonte-Vázquez, Y. A. Amador-Sánchez, L. A. Rodríguez-Cortés and B. Rodríguez-Molina, Chem. Mater., 2021, 33, 7160–7184 CrossRef.
- F. Yu, H. Zhao, Y. Li, G. Xia and H. Wang, Mater. Chem. Front., 2022, 6, 155–162 RSC.
- A. Kundu, S. Karthikeyan, D. Moon and S. P. Anthony, J. Fluoresc., 2019, 29, 1359–1369 CrossRef CAS PubMed.
- C. Wang and Z. Li, Mater. Chem. Front., 2017, 1, 2174–2194 RSC.
- S. Ito, Chem. Lett., 2021, 50, 649–660 CrossRef CAS.
- Z. Yang, Z. Chi, Z. Mao, Y. Zhang, S. Liu, J. Zhao, M. P. Aldred and Z. Chi, Mater. Chem. Front., 2018, 2, 861–890 RSC.
- P. Gayathri, S. Ravi, P. Nantheeswaran, M. Mariappan, S. Karthikeyan, M. Pannipara, A. G. Al-Sehemi, D. Moon and S. P. Anthony, Mol. Syst. Des. Eng., 2022, 7, 1277–1286 RSC.
- P. S. Hariharan, E. M. Mothi, D. Moon and S. P. Anthony, ACS Appl. Mater. Interfaces, 2016, 8, 33034–33042 CrossRef CAS PubMed.
- Y. Ma, Y. Yu, J. Li, S. Liu, W. Huang and Q. Zhao, InfoMat, 2021, 3, 82–100 CrossRef CAS.
- H. Jia, Y. Teng, N. Li, D. Li, Y. Dong, D. Zhang, Z. Liu, D. Zhao, X. Guo, W. Di and W. Qin, ACS Mater. Lett., 2022, 4, 1306–1313 CrossRef CAS.
- Y. Zhuang, X. Ren, X. Che, S. Liu, W. Huang and Q. Zhao, Adv. photonics, 2021, 3, 014001 Search PubMed.
- F. Khan, M. Mahmoudi, D. Volyniuk, J. V. Grazulevicius and R. Misra, J. Phys. Chem. C, 2022, 126, 15573–15586 CrossRef CAS.
- Q. Li, S. Li, K. Wang, Y. Zhou, Z. Quan, Y. Meng, Y. Ma and B. Zou, J. Phys. Chem. C, 2017, 121, 1870–1875 CrossRef CAS.
- H.-Q. Peng, X. Zheng, T. Han, R. T. K. Kwok, J. W. Y. Lam, X. Huang and B. Z. Tang, J. Am. Chem. Soc., 2017, 139, 10150–10156 CrossRef CAS PubMed.
- M. Fang, J. Yang, Q. Liao, Y. Gong, Z. Xie, Z. Chi, Q. Peng, Q. Li and Z. Li, J. Mater. Chem. C, 2017, 5, 9879–9885 RSC.
- P. Gayathri, S. Karthikeyan, M. Pannipara, A. G. Al-Sehemi, D. Moon and S. P. Anthony, Cryst. Growth Des., 2022, 22, 5432–5440 CrossRef CAS.
- Y. Yu, Y. Fan, C. Wang, Y. Wei, Q. Liao, Q. Li and Z. Li, Mater. Chem. Front., 2021, 5, 817–824 RSC.
- P. S. Hariharan, D. Moon and S. P. Anthony, CrystEngComm, 2017, 19, 6489–6497 RSC.
- Q. Huang, X. Mei, Z. Xie, D. Wu, S. Yang, W. Gong, Z. Chi, Z. Lin and Q. Ling, J. Mater. Chem. C, 2019, 7, 2530–2534 RSC.
- W. Li, Q. Huang, Z. Mao, Q. Li, L. Jiang, Z. Xie, R. Xu, Z. Yang, J. Zhao, T. Yu, Y. Zhang, M. P. Aldred and Z. Chi, Angew. Chem. Int. Ed., 2018, 57, 12727–12732 CrossRef CAS PubMed.
- Y. Xie, Y. Ge, Q. Peng, C. Li, Q. Li and Z. Li, Adv. Mater., 2017, 29, 1606829 CrossRef PubMed.
- Y. Wen, H. Liu, S. Zhang, J. Cao, J. De and B. Yang, Adv. Opt. Mater., 2020, 8, 1901995 CrossRef CAS.
- P. S. Hariharan, P. Gayathri, D. Moon and S. P. Anthony, ChemistrySelect, 2017, 2, 7799–7807 CrossRef CAS.
- Y. Zuo, J. Liu, P. Li, K. Li, J. W. Y. Lam, D. Wu and B. Z. Tang, Cell Rep. Phys. Sci., 2023, 4, 101202 CrossRef CAS.
- P. Gayathri, S. B. Subramaniyan, A. Veerappan, M. Pannipara, A. G. Al-Sehemi, D. Moon and S. P. Anthony, Cryst. Growth Des., 2022, 22, 633–642 CrossRef CAS.
- P. S. Hariharan, V. K. Prasad, S. Nandi, A. Anoop, D. Moon and S. P. Anthony, Cryst. Growth Des., 2017, 17, 146–155 CrossRef CAS.
- P. S. Hariharan, G. Parthasarathy, A. Kundu, S. Karthikeyan, Y. Sagara, D. Moon and S. P. Anthony, Cryst. Growth Des., 2018, 18, 3971–3979 CrossRef CAS.
- H. Li, H. Shu, Y. Liu, X. Wu, H. Tian, H. Tong and L. Wang, Adv. Opt. Mater., 2019, 7, 1801719 CrossRef.
- Z. Zhou, Q. Liu, X. Chen, G. Xu, S. Wang, Y. Tu, J. Zhang, X. Zheng, J. Xiang, X. Feng, Y. Zhang, S. Xie, Z. Zeng and B. Z. Tang, Adv. Funct. Mater., 2021, 31, 2009024 CrossRef CAS.
- A. D’Aléo, A. Saul, C. Attaccalite and F. Fages, Mater. Chem. Front., 2019, 3, 86–92 RSC.
- P. Gayathri, M. Pannipara, A. G. Al-Sehemi, D. Moon and S. P. Anthony, Mater. Adv., 2021, 2, 996–1005 RSC.
- P. Gayathri, P. Nag, N. Anand, S. R. Vennapusa, M. Pannipara, A. G. Al-Sehemi, D. Moon and S. P. Anthony, New J. Chem., 2021, 45, 22450–22460 RSC.
- T. Sachdeva and M. D. Milton, Dyes Pigm., 2019, 164, 305–318 CrossRef CAS.
- H.-Y. Fu, X.-J. Liu, H. Zha, X.-X. Li, Y. Xu, F. Yang and M. Xia, Phys. Chem. Chem. Phys., 2019, 21, 1399–1407 RSC.
- J. Liu, J. Chen, Y. Dong, Y. Yu, S. Zhang, J. Wang, Q. Song, W. Li and C. Zhang, Mater. Chem. Front., 2020, 4, 1411–1420 RSC.
- S. Petdee, C. Chaiwai, W. Benchaphanthawee, P. Nalaoh, N. Kungwan, S. Namuangruk, T. Sudyoadsuk and V. Promarak, Dyes Pigm., 2021, 193, 109488 CrossRef CAS.
- W.-C. Chen, Y. Yuan, G.-F. Wu, H.-X. Wei, L. Tang, Q.-X. Tong, F.-L. Wong and C.-S. Lee, Adv. Opt. Mater., 2014, 2, 626–631 CrossRef CAS.
- J. Tagare, H. Ulla, M. N. Satyanarayan and S. Vaidyanathan, J. Lumin., 2018, 194, 600–609 CrossRef CAS.
- Y. Gong, CCDC 1952420: Experimental Crystal Struct. Determination, 2019, DOI:10.5517/ccdc.csd.cc23jn9m.
- L. Zou, S. Guo, H. Lv, F. Chen, L. Wei, Y. Gong, Y. Liu and C. Wei, Dyes Pigm., 2022, 198, 109958 CrossRef CAS.
- X. Zhang, Y. Liu, W. Wei, L. Gao, Y. Duan, H. Han and T. Han, Dyes Pigm., 2022, 197, 109916 CrossRef CAS.
- P. S. Hariharan, D. Moon and S. P. Anthony, J. Mater. Chem. C, 2015, 3, 8381–8388 RSC.
- P. Sudhakar and T. P. Radhakrishnan, J. Mater. Chem. C, 2019, 7, 7083–7089 RSC.
- A. Kundu, P. S. Hariharan, K. Prabakaran, D. Moon and S. P. Anthony, RSC Adv., 2015, 5, 98618–98625 RSC.
- Y. Zhan, Q. Wei, J. Zhao and X. Zhang, RSC Adv., 2017, 7, 48777–48784 RSC.
- F. Qi, J. Lin, X. Wang, P. Cui, H. Yan, S. Gong, C. Ma, Z. Liu and W. Huang, Dalton Trans., 2016, 45, 7278–7284 RSC.
- T. T. Divya, K. Ramshad, V. C. Saheer and L. Chakkumkumarath, New J. Chem., 2018, 42, 20227–20238 RSC.
Footnote |
| † Electronic supplementary information (ESI) available: NMR, absorption, and emission spectra, PXRD and crystallographic figure. See DOI: https://doi.org/10.1039/d3ra01897k |
| This journal is © The Royal Society of Chemistry 2023 |

