 Open Access Article
Activation of peroxymonosulfate by palygorskite supported Co–Fe for water treatment
Wenxiang Xiaa,
Qianqian Wua,
Rui Huangb,
Yinglu Taoa,
Kaimei Wanga,
Shuxiao Wua,
Songxue Wang *a,
Mingli Wangc and
Qingsheng Lid
aSchool of Environmental and Municipal Engineering, Qingdao University of Technology, Qingdao 266520, China. E-mail: songxue.wang@outlook.com
bGuangdong GDH Water Co. Ltd, Shenzhen 518021, China
cShandong Provincial Qingdao Eco-environment Monitoring Center, Qingdao 266003, China
dFujian Provincial Key Laboratory of Marine Ecological Conservation and Restoration, Xiamen 361005, China
First published on 21st April 2023
Abstract
In the present work, palygorskite (PAL) supported Co–Fe oxides (CoFe@PAL) were prepared and used as a peroxymonosulfate (PMS) activator for removal of rhodamine B (RhB) in water. The results showed that CoFe@PAL prepared at impregnation solution of 50 g L−1 and calcination temperature of 500 °C showed the best catalytic performance. The removal efficiency of RhB (10 mg L−1) by PMS (0.1 mmol L−1) activated with CoFe@PAL (1 g L−1) was above 98% within 60 min. The effects of various environmental factors including initial pH, humic acid (HA) and inorganic anions on the removal effect were simultaneously investigated. The radical quenching experiments and EPR characterization revealed that ˙OH, SO4˙−, O2˙− and 1O2 radicals existed in the CoFe@PAL/PMS system simultaneously. The intermediates during RhB degradation were analyzed by LC-MS and possible degradation pathways of RhB were proposed. Moreover, CoFe@PAL exhibited superior stability and reusability.
1. Introduction
Organic dye wastewater, which is extensively emitted by production processes in the textile, cosmetic, paint, and plastic industries, poses a threat to both the environment and human health due to its deep chromaticity, complex organic compositions, high chemical oxygen demand (COD) concentration and recalcitrance.1,2 Traditional water treatment processes, including adsorption3 and biological degradation,4 generally suffer from low efficiency of removal or degradation. Advanced oxidation processes (AOPs) based on the hydroxyl radical (˙OH) are efficient water treatment technologies for removing high organic loading wastewater.5,6 Compared with traditional ˙OH based AOPs, SO4˙− based AOPs exhibit higher redox potential, longer lifespan and wider pH range.7,8 Recently, peroxymonosulfate (PMS) activation, as a novel developing AOPs, has attracted increasing attention from researchers across the globe.Persulfates activation by transition metals is one of the most efficient methods with simple operation and low energy consumption.9,10 For example, homogeneous Co2+ is considered to be the most efficient PMS activator for transition metals.11,12 However, cobalt ions pose some problems, such as separation difficulties and significant biotoxicity. So considerable researchers have been committed to develop heterogeneous Co-based catalysts including Co3O4 and Co oxides/carbon composites, which could effectively reduce toxic contamination and improve the stability of the catalyst.13,14 Furthermore, some studies showed that some transition metals such as Fe, Cu, and Mn doping into the Co-based catalyst can significantly improve the activation performance of persulfates.15,16 Therefore, some researchers have exploited bimetallic multiphase catalysts to promote persulfates activation and enhance catalyst stability. Li8 and co-workers prepared Co0.8Fe2.2O4 nanocatalysts for PMS activation and found that the catalytic activity of Co0.8Fe2.2O4 was superior to Fe3O4 and Co3O4. Therefore, the incorporation of other metal components into a single metal oxide is benefit for the catalytic activity of PMS.
However, the application of metal oxide catalysts is greatly limited by agglomeration, few active sites, and a limited surface area.17,18 Therefore, supported metal oxide catalysts have been extensively studied in the field of wastewater treatment.19,20 Loading metal oxides onto materials with a large specific surface area can increase the distribution density of the active sites, thus improving the catalytic activity of the catalyst.21 Palygorskite (PAL) is a natural mineral with a thin sheet structure. Owing to its low price, large specific surface area, and strong chemical stability, PAL has been developed as a support for loading metallic nanoparticles.22,23 Li24 and co-workers synthesized MoS2/PAL via a hydrothermal method and applied in the reduction of 4-nitrophenol, the results proved that MoS2/PAL could prevent the agglomeration of MoS2 nanoparticles, and its catalytic activity was more excellent than MoS2.
In this study, various common metal salt solutions were selected as precursors, and different bimetallic oxides were loaded onto PAL through impregnation–calcination method. The microscopic morphology and crystallographic structure of catalysts were characterized by SEM, XRD, and BET. The optimal catalyst was used to activate PMS and degrade rhodamine B (RhB) solution. The effects of some important experimental conditions on the catalytic degradation process were investigated. The main active species in the catalytic system were explored, and the stability and reusability of the catalysts were also evaluated. These studies are intended to provide a reference for the treatment of dye wastewater with persulfate.
2. Materials and methods
2.1 Materials and chemicals
The palygorskite (PAL, 0.35–0.45 mm) used was obtained from Jiangsu Meishibo Co., Ltd (China). Peroxymonosulfate (PMS, KHSO5·0.5KHSO4·0.5K2SO4) was purchased from Shanghai Macklin Biochemistry Technology Co., Ltd (China). Cobalt nitrate hexahydrate (Co(NO3)2·6H2O), iron nitrate nonahydrate (Fe(NO3)3·9H2O), copper nitrate trihydrate (Cu(NO3)2·3H2O), manganese chloride tetrahydrate (MnCl2·4H2O), rhodamine B (RhB), methanol (MeOH) and tert-butyl alcohol (TBA) were purchased from Sinopharm Chemical Reagent Co., Ltd (China). All solutions used in the experiments were prepared using deionized (DI) water.2.2 Sample preparation
The PAL was sonicated in DI water for 30 min and washed several times to remove impurities from the PAL surface, and then the PAL was dried in an oven at 70 °C for 8 h. After drying, the PAL was sealed in a sample bag for later use. 5 g of Co(NO3)2·6H2O and Fe(NO3)3·9H2O were dissolved in 100 mL of DI water to prepare the precursor solution, and then PAL (15 g) was immersed in this precursor solution for 24 h. Removing the PAL from the solution and drying in an oven at 70 °C for 8 h. The soaked PAL was calcined in a muffle furnace at 500 °C for 3 h and the resultant catalyst was labeled as CoFe@PAL. The same method was used to prepare the CoCu@PAL, CoMn@PAL, FeCu@PAL and FeMn@PAL catalysts.In addition, a series of CoFe@PAL prepared at different calcination temperatures and different concentrations of impregnation solution were denoted as xCoFe@PAL-y, where x and y stand for the calcination dosage of metal salt in the impregnation solution and temperature, respectively.
2.3 Characterization
The microstructure and surface elemental distribution of the samples were analyzed by a field emission scanning electron microscopy (FE-SEM) (SIGMA300, Zeiss, Germany) equipped with energy dispersive spectrometer (EDS). The crystal structure of the samples was analyzed by X-ray diffractometry (XRD) (Smartlab 9 kW, Rigaku, Japan). The elemental information (Fe and Co) of samples was determined by X-ray Photoelectron Spectroscopy (XPS) (ESCALAB 250Xi, Thermo Scientific, USA). The Brunauer–Emmett–Teller (BET) specific surface area and pore size distributions of the samples were analyzed on a Micromeritics ASAP 2460 instrument. The generated reactive radicals in the system were detected by Electron paramagnetic resonance (EPR) (Bruker A300 spectrometer, Germany).2.4 Experiment procedures
The adsorption and degradation experiments were performed on a magnetic stirrer. A total of 5 mL of 200 mg per L RhB dye was dissolved in 100 mL DI water as the feed solution. Subsequently, the oxidant PMS and catalyst were added and then mixed evenly by stirring with a magnetic stirrer. A certain amount of water sample was collected at a certain time and filtered through 0.22 μm filter, and then detected the absorbance of the samples at λ = 554 nm on a UV-vis spectrophotometer (UV5800H, China). RhB concentration is proportional to the absorbance at the corresponding wavelength, and the degradation rate of RhB is calculated using the following equation:
 | (1) |
The apparent first-order-rate constants was calculated as follows:
 | (2) |
3. Results and discussion
3.1 Characterization of CoFe@PAL
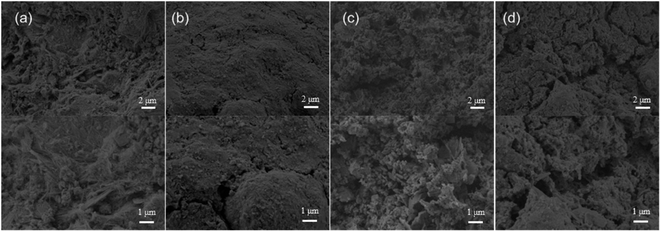
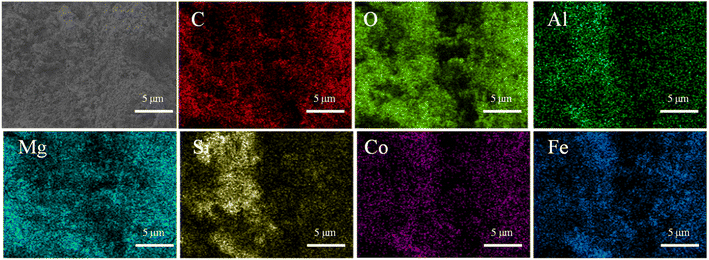
Fig. 1 shows the SEM images of PAL and CoFe@PAL prepared at different calcination temperatures. From the SEM images of PAL at low and high magnification, the surface of PAL was consisted of flat fibers, and most of them were gathered into clusters. Compared to PAL, the surface of CoFe@PAL showed weak fiber structure and abundant pores (Fig. 1b–d), some spheres and sheets of nanoparticles were distributed on the surface of CoFe@PAL, indicating the successful loading of Co and Fe species.25 Specifically, few nanoparticles were observed on the surface of 5CoFe@PAL-400, while a lot of nanoparticles were uniformly distributed on the surface of 5CoFe@PAL-500. When the prepared temperature reached 600 °C, the size of nanoparticles on the surface of 5CoFe@PAL-600 further increased, due to nanoparticles accumulating with each other at a high temperature.26The EDS spectrum images of 5CoFe@PAL-500 were presented in Fig. 2, showing that 5CoFe@PAL-500 is composed of C, O, Al, Mg, Si, Co and Fe element. Among them, the proportion of Co and Fe was 1.14% and 7.95%, respectively. In addition, distribution maps of elements confirmed that each element was uniformly distributed in the 5CoFe@PAL-500.
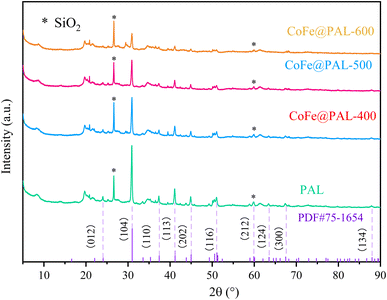
Further, XRD spectra of PAL and CoFe@PAL are shown in Fig. 3. The diffraction peaks at 26.62° and 60.04° corresponding to (011) and (121) were well indexed to SiO2, proving that SiO2 is the component of PAL. Moreover, the XRD patterns of all samples demonstrate almost the same characteristic reflections at 2θ = 24.08°, 33.50°, 36.52°, 41.08°, 44.88°, 51.02°, 60.08°, 63.48°, 67.48° and 87.88°, all of which can be perfectly indexed to dolomite (PDF#75-1654). These results indicated that the type of PAL used in this study is dolomitic palygorskite (palygorskite ≥ 20%, dolomite ≥ 40%). However, no diffraction peaks of Co or Fe species were detected, probably due to other peaks being too strong in the spectra.27 Additionally, the weaker diffraction intensity of CoFe@PAL as the calcination temperature increased may be attributed to the partial collapse of the PAL structure by high temperatures.28
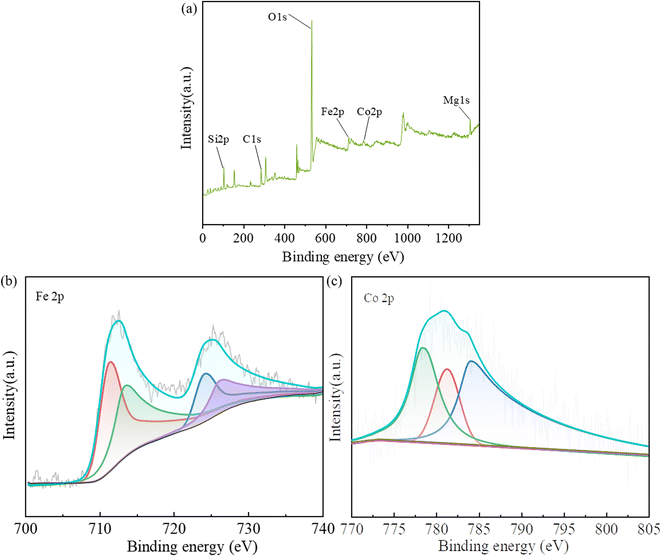
The XPS spectra of Fig. 4 show the chemical composition and valence state of CoFe@PAL catalyst. As shown in Fig. 4a, the full survey spectrum of catalyst revealed the presence of Co and Fe elements with the peak at 778.1 eV (Co 2p) and 706.1 eV (Fe 2p). The high-resolution spectra of Fe 2p and Co 2p are presented in Fig. 4b and c. As shown in Fig. 4b, the doublets of Fe 2p3/2 binding energies at 710.99 eV and Fe 2p1/2 binding energies at 724.08 eV were due to the contributions from Fe3+ ions in octahedral sites, and the doublets of Fe 2p3/2 binding energies at 713.00 eV and Fe 2p1/2 binding energies at 725.80 eV were due to the contributions from Fe3+ ions in tetrahedral sites.29 The XPS spectrum of Co 2p in CoFe@PAL (Fig. 4c) shows three peaks (779.06, 780.92 and 783.90 eV), which could be assigned to Co2+ ions in octahedral sites, tetrahedral sites and Co3+ ions in octahedral sites.8 The above results suggested that Fe(III), Co(III) and Co(II) are present on the surface of CoFe@PAL.
The BET specific surface area and pore size distributions of the materials were analyzed, and the results were shown in Fig. 5. According to IUPAC, all the samples exhibited a type IV isotherms with H3-type hysteresis loops, which indicated the presence of mesopores in PAL particles.19
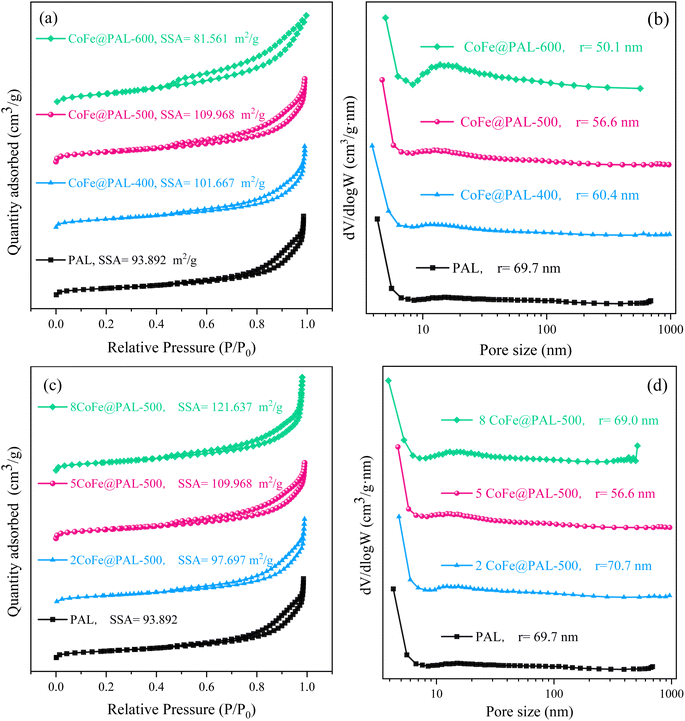 | ||
| Fig. 5 (a and c) N2 adsorption–desorption isotherms and (b and d) the corresponding pore size distributions of catalysts (SSA: specific surface area, r: average pore size). | ||
As shown in Fig. 5a, with calcining temperature rise, the specific surface area (SSA) of CoFe@PAL increased at first and then decreased; the CoFe@PAL-500 sample exhibited the highest specific surface area (109.97 m2 g−1) among all samples. In Fig. 5b, the average pore size of the catalysts showed a downward trend. The average pore size of 5CoFe@PAL-600 was 50.1 nm, which was smaller than that of 5CoFe@PAL-500 (56.6 nm) and 5CoFe@PAL-400 (60.4 nm). Compared with the PAL, the Co–Fe substance of the precursor solution gradually decomposed at 400 °C and 500 °C. Then the active particles were formed and dispersed on the carrier, leading to improve the specific surface area of CoFe@PAL slightly. However, agglomeration occurred among active particles at 600 °C, and the pores of the carrier were blocked by the agglomerated particles, resulting to the reduction of specific surface area and pore size, which is in accordance with the SEM results.
Fig. 5c and d show the effect of impregnation concentration on CoFe@PAL surface structure. As shown in Fig. 5c, the increasing impregnation concentration of catalysts caused a great increase in the specific surface area. The specific surface area of 8CoFe@PAL-500 reached 121.64 m2 g−1, due to the excess Co and Fe species were accumulated on the surface of catalyst. From Fig. 5d, the average pore size of PAL, 2CoFe@PAL-500 and 8CoFe@PAL-500 was 69.7 nm, 70.7 nm and 69.0 nm, respectively, showing no significant difference. However, the average pore size of 5CoFe@PAL-500 decreased to 56.6 nm obviously. Combined with the SEM image in Fig. 1c, a lot of active component particles on the surface of 5CoFe@PAL-500 filled and covered the small pores in PAL, resulting in a smaller pore size.
3.2 Catalytic performance of CoFe@PAL
In this study, five kinds of combinations of Co–Fe, Co–Mn, Co–Cu, Fe–Mn and Fe–Cu were selected to prepare catalysts. The catalytic performance of these coated samples was investigated by activating PMS to remove RhB. As shown in Fig. 6, the removal efficiency of RhB by PMS alone was only 5.54% after reacting for 60 min, revealing its negligible degradation capacity. The adsorption efficiency of RhB by PAL alone was 13.01%, indicating that only a tiny amount of RhB can be adsorbed by PAL. The simultaneous presence of PAL and PMS enhanced the removal efficiency of RhB with a removal efficiency of 22.84%. When the CoFe@PAL, CoMn@PAL, CoCu@PAL, FeMn@PAL, and FeCu@PAL was individually added to the PMS/RhB mixed solution, the removal rate of RhB reached 94.28%, 73.11%, 53.13%, 43.54% and 29.35%, respectively. These results indicate that CoFe@PAL presented the excellent performance on activating PMS to remove RhB, and the synergistic effect of adsorption and PMS activation accelerated the removal efficiency.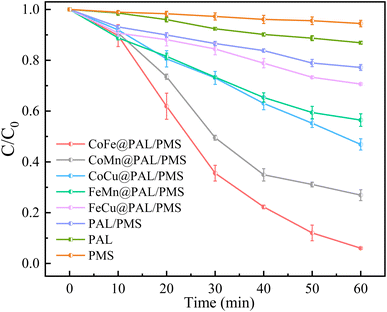 | ||
| Fig. 6 RhB removal performance in different systems ([RhB]0 = 10 mg L−1, [PMS]0 = 0.1 mM, [catalyst] = 1 g L−1). | ||
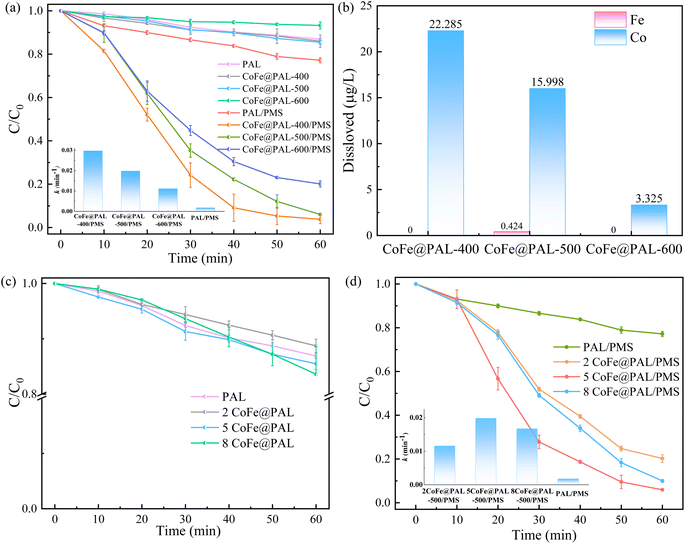
Considering the influence of preparation conditions, the effects of calcination temperature and impregnation concentration on RhB degradation were evaluated and the results are shown in Fig. 7. In Fig. 7a, the adsorption effect of PAL, CoFe@PAL-400 and CoFe@PAL-500 on RhB was 13.10%, 14.01% and 14.53%, respectively. However, the adsorption removal of RhB decreased, when the preparation temperature increased to 600 °C. Combined with BET characterization analysis, the specific surface area of CoFe@PAL-600 was significantly lower than that of the other three samples, which resulted in a lower adsorption performance. After adsorption experiments, the removal effects of RhB were studied in the presence of CoFe@PAL and PMS, as shown in Fig. 7a. To be specific, RhB was almost completely removed within 50 min in the CoFe@PAL-400/PMS system. However, about 94.28% and 79.90% RhB were degraded within 60 min in CoFe@PAL-500/PMS and CoFe@PAL-600/PMS systems, respectively. The apparent rate constant (k) of CoFe@PAL-400/PMS system was 0.029 min−1, which was much higher than that of other catalytic systems. Thus, the activity performance of CoFe@PAL was affected by its calcination temperature, and CoFe@PAL-400 showed the best catalytic activation.
The leaching of metal ions from the catalyst/PMS system can cause secondary contamination to the environment. In this study, the leaching of Co and Fe was detected by ICP-OES in different systems. As shown in Fig. 7b, the amount of dissolved Co ion in the CoFe@PAL-400/PMS system was 22.29 μg L−1. The amounts of dissolved Co ion decreased as calcination temperature increased from 400 °C to 600 °C. The precursor solution on the surface of support was not completely oxidized to metal oxides at low calcination temperature, leading to the residual metal salts leaching in water to produce Co ions. In addition, the concentration of leached Fe in the CoFe@PAL-500/PMS system was only 0.43 μg L−1, which was conformed to the discharge standard of iron.30 Therefore, CoFe@PAL-500, which dissolved a relatively low amount of Co ions, was selected for follow-up tests.
Fig. 7 illustrates the influence of impregnation concentration on RhB removal. Fig. 7c presented that adsorption efficiencies of RhB were 16.40%, 14.53%, and 11.27% by 8CoFe@PAL-500, 5CoFe@PAL-500, 2CoFe@PAL-500, respectively. Characterization analysis based on BET showed the specific surface area of 2CoFe@PAL-500 was 96.70 m2 g−1, smaller than those of 5CoFe@PAL-500 (109.97 m2 g−1) and 8CoFe@PAL-500 (121.64 m2 g−1). The higher specific area provided more adsorption sites for the reaction, which was conducive to enhancing the adsorption performance of catalyst.
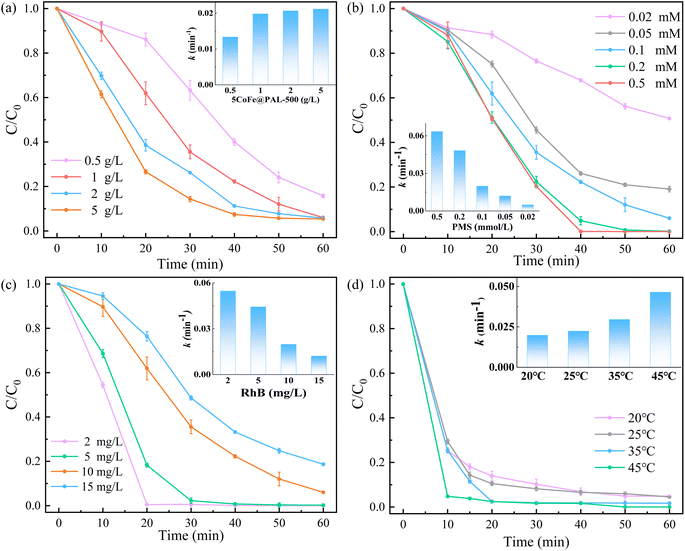
Fig. 7d shows that RhB degradation was significantly improved in the co-existence of PMS and catalysts. For example, approximately 79.79%, 94.28% and 90.03% of RhB were degraded in 2CoFe@PAL-500/PMS, 5CoFe@PAL-500/PMS and 8CoFe@PAL-500/PMS systems, respectively. The removal efficiency of RhB in the 2CoFe@PAL-500 system decreased because of the low concentration of the impregnation solution and less active substances on catalyst. The RhB degradation rate by 8CoFe@PAL-500 was slightly lower than that by 5CoFe@PAL, which may be due to excessive accumulation of active substances on the carrier. The active sites were generally reduced, leading to the reduced degradation rate of RhB. According to Fig. 7d, the value of k in 5CoFe@PAL-500/PMS system was the largest, indicating that the degradation rate of RhB in this system was fast. Therefore, CoFe@PAL prepared at 50 g L−1 of impregnation solution and 500 °C of calcination temperature is the optimum preparation conditions for PMS activation in this study.
The decomposition efficiency of PMS and TOC removal in the 5CoFe@PAL-500/PMS system was investigated and shown in Fig. 8. With the increase of PMS decomposition rate in the 5CoFe@PAL-500/PMS system, RhB was gradually degraded. After 60 min of reaction, the decomposition rates of PMS and RhB were 92.23% and 94.02%, respectively, suggesting that PMS was greatly activated by 5CoFe@PAL-500 catalyst to generate active species for RhB degradation. Moreover, the TOC removal rate was ∼36.5% in the 5CoFe@PAL-500/PMS system within 60 min.
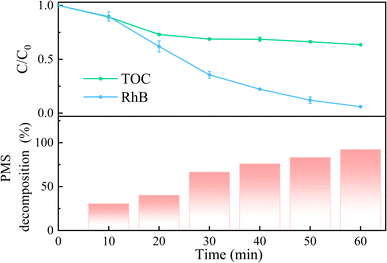 | ||
| Fig. 8 TOC removal rate, RhB degradation rate and PMS decomposition rate in the 5CoFe@PAL-500/PMS system ([catalyst] = 1 g L−1, [PMS]0 = 0.1 mM, [RhB]0 = 10 mg L−1). | ||
3.3 Removal of RhB by CoFe@PAL
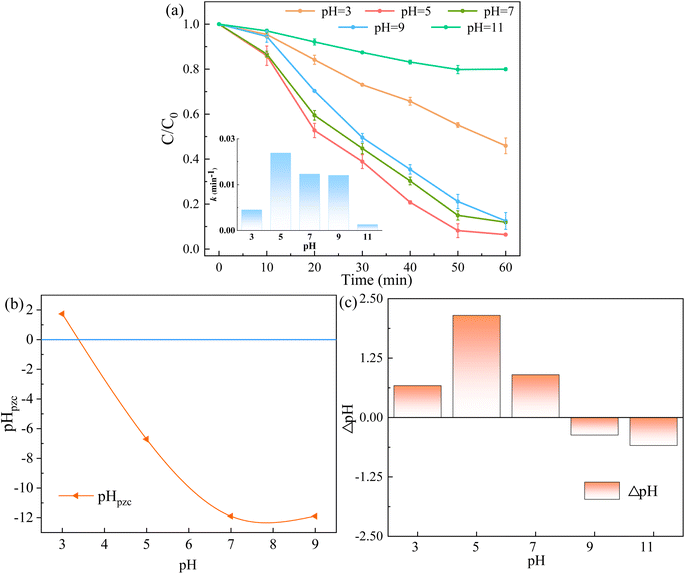
Furthermore, the pHpzc of 5CoFe@PAL-500 was determined in Fig. 10b. It shows that 5CoFe@PAL-500 was positively charged at pH = 3.0. And RhB (pKa = 3.1) was also in the form of cationic species at pH < 3.1.33 Therefore, the positive electric repulsive forces occur between RhB and 5CoFe@PAL-500 at pH = 3.0, resulting in unfavorable performance of RhB degradation.32 At high pH values, the generated sulfate radicals (SO4˙−) were inclined to react with the surrounding hydroxyl ions (OH−) to form hydroxyl radicals (˙OH), and followed by the conversion of ˙OH into its oxygen radical (O˙−) quickly (eqn (3) and (4)). Since the activity of the O˙− was much weaker than that of the SO4˙−, the RhB degradation rate became slower.34,35 This was confirmed by the final solution pH at the end of the reaction (Fig. 10c), which showed that the pH of the final solution decreased when the initial pH of the reaction was 9.0 and 11.0.
| SO4˙− + OH− → ˙OH + SO42− | (3) |
| ˙OH + H2O → O˙− + H3O+ | (4) |
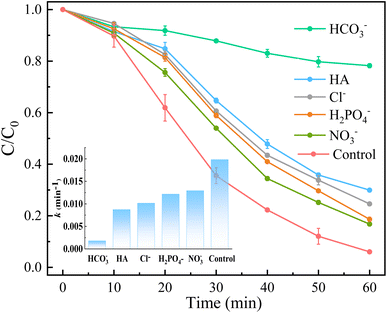
Inorganic anions and dissolved organic matter are widely present in natural water bodies. Therefore, the influences of typical inorganic anions (HCO3−, Cl−, H2PO4− and NO3−) and humic acid (HA) on RhB degradation efficiency in the 5CoFe@PAL-500/PMS system were explored. As shown in Fig. 11, inorganic anions and HA showed different inhibitory effects on the 5CoFe@PAL-500/PMS system. After adding 10 mM of HCO3−, Cl−, H2PO4− and NO3− into the system, the RhB degradation efficiency decreased from 94.28% to 21.78%, 75.40%, 81.36% and 83.23%, respectively. It can be attributed to the fact that HCO3−, Cl−, H2PO4− and NO3− quench ˙OH and SO4˙− of the system and generating less oxidative or more selective radicals such as CO3˙, Cl˙,  and
and  (eqn (5)–(8)).36 In addition, the presence of HCO3− increased the alkalinity of the reaction solution which resulted in the significant decrease of RhB degradation. When 10 mg L−1 of HA was added to the 5CoFe@PAL-500/PMS system, RhB degradation rate decreased to 70.06%. It can be attributed to the competition of HA with RhB for radicals and active sites on catalyst.19
 | (5) |
| Cl− + SO4˙− → Cl˙ + SO42− | (6) |
 | (7) |
 | (8) |
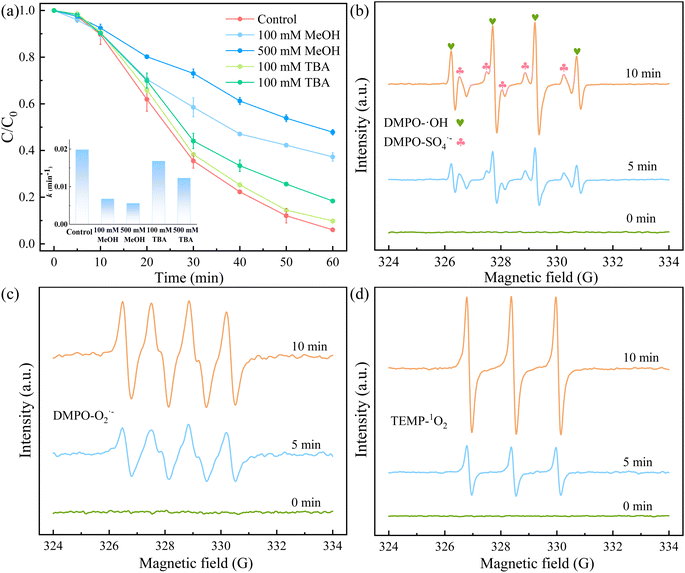
In addition, to further identify the active species generated in the 5CoFe@PAL-500/PMS system, DMPO was taken as the spin-trapping agents to capture signals of ˙OH, SO4˙−, and O2˙− by EPR. As shown in Fig. 12b, the characteristic signals for DMPO–˙OH (with a typical 1:2:2:1 quartet peak) and DMPO–SO4˙− adducts were simultaneously observed in the system, indicating that ˙OH and SO4˙− were generated during the activation of PMS by 5CoFe@PAL catalyst. Fig. 12c shows that O2˙− (with a typical 1:1:1:1 quartet peak) was also detected in the system. Utilizing TEMP as the trapping agent, a typical 1:1:1 triplet peak of the 1O2 signal was observed in the system (Fig. 12d).8,27,32 The above results show that ˙OH, SO4˙−, O2˙− and 1O2 radicals co-participated in the RhB degradation in the 5CoFe@PAL/PMS system.
According to Fig. 7 and 12a, the contribution of different pathways was evaluated for RhB removal in the 5CoFe@PAL-500/PMS system (Table 1). The adsorption contribution of 5CoFe@PAL-500 for RhB within 60 min was 15.41%. And the oxidative decomposition contribution of SO4˙− and ˙OH for RhB was 13.41% and 31.26%, respectively. Additionally, the total oxidative decomposition contribution of O2˙− and 1O2 for RhB was 39.92%.
| Action of different regions | 5CoFe@PAL-500 adsorption | 5CoFe@PAL-500/PMS | ||
|---|---|---|---|---|
| ˙OH | SO4˙− | O2˙− and 1O2 | ||
| RhB removal | 14.53% | 12.64% | 29.47% | 37.64% |
| Contribution percentage | 15.41% | 13.41% | 31.26% | 39.92% |
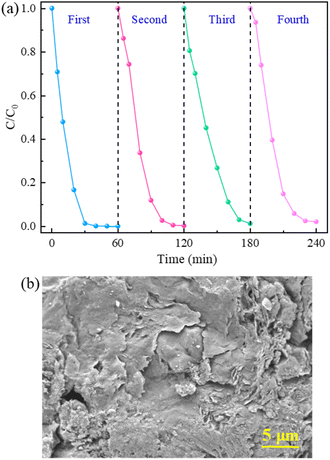 | ||
| Fig. 14 (a) RhB removal in the reusability tests, (b) SEM image of 5CoFe@PAL-500 after repeated tests ([catalyst] = 2 g L−1, [PMS]0 = 0.2 mM, [RhB]0 = 10 mg L−1). | ||
| Cycle index | Initial | First | Second | Third | Fourth |
|---|---|---|---|---|---|
| Quality/g | 0.2077 | 0.1864 | 0.1822 | 0.1791 | 0.1784 |
| Quality loss/% | 7.12 | 9.21 | 10.76 | 11.11 | |
| Quality loss/g | 0.0143 | 0.0185 | 0.0216 | 0.0223 |
4. Conclusions
In summary, the CoFe@PAL catalyst was successfully synthesized as a PMS activator for RhB removal. The CoFe@PAL exhibited the best catalytic performance for RhB degradation with 50 g L−1 of impregnation solution and 500 °C of calcination temperature. The optimized catalyst showed the efficiency of 94.28% within 60 min for RhB removal. In addition, the 5CoFe@PAL-500/PMS system showed the excellent capability of RhB removal at pH range of 5–9. Compared to other inorganic anions, HCO3− had a greater influence on the degradation effect in the system. The radical quenching experiments and EPR characterization revealed that ˙OH, SO4˙−, O2˙− and 1O2 radicals existed in the 5CoFe@PAL-500/PMS system simultaneously. The LC-MS analysis results indicated that the primary degradation mechanisms of RhB were deethylation, chromophore cleavage, and benzene ring opening. Finally, cycle experiments and SEM characterization proved that 5CoFe@PAL-500 maintained good stability and reusability. In conclusion, the resultant 5CoFe@PAL-500 is a promising catalyst for PMS activation and degradation of organic pollutants in aqueous solution.Conflicts of interest
There are no conflicts to declare.Acknowledgements
This work was supported by the National Natural Science Foundation of China (No. 52100010), the Key-Area Research and Development Program of Guangdong Province (No. CF872022000068), the Natural Science Foundation of Shandong Province (No. ZR2020ME256 and ZR2021QE185) and the Fund of Fujian Provincial Key Laboratory of Marine Ecological Conservation and Restoration (EPR2020009).References
- Y. Zhang, Q. Yang, J. Liang, Y. Luo, Q. Liu, Y. Yang and X. Sun, J. Solid State Chem., 2022, 169, 110893 CrossRef CAS.
- A. Y. Sham and S. M. Notley, J. Environ. Chem. Eng., 2018, 6, 495–504 CrossRef CAS.
- T. Depci, A. R. Kul and Y. Önal, Chem. Eng. J., 2012, 200, 224–236 CrossRef.
- H. Ni, M. Arslan, J. Wei, J. Dai, Z. Luo, R. Cai, S. Zhao, M. G. El-Din and Z. Wu, Sci. Total Environ., 2021, 785, 147272 CrossRef CAS.
- Y. Fan, Y. Ji, D. Kong, J. Lu and Q. Zhou, J. Hazard. Mater., 2015, 300, 39–47 CrossRef CAS PubMed.
- X. Duan, Z. Ao, H. Sun, L. Zhou, G. Wang and S. Wang, Chem. Commun., 2015, 51, 15249–15252 RSC.
- Q. Yang, Y. Yang, Y. Zhang, L. Zhang, S. Sun, K. Dong, Y. Luo, J. Wu, X. Kang and Q. Liu, Chemosphere, 2023, 311, 137020 CrossRef CAS PubMed.
- X. Li, Z. Wang, B. Zhang, A. I. Rykov, M. A. Ahmed and J. Wang, Appl. Catal., B, 2016, 181, 788–799 CrossRef CAS.
- X. Duan, C. Su, J. Miao, Y. Zhong, Z. Shao, S. Wang and H. Sun, Appl. Catal., B, 2018, 220, 626–634 CrossRef CAS.
- A. Rastogi, S. R. Al-Abed and D. D. Dionysiou, Appl. Catal., B, 2009, 85, 171–179 CrossRef CAS.
- G. P. Anipsitakis, D. D. Dionysiou and M. A. Gonzalez, Environ. Sci. Technol., 2006, 40, 1000–1007 CrossRef CAS PubMed.
- G. P. Anipsitakis and D. D. Dionysiou, Environ. Sci. Technol., 2003, 37, 4790–4797 CrossRef CAS PubMed.
- Q. Yang, Y. Zhang, J. Liang, Y. Luo, Q. Liu, Y. Yang and X. Sun, Colloids Surf., A, 2022, 648, 129239 CrossRef CAS.
- P. R. Shukla, S. Wang, H. Sun, H. M. Ang and M. Tadé, Appl. Catal., B, 2010, 100, 529–534 CrossRef CAS.
- Y. Luo, C. Liu, T. Mehmood, Y. Zhang, M. Yu and Y. Ren, J. Environ. Chem. Eng., 2021, 9, 106036 CrossRef CAS.
- Y. Ren, L. Lin, J. Ma, J. Yang, J. Feng and Z. Fan, Appl. Catal., B, 2015, 165, 572–578 CrossRef CAS.
- Y. Zhang, Q. Yang, L. Yue, Q. Liu, Y. Luo, J. Wu, X. Kang, S. Sun, Y. Yang and X. Sun, J. Water Process Eng., 2023, 51, 103324 CrossRef.
- R. Xie, J. Ji, H. Huang, D. Lei, R. Fang, Y. Shu, Y. Zhan, K. Guo and D. Y. Leung, Chem. Eng. J., 2018, 341, 383–391 CrossRef CAS.
- X. Lei, M. You, F. Pan, M. Liu, P. Yang, D. Xia, Q. Li, Y. Wang and J. Fu, Chin. Chem. Lett., 2019, 30, 2216–2220 CrossRef CAS.
- T. Warang, N. Patel, R. Fernandes, N. Bazzanella and A. Miotello, Appl. Catal., B, 2013, 132, 204–211 CrossRef.
- L. Chen, S. Yang, X. Zuo, Y. Huang, T. Cai and D. Ding, Chem. Eng. J., 2018, 354, 856–865 CrossRef CAS.
- X. Li, H. Shi, W. Zhu, S. Zuo, X. Lu, S. Luo, Z. Li, C. Yao and Y. Chen, Appl. Catal., B, 2018, 231, 92–100 CrossRef CAS.
- G. Tian, W. Wang, L. Zong, Y. Kang and A. Wang, Chem. Eng. J., 2016, 293, 376–385 CrossRef CAS.
- X. Li and K. Peng, Appl. Clay Sci., 2018, 162, 175–181 CrossRef CAS.
- B. Saravanakumar, S. Ramachandran, G. Ravi, V. Ganesh, R. K. Guduru, A. Sakunthala and R. Yuvakkumar, J. Nanosci. Nanotechnol., 2020, 20, 96–105 CrossRef CAS PubMed.
- L.-L. Shen, K. Xia, W.-Z. Lang, L.-F. Chu, X. Yan and Y.-J. Guo, Chem. Eng. J., 2017, 324, 336–346 CrossRef CAS.
- C. Chen, L. Liu, Y. Li, W. Li, L. Zhou, Y. Lan and Y. Li, Chem. Eng. J., 2020, 384, 123257 CrossRef CAS.
- S. Guo, Z. Yang, H. Zhang, W. Yang, J. Li and K. Zhou, J. Mater. Sci. Technol., 2021, 62, 34–43 CrossRef CAS.
- Z. Zhou, Y. Zhang, Z. Wang, W. Wei, W. Tang, J. Shi and R. Xiong, Appl. Surf. Sci., 2008, 254, 6972–6975 CrossRef CAS.
- X.-H. Yi, T.-Y. Wang, H.-Y. Chu, Y. Gao, C.-C. Wang, Y.-J. Li, L. Chen, P. Wang, H. Fu and C. Zhao, Chem. Eng. J., 2022, 449, 137784 CrossRef CAS.
- H. Fu, S. Ma, P. Zhao, S. Xu and S. Zhan, Chem. Eng. J., 2019, 360, 157–170 CrossRef CAS.
- P. Duan, T. Ma, Y. Yue, Y. Li, X. Zhang, Y. Shang, B. Gao, Q. Zhang, Q. Yue and X. Xu, Environ. Sci.: Nano, 2019, 6, 1799–1811 RSC.
- F. López Arbeloa, T. López Arbeloa, M. Tapia Estévez and I. López Arbeloa, J. Chem. Phys., 1991, 95, 2203–2208 CrossRef.
- L. Gan, Q. Zhong, A. Geng, L. Wang, C. Song, S. Han, J. Cui and L. Xu, Sci. Total Environ., 2019, 694, 133705 CrossRef CAS PubMed.
- L. Xu, W. Chu and L. Gan, Chem. Eng. J., 2015, 263, 435–443 CrossRef CAS.
- S. Wang, Q. Wu, R. Huang, Y. Guo, B. Yan, X. Hao, J. Li, W. Xia and J. Tian, J. Water Process Eng., 2022, 47, 102751 CrossRef.
- S. Wang, Q. Wu, B. Yan, Y. Guo, W. Xia, J. Li, F. Cui and J. Tian, Sep. Purif. Technol., 2022, 291, 120874 CrossRef CAS.
- F.-X. Wang, Z.-C. Zhang, X.-H. Yi, C.-C. Wang, P. Wang, C.-Y. Wang and B. Yu, Crystengcomm, 2022, 24, 5557–5561 RSC.
- J. Shi, Z. Ai and L. Zhang, Water Res., 2014, 59, 145–153 CrossRef CAS PubMed.
- Y. Wang, F. Li, T. Xue, C. Liu, D. Yuan, F. Qi and B. Xu, Environ. Sci. Pollut. Res., 2018, 25, 4419–4434 CrossRef CAS PubMed.
| This journal is © The Royal Society of Chemistry 2023 |

